400,000 loss made me completely awake — the truth about making money in the coin circle is not relying on 'holding on', but on 'rolling over'. I tested this strategy with 5,000 U and within 2 months it surged to 50,000 U. Today, I will break down the 3 core steps for you.
Step 1: Choose coins — only play the 'high volatility death game'
90% of people fail in rolling over because they chose the wrong coins. BTC/ETH are too stable, MEME coins are too crazy, the real opportunities are:
Newly listed contract coins (like ENA, NOT, ZRO) — volatility rate 300%+ in the first 3 days before the launch
High control small coins (like PEPE, WIF) — when the dealer pulls the disk, it can explode by 50% in 1 hour
Key indicators: sudden doubling of volume at the 4-hour level, RSI oversold and turning (but don't wait for a golden cross; by then, it is already too late).
Fatal detail: never touch 'falling coins', only play 'volume breakout coins' - candlestick must be steep like a knife!
Step 2: Open positions - the 'profit breeding technique' with 3x leverage.
The core of rolling positions is not 'betting large', but 'profit reinvestment'.
Initial position 500 USDT (10% of capital), 3x leverage, stop loss 5%** - if you lose, you only lose 25 USDT, but once you profit and roll it over to 30%, increase the position to 1000 USDT, still at 3x** - using profits to gamble, the mindset is completely different.
Key strategy: only add to positions when 'breakout retests do not break', for example, after a 20% price surge followed by a 10% pullback without breaking the previous high.
I started with an initial position of 500 USDT on NOT, rolled it to 30% profit and increased the position to 1000 USDT, and ultimately rolled it to 4500 USDT.
Step 3: Take profits - how to secure a profit of 50,000 USDT?
90% of people double their money and then lose it all because they don't know how to take profits at the peak.
My rules:
After 100% profit, withdraw the principal - 5000 USDT turns into 10,000 USDT? Withdraw 5000 USDT first, the rest is pure profit.
Sell half immediately when it breaks below EMA7 - don't wait for a retracement; profits can evaporate instantly.
Ultimate signal: when the open interest of exchange contracts suddenly drops by 20%, it is when the market makers are offloading.
If you really want to turn 5000 USDT back into 50,000 USDT, start executing now. But the key is the 'opportunity to take profits at the peak'.
Remember: the most profitable money in the cryptocurrency market always belongs to those who know how to roll positions. But if you can't control your greed, liquidation will come even faster.
 Here are some insights from a friend of mine in the cryptocurrency world for ten years who has made tens of millions! My friend is free, full of valuable content!!
1. When the market crashes, if your coin only drops slightly, it indicates that there are market makers protecting the price, preventing it from falling. Such coins can be held with peace of mind, and there will surely be rewards in the future.
2. Newbies trading cryptocurrencies have a simple and direct method: for short-term trades, look at the 5-day moving average; as long as the coin price is above the 5-day moving average, hold it; once it drops below, sell; for medium-term trades, look at the 20-day moving average, hold it above the 20-day moving average, and sell once it drops. The best method is the one that suits you, and the key is to stick to execution.
3. If a coin has formed a major uptrend and there is no obvious increase in volume, then buy decisively. Continue holding during volume increases, hold on even if volume decreases but the trend has not broken; if there's a significant drop in volume and it breaks the trend, then reduce your position quickly.
4. After buying short-term, if the coin price doesn't move within three days, sell if you can. If the price drops after buying and the loss reaches 5%, stop loss unconditionally.
5. If a coin has dropped 50% from its high and has been declining for eight consecutive days, it indicates that it has entered an oversold state, and a rebound could happen at any time, so consider following up.
6. When trading cryptocurrencies, choose leading coins, as they rise the most when they are bullish and are the most resilient when they fall. Don't buy just because the price has dropped significantly, and don't refrain from buying just because the price has risen a lot. When trading leading coins, the most important thing is to buy at high levels and sell at even higher levels.
7. Trade in accordance with the trend; the buying price shouldn't just be the lowest, but the most appropriate. Don't easily call a bottom during a decline; let go of those underperforming coins. The trend is what matters most.
8. Don't let temporary profits get to your head; continuous profitability is the hardest part. Review your trades seriously to see if your profits were due to luck or skill. Establishing a stable trading system that suits you is key to sustained profitability.
9. Don't force trades without sufficient confidence. Being out of the market is also a strategy; learning to stay out is important. The primary consideration in trading should be capital preservation, not profit. The competition in trading is not about frequency, but about success rate.
I played with 200,000 four years ago, and now it's 20 million, easily achieving a hundredfold profit. The experience summary is below for everyone's reference and learning!
Making money from trading is actually that simple; just follow these three steps! Master it and easily multiply your account by 10 times!
Step 1: First, look at the trend.
Step 2: Find key levels again.
Step 3: Find entry signals.
Entry, profit-taking, closing, and leaving.
Isn't it simple?
Let's elaborate on this a bit more.
Step 1: First, look at the trend.
The state of a market can yield three outcomes: uptrend, sideways, downtrend.
What is a big trend? Look at charts with a 4-hour period or longer.
For example, 4 hours, daily, weekly (my personal habit is to look at 4 hours).
Go long when prices rise, go short when prices fall, and don't trade when prices are range-bound.
Step 2: Look for key levels.
Whether the market is rising or falling, it will bounce up and down like a bouncing ball, level by level.
What we need to do is enter at the point it jumps and exit at the next drop. How to find the precise steps becomes key. #Bitcoin, which we refer to as the key levels (main support and resistance levels).
Step 3: Look for signals. Generally, if you find a trend in a larger timeframe, you should look for trading signals in a smaller timeframe. #Ethereum, everyone has their own strengths in trading strategies; mastering one or two is enough.
More importantly, quickly formulate a trading strategy.
A complete trading strategy includes.
(1) Underlying - what to trade;
(2) Position size - how much to hold;
(3) Direction - long or short;
(4) Entry point - at what price to trade;
(5) Stop loss - when to exit losing trades;
(6) Profit-taking - when to exit profitable trades;
(7) Countermeasures - how to respond to emergencies;
(8) Follow-up - actions after the trade ends.
Opening a position follows the core of trading: the flexible use of technology, position size, and strategy.
Let me share a set of my own practical strategies that have achieved an average win rate of 80%, which is quite a rare achievement in the cryptocurrency trading world.
Without further ado, let's get straight to the point!
In two years, I turned 3000 into over 10 million with this (Fibonacci technical indicator trading). If you read this article carefully, you will benefit for a lifetime!
What is the Fibonacci sequence and the secrets behind Fibonacci trading tools?
What exactly is the Fibonacci sequence?
Where did it originate?
The Fibonacci sequence was first discovered by mathematician Leonardo Bonacci in 1202, resulting in the following: 1, 1, 2, 3, 5, 8, 13, 21, 34, 55, 89, 144, 233, 477.
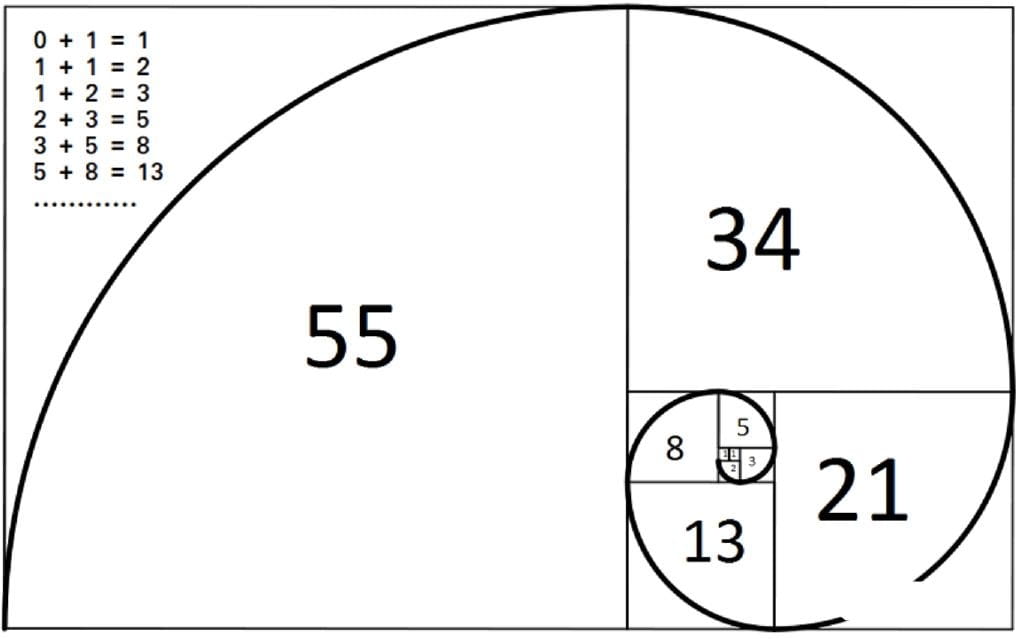 To understand all this, how is the Fibonacci sequence formed?
It's simple! It is formed by adding the two previous numbers together.
So, if you add 5 and 8, you get 13, and if you add 55 and 89, you get 144, and so on...
Now, many people also tend to relate this sequence to plants and other 'natural' phenomena...
 There are also financial markets.
 Did you know that the numbers on Fibonacci trading tools are not actually the Fibonacci sequence itself?
Let me prove it to you...
Similarly, this is what the Fibonacci sequence looks like: 1, 1, 2, 3, 5, 8, 13, 21, 34, 55, 89, 144, 233, 477.
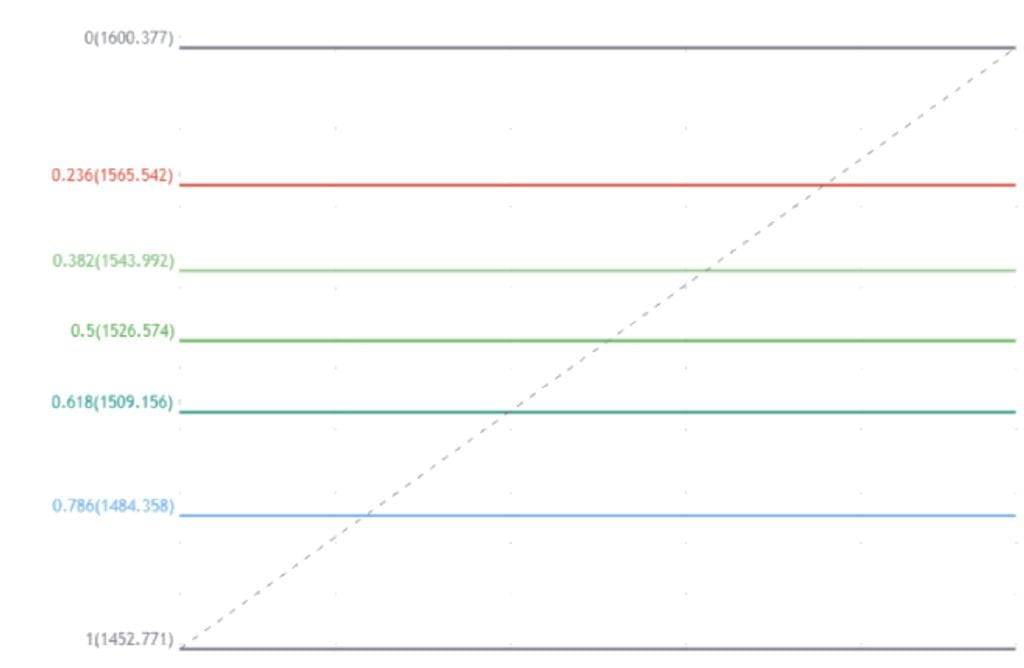
So the numbers of most Fibonacci tools are as follows: 0.236, 0.382, 0.618, 0.786, 0.886, 1.236.
So, where do these numbers come from?
The answer is that the numbers we use on Fibonacci trading tools are 'ratios', not 'sequences'.
For example, if you divide the previous number in the sequence by the next number, like 21 and 34, you will get 0.6176 (61.8%).
However, if you divide two spaced numbers, like 21 and 55, you will get 0.3818 (38.2%).
Now, if you think about it, wouldn't it be more fitting to use percentages or ratios instead of purely numeric sequences in financial markets?
So now you know what the entire Fibonacci sequence and ratios are about...
Let's dive deeper into how to apply this to trading.
What different Fibonacci trading tools are there and how to apply them.
Despite the various Fibonacci tools available, these two are the most widely used:
Fibonacci retracement.
Fibonacci extension.
To be honest, the two tools above are the ones you will often use.
Let me briefly explain this now and outline how to apply them.
Fibonacci retracement.
 Aside from numbers based on the Fibonacci sequence...
One of its purposes is to 'predict' when a pullback will end, as traders expect a trend reversal to occur when the price reaches the golden ratio of 31.8% or 6.18% and breaks through.
BTCUSD weekly chart rebounds at 61.8%:
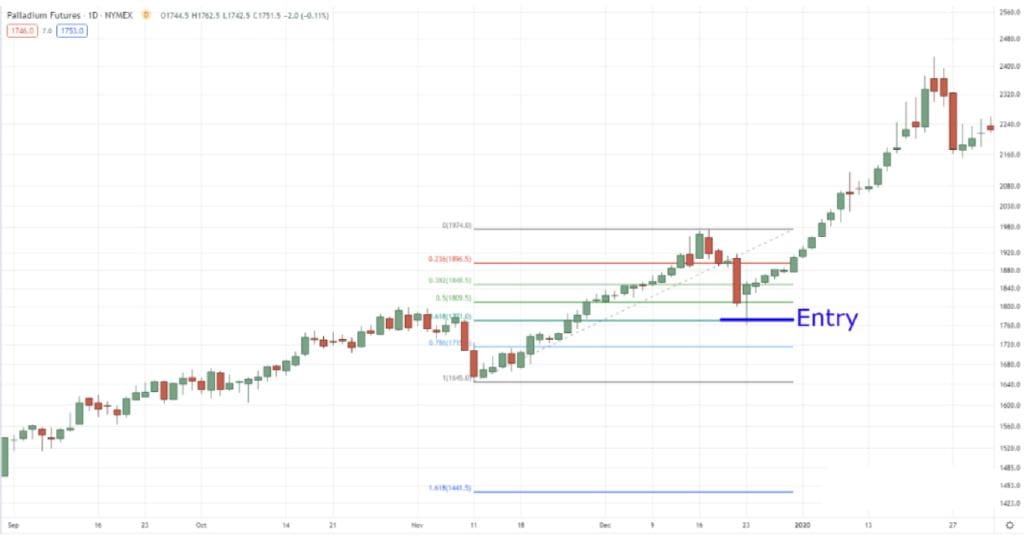
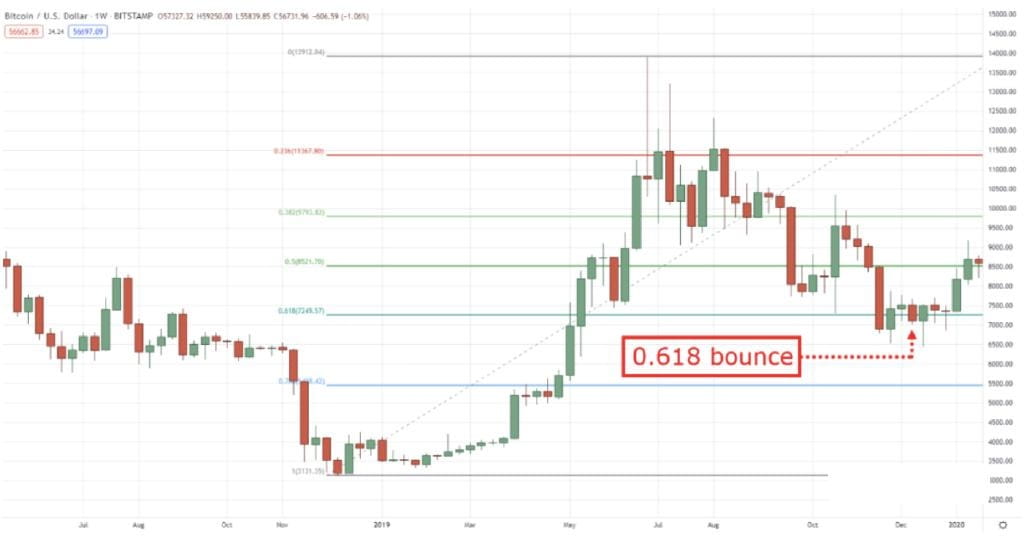 However, many traders use this tool to enter trades during pullbacks in hopes of capturing existing trends.
Fibonacci retracement entry on the palladium daily chart:
 Fibonacci extension.
Traders use this tool to 'predict' how far a trend will go.
 It looks quite good.
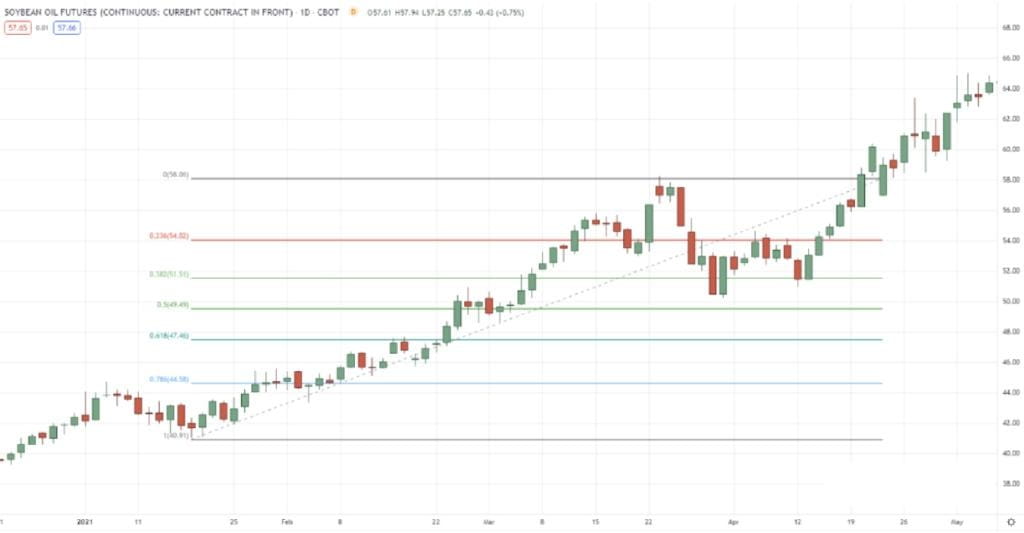
But at the same time, many traders use this tool to determine where they should take profits.
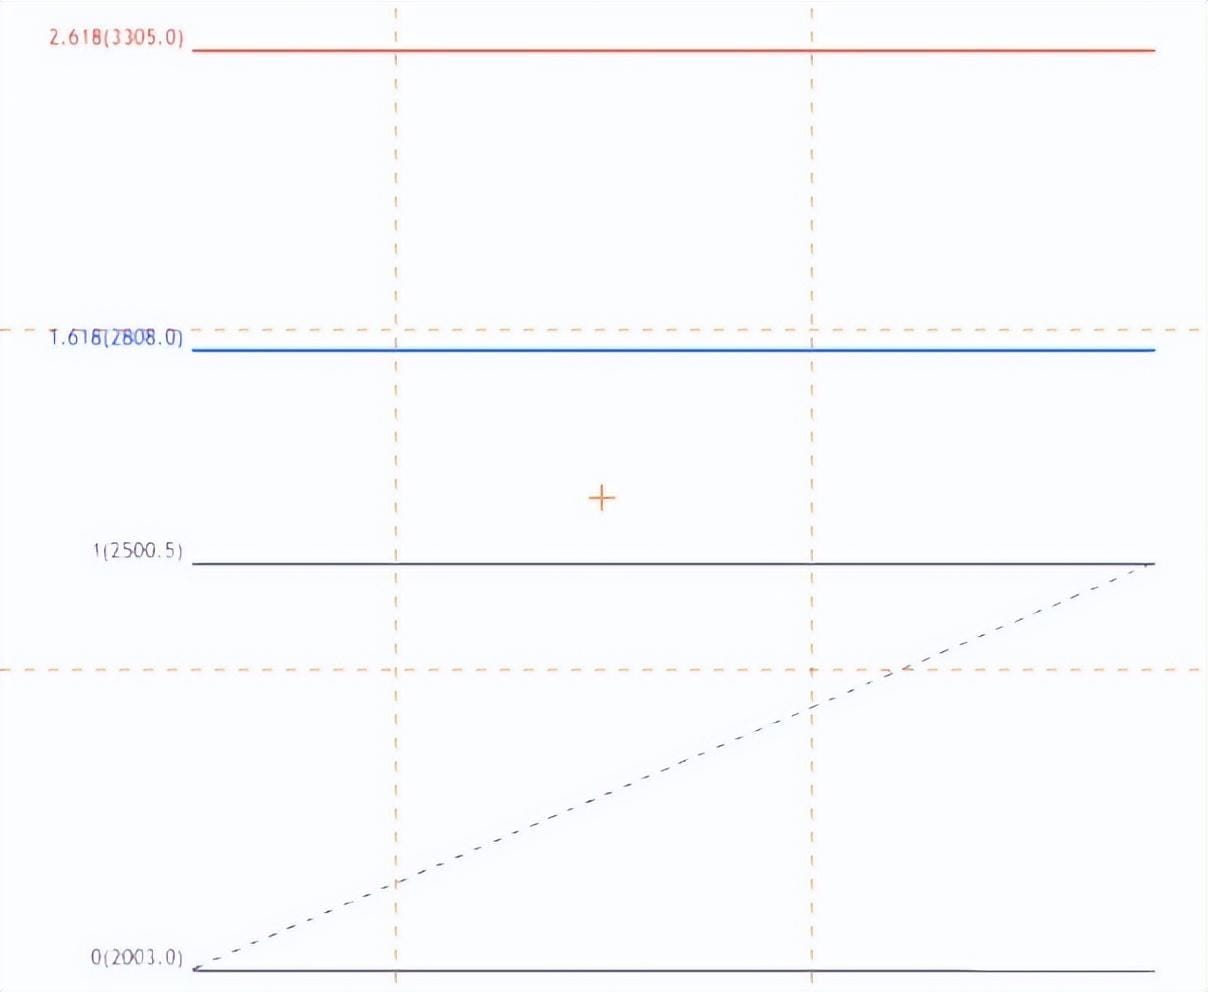
Profit locations for Fibonacci extension on the soybean oil futures daily chart:
Are you now feeling inspired to trade using Fibonacci retracement tools?
But I know you must have this question in mind right now:
“Cool charts, dude, how do we apply these tools in real-time?”
“Do we need to consider the candle wicks when drawing, or just look at the candle bodies?”
Don't rush; let me explain slowly!
Since we use Fibonacci retracement tools to calculate the timing of pullback reversals, you need to gauge the entire trend movement:
 When drawing Fibonacci retracements, you need to consider the candle wicks.
Since we are looking for timing trend reversals, you also need to measure the entire trend movement prior.
 Correctly drawing Fibonacci retracements takes time and practice because market price action can sometimes be volatile.
Incorrect ways to use Fibonacci trading tools.
As you can see, common Fibonacci trading tool sequences include:
23.6%
38.2%
50.0%
61.8%
78.6%
88.6%
123.6%
138.2%
161.8%
178.6%
And so on...
However, once you use Fibonacci tools for trading for a while, you will begin to experience:
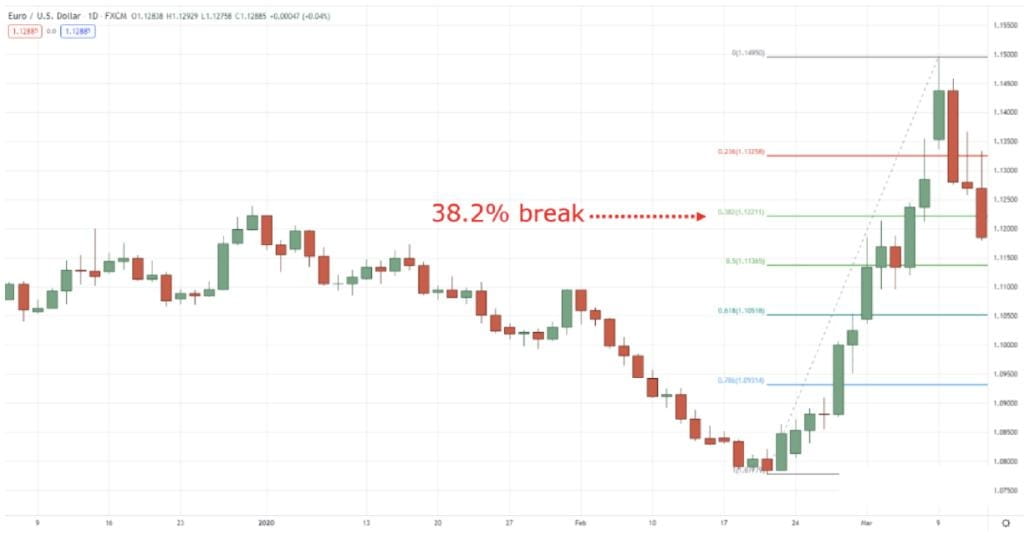
“Oh no, the price broke below 38.2%, but it rebounded at 61.8%, hold steady!”
EURUSD daily chart breaks above 38.2%:
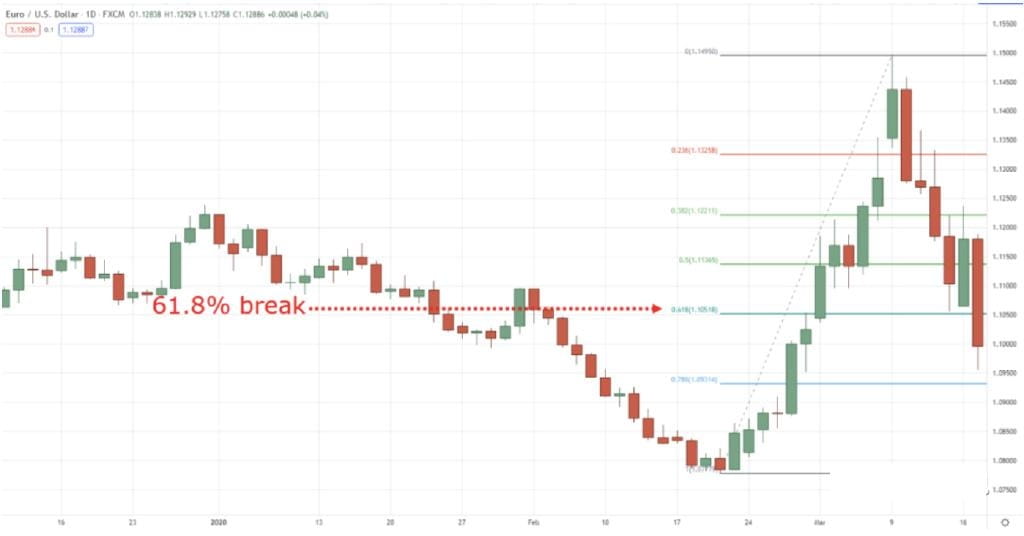
 “What the heck? The price has already broken and closed below 61.8%, I believe it will bounce back to 78.6% this time. Time to add to the position!”
EURUSD daily chart breaks above 61.8%:
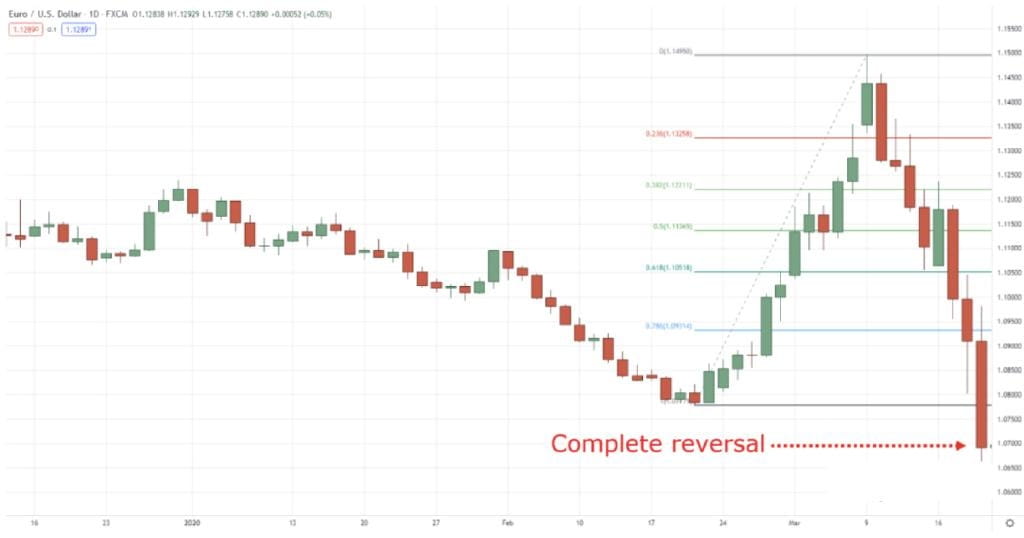
 Before you know it... the trend completely reverses, and you may experience significant losses.
Completing the reversal in the EURUSD daily chart:
 Can you understand what I'm saying?
Prices always have a new 'golden ratio'.
Meanwhile... prices can reverse between Fibonacci levels:
 Most importantly, you don't necessarily have to rely on the Fibonacci sequence because they are not as 'golden' as you might think - the market will go wherever it wants.
So at this point, you might be wondering:
“Does this mean Fibonacci trading tools don't work?”
“Are these tools nearly useless in the long run?”
“Is there any other way?”
Don't worry. This article will provide answers for you.
Fibonacci trading tools are not useless.
Have you noticed that I always add the word 'tools' every time I mention Fibonacci?
You see... if you use Fibonacci retracement and extension as 'tools' to complement your trading 'arsenal', you will start to utilize them rather than depend on them.
This means you shouldn't use Fibonacci trading tools as emotional tools, but rather as trade management tools to objectively assist your entries and exits.
Fibonacci trading tips to improve your strategy.
In this section, I won't teach you how to use Fibonacci trading tools to analyze the market or become a Fibonacci expert.
 On the contrary, I will teach you how to use and apply them in trading.
You should know that a good trader is different from a good analyst.
Now, how do you utilize Fibonacci trading tools boils down to two things:
Entry and exit triggers.
Expand/scale down your trades.
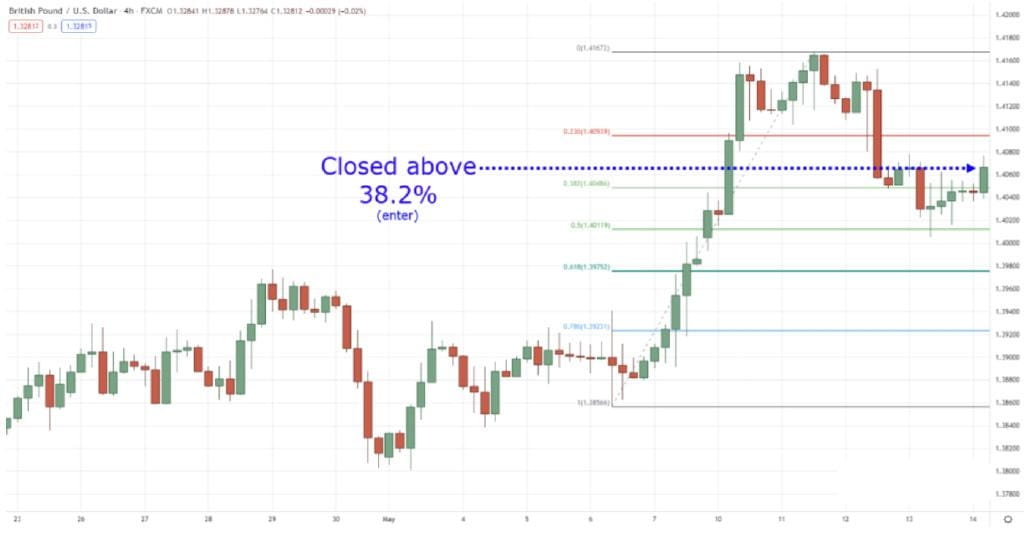
 Then wait for the price to close back above 38.2% as an entry signal.
The price closed above 38.2% in the GBPUSD daily chart:
 Of course, you can apply the same concept at the 61.8% level.
But the principle behind it: you want to capture false breakouts and use the Fibonacci retracement tool as an objective way to enter.
So what about exits? How do you set stop losses and where do you take profits?
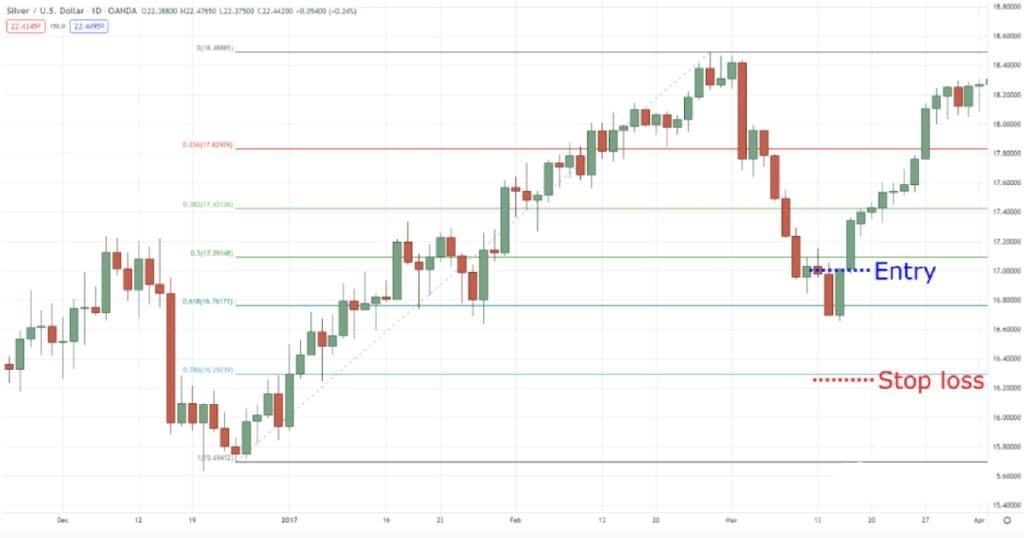
Therefore, assume you enter a trade on a false breakout at the 61.8% level... you might consider setting the stop loss below the next Fibonacci level, which is 78.6%.
Initial stop loss at 78.6% in the XAGUSD daily chart:
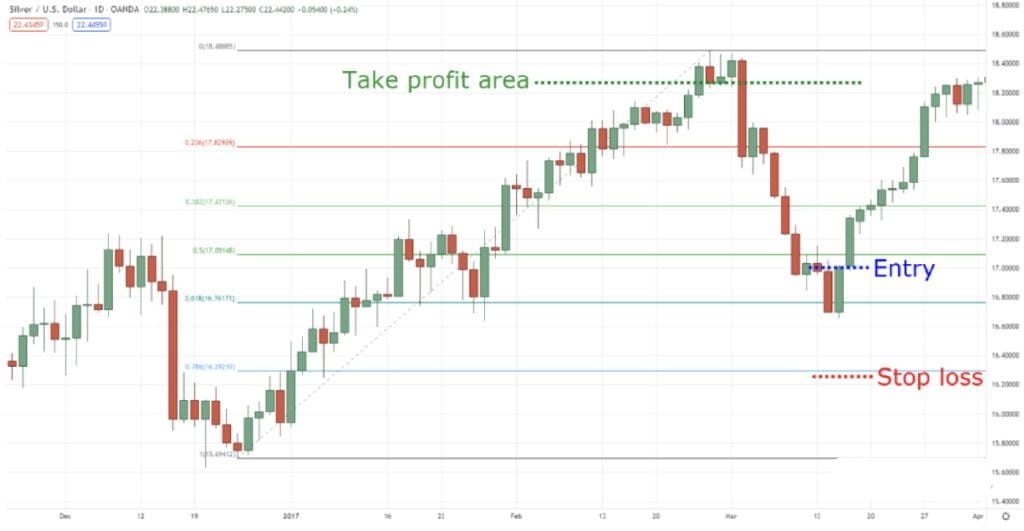
 And take profits before the recent high point (or 100%) because you want to exit the trade before potential short-selling pressure arises.
Profit areas in the XAGUSD daily chart:
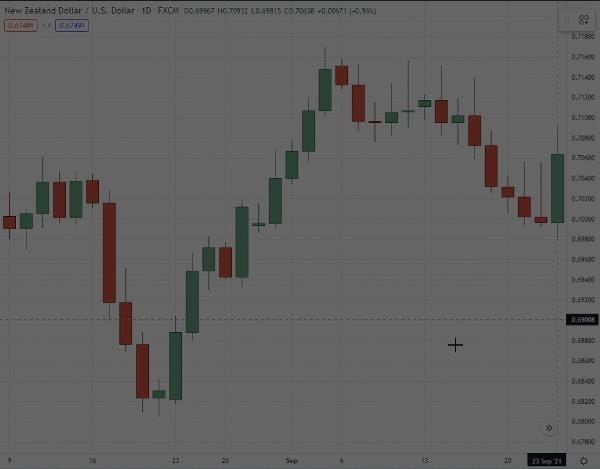
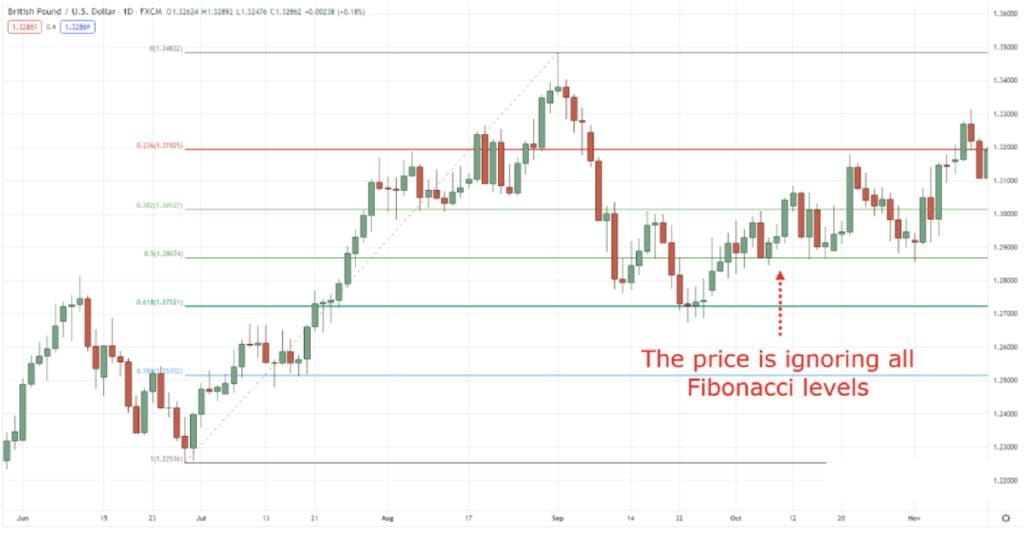
 So what if the price is on a parabolic trend?
As you can see, it hardly touches any 'golden' ratios; what should you do?
It's simple.
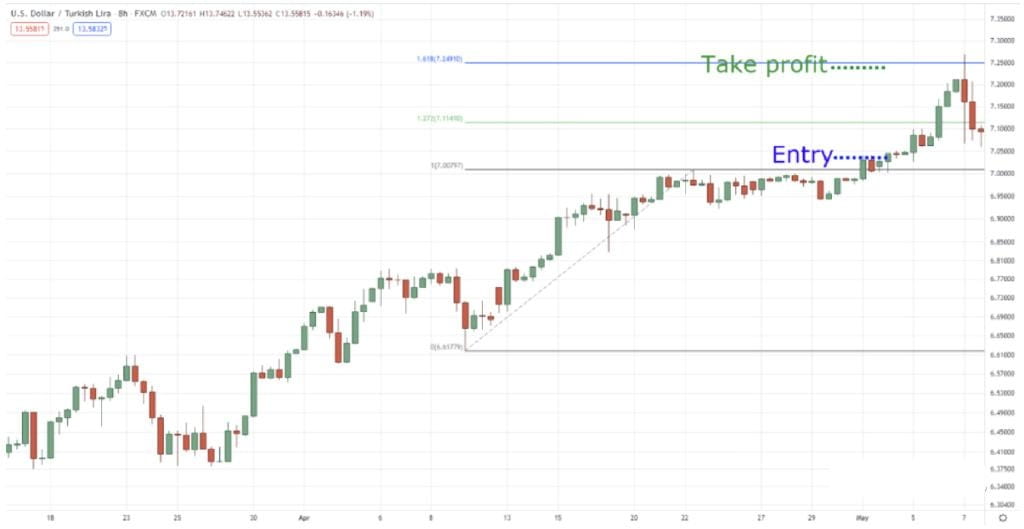
Enter trades on breakouts and time using the Fibonacci extension tool before 161.8%.
Breakout setup in the USDTRY 8-hour timeframe:
 On this point, I've only shared how to use Fibonacci trading tools in trending markets.
So how should we use it in ranging markets?
Fibonacci trading - entry and exit in range markets.
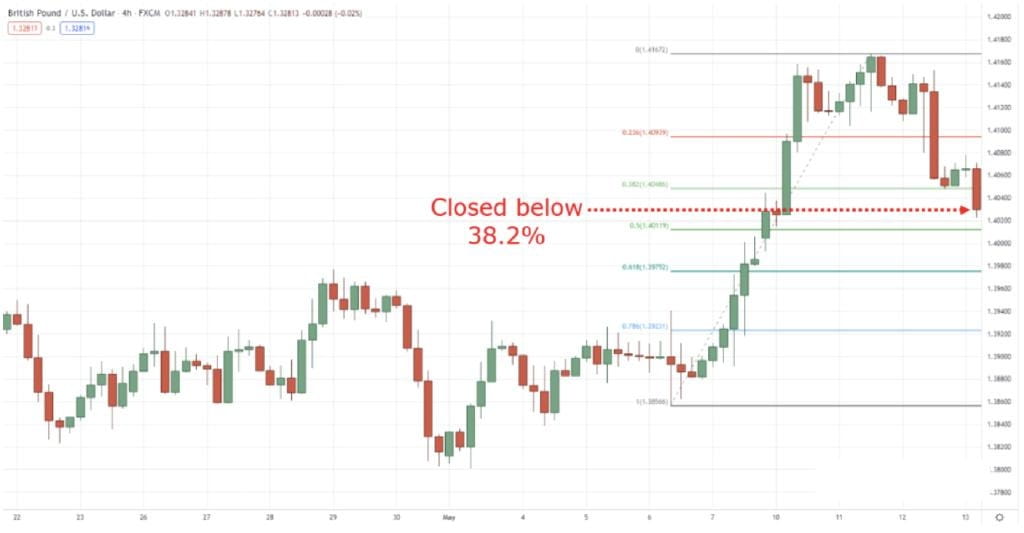
As I mentioned before, we all hope the price closes below the support area.
Range market in the GBPCHF daily chart:
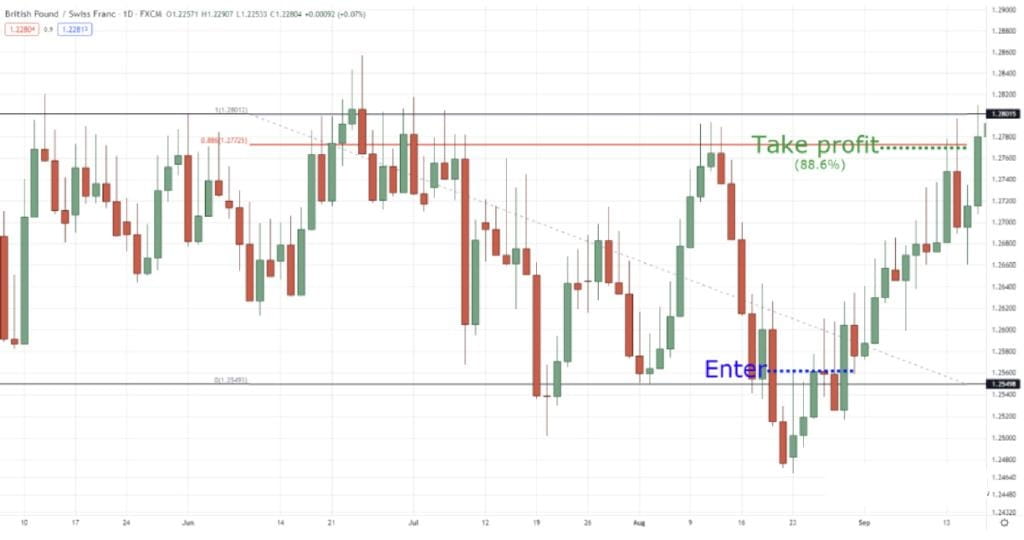 Then enter the trade when the price closes above the support area.
In this case, you can see that we are using price action to assist the Fibonacci trading tools.
It's powerful, isn't it?
Finally, you might consider taking profits at the Fibonacci retracement level of 88.6%.
Let me ask again, what is the principle behind it?
Why should we take profits at 88.6%? Why not at the resistance area itself?
Because trading in a ranging market can be difficult, as prices can contract, expand, and produce false breakouts.
Of course, we use false breakouts for our trades! But take profits before potential shorts (or potential contractions) arise.
Does this make sense?
Fibonacci trading - expand your trades.
Expanding or scaling down your trading size is a somewhat complex topic.
However... these trade management techniques in your arsenal can significantly improve your trading psychology, reduce risks, and potentially increase trading returns.
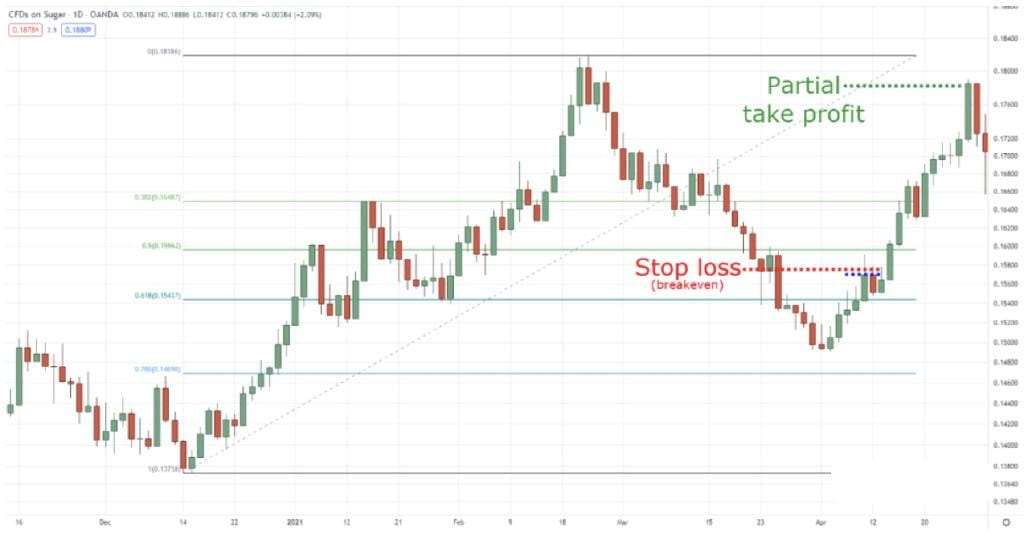
That said, let's return to the previous example, where you enter at a 61.8% reversal pullback, risking 1% on each trade.
If you are a conservative trader, but at the same time, you are willing to be patient for a longer time to profit.
Once the price reaches the previous high, you can take partial profits and move your stop loss to break even.
Move the stop loss to break even in the Sugar daily chart:
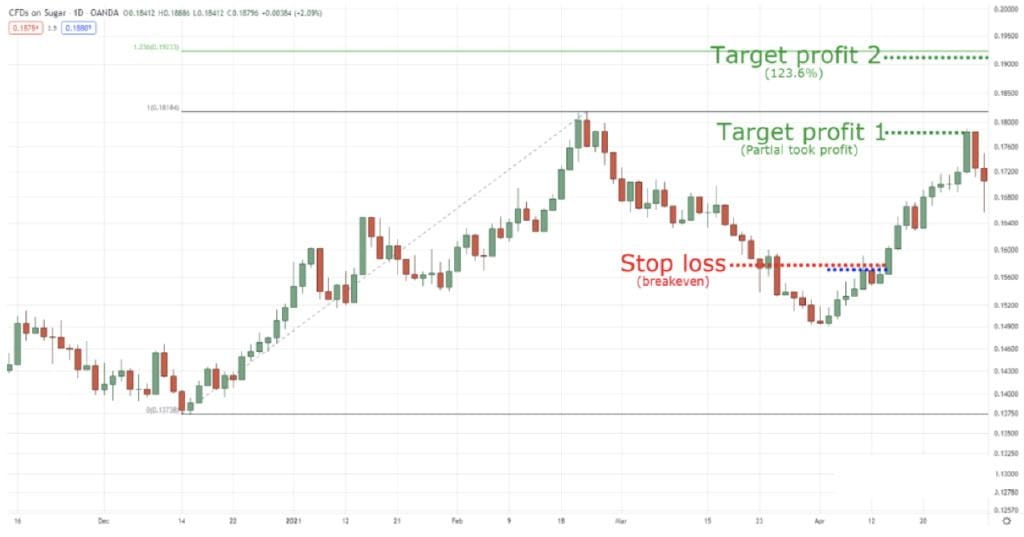
 So, how will you handle the remaining positions?
It's simple; we use the Fibonacci extension tool and consider taking profits at the 123.6% level.
Profit level at 123.6% on the Sugar daily chart:
 Finally, let's talk about scaling in trades.
Fibonacci trading - scale down your trades.
First, let's look at the trading setup you should already be familiar with.
38.2% retracement setup in the USDCNH daily chart:
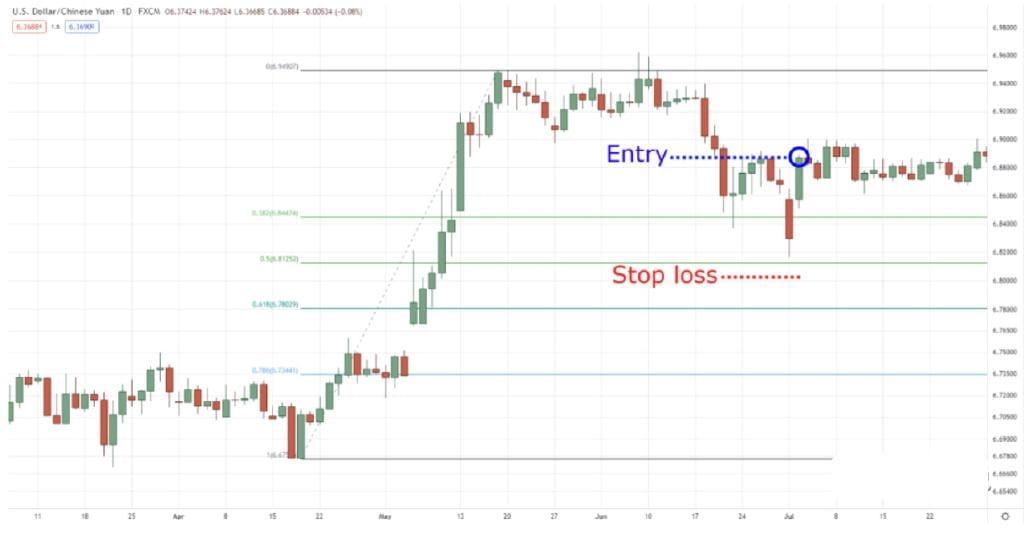 What’s different now? The trading setup remains the same, but not every trade risks 1%...
If your stop loss is hit, each trade will face a risk of 0.5%.
That's right.
You trade with a smaller position!
Now, you might ask, why do this?
Imagine you are dating someone...
If you give your 100% early in the dating phase, and that person doesn't end up being 'the one', how would you feel?
But if you put in a little effort to 'test the waters' and see if the person is interested...
If it doesn't work out, it wouldn't feel so painful because you didn't invest too much.
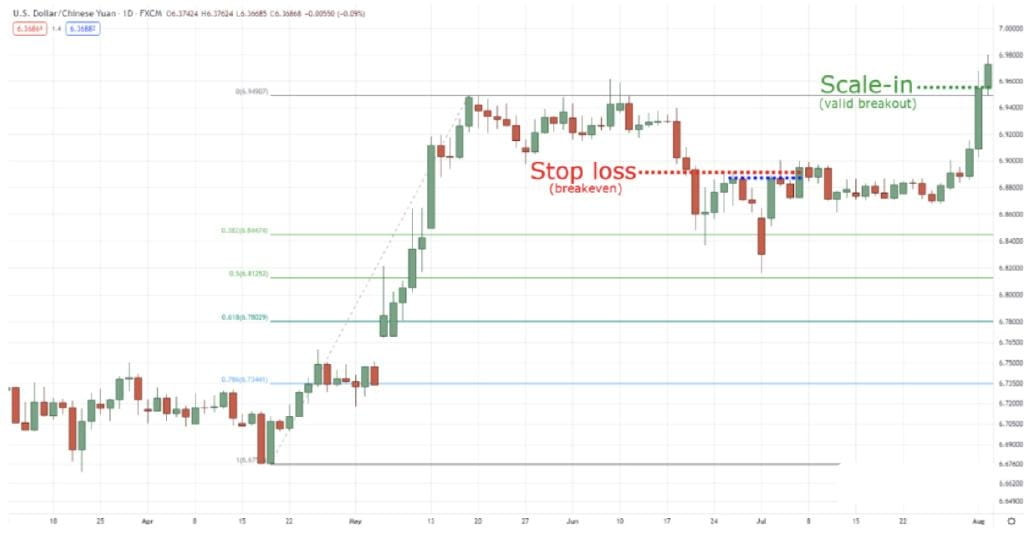
This technique is the same!
You want to first 'test' the market with a small risk... then eventually scale up your position by risking 0.5% after closing and achieving an effective breakout!
Scale down proportionally in the USDCNH daily chart:
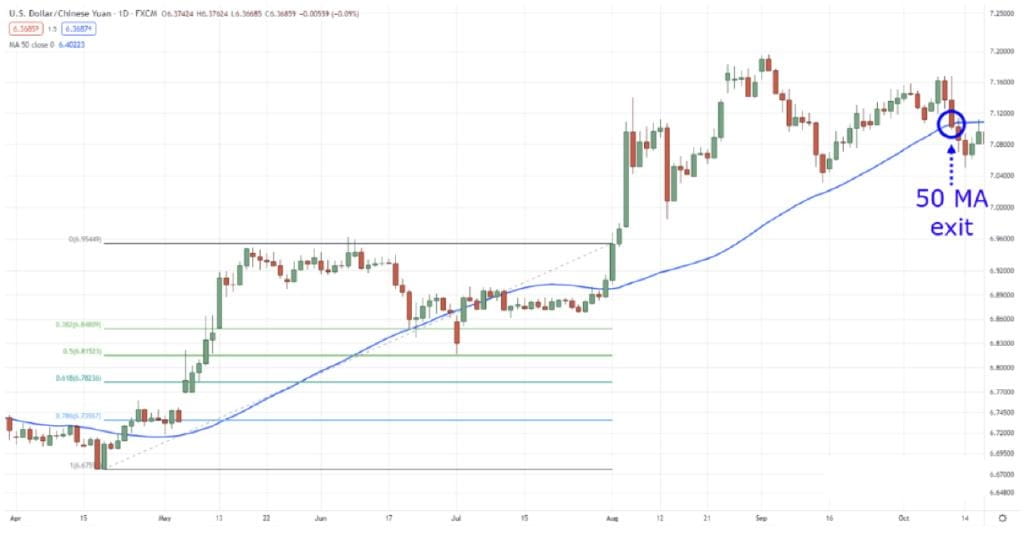
 Instead of using Fibonacci extension for fixed profits, I suggest you use a trailing stop loss, such as a 50-period moving average.
50-period moving average trailing stop loss on the USDCNH daily chart:
 Since you've resolved matters between you and the market, fixed target profits are meaningless.
I am Fan Fan, focusing on the cryptocurrency world for many years, sharing useful and diverse professional knowledge. For those destined to meet, if money doesn't cross your path, who will? Follow Fan Fan, and let me guide you through the mysterious crypto market. I hope our encounter is filled with friendliness and rewards!$ETH $BTC #加密市场回调 #MichaelSaylor暗示增持BTC
