Twelve years ago, I entered the cryptocurrency world with all my savings—over 10,000 yuan—naively following my classmates. Back then, like many of my friends now, I attended classes during the day and stayed up late at night watching K-lines, chasing whatever was popular, following whichever group called out trades. I panicked when it dropped, panicked even more when it rose, cutting losses back and forth, and my account was like a leaking bucket, showing no progress for over a year.
In the cryptocurrency world, I once experienced a situation where I believed a so-called 'big shot's' insider information and invested all my funds into a worthless coin, losing 40% in two days. That night, I couldn't sleep at all, not because I was heartbroken over the money, but because I suddenly realized: if I continued to operate blindly like a headless chicken, even if I got lucky and made a little profit, I would eventually lose it all.
That’s when I stopped trading every day and started studying. I began to reflect on what those who really made a lot of money did right.
Later, I finally understood that making money does not rely on frequent operations or perfect technology, but on "rhythm + patience." Find a trend and then hold on to it.
I started building my own system and wanted to share a method that I found to be effective. It can be summarized in three simple steps:
Step 1: Find the coins in the early stage of the main uptrend
I no longer buy coins in a scattershot fashion. I only choose the leaders in strong sectors, such as SOL in the last round and the recent AI sector representatives. They generally have several common characteristics: breaking through previous highs, sustained high volume, and a market capitalization between $100 million and $1 billion. These coins have less pressure to pull back and are more likely to rise.Step 2: Trial warehouse → Confirm → Add warehouse
I no longer go all in right away. When I see a coin I'm interested in, I start with a small position to test the waters. If the trend meets my expectations and breaks through key levels, I'll add to my position in batches. If the trend goes south, even if there's just a suspicion, I'll resolutely cut my losses. Remember: never add to a losing position.Step 3: Withdraw the principal with profit and let the profit run
This is the key to my path to consistent profitability. As soon as a position doubles, I immediately withdraw my principal. The rest, no matter how many times it multiplies, is my profit. My mindset is completely different—I can hold on, not afraid of drawdowns, and not be controlled by emotions.
That's how I ended up buying at the lowest point and selling at the highest point. I started focusing on the "body" of the fish—the part with the clearest trend. While I gave up some profits, I gained substantial account growth in return.
I know many people read articles like this hoping for a quick "win-win formula." But honestly, there's no holy grail in the cryptocurrency world. The only thing I can share, and the most truthful one, is this:
You don't have to be great to start, but you have to start to become great.
This road is destined to be lonely, but worth it.
If you're on this journey, don't lose heart. Slow is fast. With steady progress, you might find yourself transformed in the next cycle. Now, back to the present, I'll share some real work, so let's continue.
The right approach + stable execution + a good team leading the charge is far superior to just scrambling on your own! Anyone looking to turn things around will definitely find me.
The following proven cryptocurrency trading model has a winning rate of up to 98.8%. Once mastered, it can help you avoid most pitfalls and make your journey from 100,000 to 10 million more stable.

1. Split funds into five positions to strictly control risk. Divide your funds into five parts, and only use one-fifth of your position at a time. Set a 10-point stop-loss. Even if you make a single misjudgment, you'll only lose 2% of your total funds. Five consecutive misjudgments will only result in a 10% loss. If you make a correct judgment, set a take-profit of more than 10 points to fundamentally reduce the risk of being trapped.
2. Follow the trend to improve your winning rate. To further improve your winning rate, the key is to "follow the trend." In a downtrend, every rebound is often a trap to lure investors into buying; in an uptrend, every dip is often a golden opportunity to buy low. Compared to the extremely risky bottom-fishing, following the trend and buying low offers a much higher chance of profit.
3. Avoid coins experiencing short-term price surges. Whether mainstream or altcoins, few manage to achieve multiple major upward trends. After a short-term surge, it's extremely difficult for the price to continue rising. When prices stagnate at high levels, subsequent price increases are inevitable and will inevitably fall. This simple truth is often overlooked, yet some people enter the market with a "gamble" mentality, ultimately becoming trapped. 4. Use MACD to identify entry and exit signals. Using MACD to aid decision-making: When the DIF line and the DEA line form a golden cross below the 0 axis and then break through it, it's a strong entry signal. When the MACD line forms a death cross above the 0 axis and moves downward, it's important to reduce positions decisively to avoid profit-taking.
5. Avoid adding to a position when you're losing money, only add to a position when you're making a profit. "Adding to a position" has pitted countless retail investors—the more they lose, the more they add, and the more they add, the more they lose, ultimately driving them into a desperate situation. Remember this iron rule: never add to a position when you're losing money, only add to a position when you're making a profit. Let profits roll in, not let losses escalate.
6. Volume and price are key factors, closely following capital flows. Trading volume is a barometer of capital in the cryptocurrency market, more reliable than simply observing K-line charts. Pay close attention to price breaksouts from low levels during consolidation. High volume and stagnation at high levels indicate a lack of capital, prompting a decisive exit.
7. Only trade in uptrends and don't waste time. Prioritize upward-trending currencies for higher odds and greater efficiency. A 3-day moving average turning upward signals a short-term uptrend; a 30-day moving average turning upward signals a mid-term uptrend; a 84-day moving average turning upward signals a high probability of a major uptrend; and a 120-day moving average turning upward signals a long-term uptrend.
8. Review your trading strategies regularly and adjust them promptly. After each day's trading, review your trading strategies to see if your holding logic has changed. Use weekly K-line charts to verify that the trend is in line with your predictions and determine if the trend has shifted. Adjust your trading strategies based on these review results to continuously optimize your operations and avoid repeating mistakes. Let me share a strategy I've used for years, which has an average win rate of 80%, a rare achievement in the cryptocurrency trading world.
A trading strategy with a 95% winning rate in the cryptocurrency market (trend line drawing)—once mastered, you can earn a stable 7-figure monthly income and an 8-figure annual income! This chapter is incredibly important and detailed, so it might be a little overwhelming the first time you learn it. I encourage you to read it over and over again.
I am Lao Wang, a traveler who has experienced several rounds of bull and bear markets in the cryptocurrency market. From a bankrupt leeks to a trading tool developer, if you are still fighting alone, you might as well
Let's stay together for warmth. Follow Crypto Lao Wang on his homepage. I want to lay out the rules of survival in the cryptocurrency world, help you decipher the fog of the cryptocurrency world from a technical perspective, and together we can appreciate the vast ocean of stars that belongs to us. Are you ready?
Let's first explain how to draw a line, mainly based on the following three steps:
Confirm the trend, determine the highs and lows, and draw the lines correctly
Let’s look at the first one first, confirming the trend. We have said before that not all structures can use the Fibonacci tool. At least we don’t use it in a volatile market. We only use this tool in a trending market.
So how do you identify a trend? Of course, you can use the previous trend line lesson to help you identify a trend. If you can draw a line through two points and verify it at the third point, then this trend line is a valid trend line.
At this time, you can also use the trend line to help confirm the trend, which is also a method. Of course, you can use other tools to determine the trend, such as the moving average. There is really no unified standard for this. So today we will use another method to confirm the trend, which is more concise, that is, using EMA200.
EMA (Exponential Moving Average), also known as MA, is simply the sum of the daily closing prices and divided by the number of days.
EMA is different. It has weight. The meaning of weight is that yesterday's price has a more important impact on today, and the price of the day before yesterday also has an impact on today, but the impact is not as powerful as yesterday's price. Then the impact of the price of the day before yesterday on today is smaller than that of yesterday and the day before yesterday.
EMA is smoother than MA, and I personally prefer EMA. Of course, we will introduce the detailed usage and differences between MA and EMA in the moving average section. We use EMA200 to judge the market trend. Let's look at the following Figure 2.4-17.
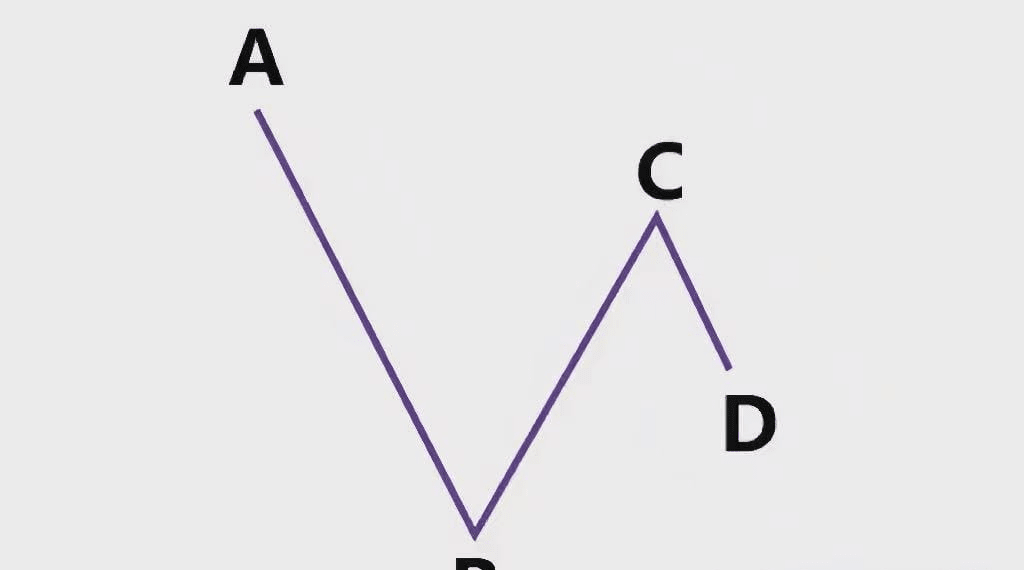
Figure 2.4-17
We can see that the price dropped from high point A to low point B, and then rose to high point C. However, C did not break through the previous high point A. At this time, the price reached position D. How should we draw it? Should we draw it based on the high and low points AB or BC?
At this time, it is very simple. We add the EMA indicator and change the parameter to 200. As shown in Figure 2.4-18, it represents the setting of EMA200.
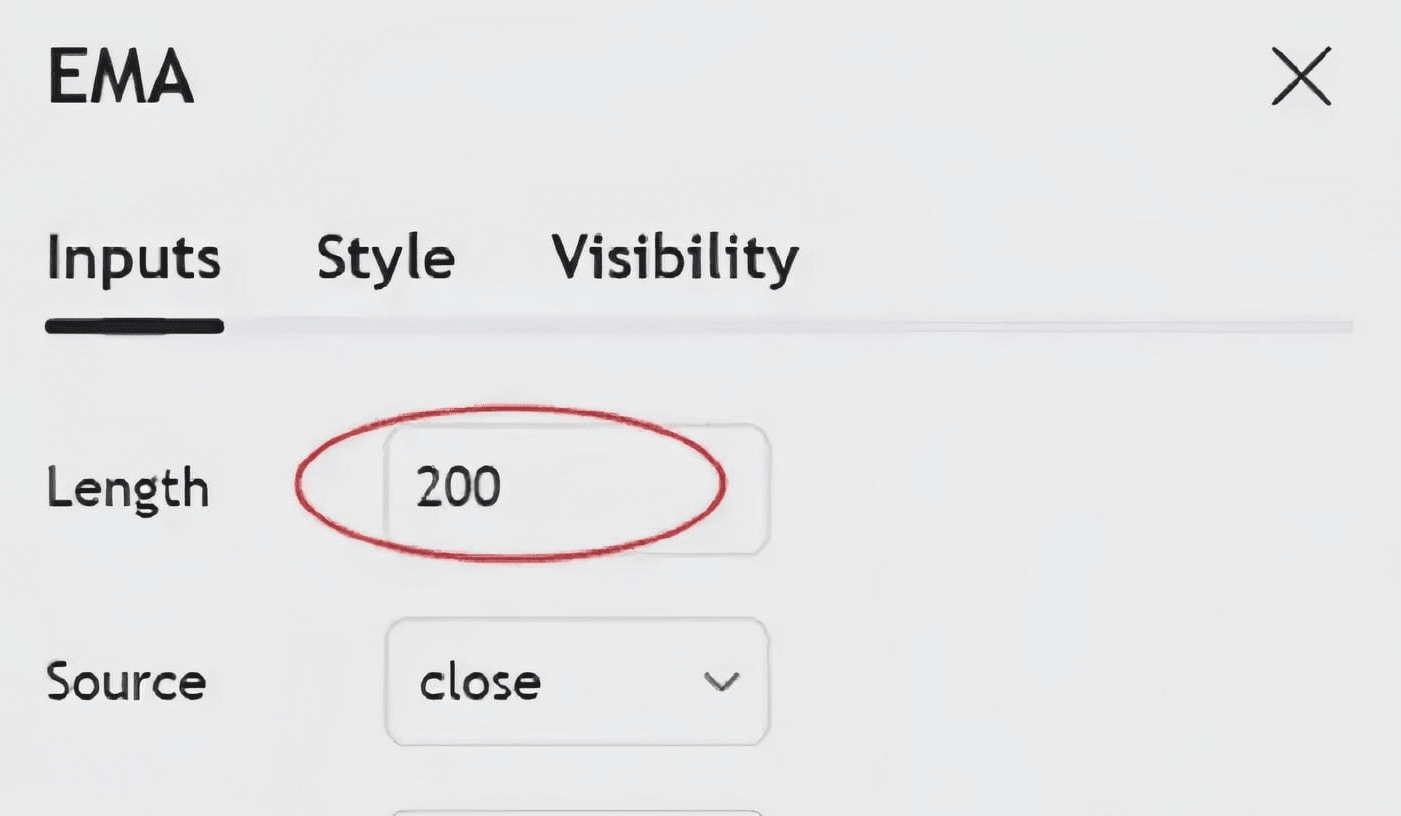
Figure 2.4-18
If the price is around EMA200, as shown in Figure 2.4-19,
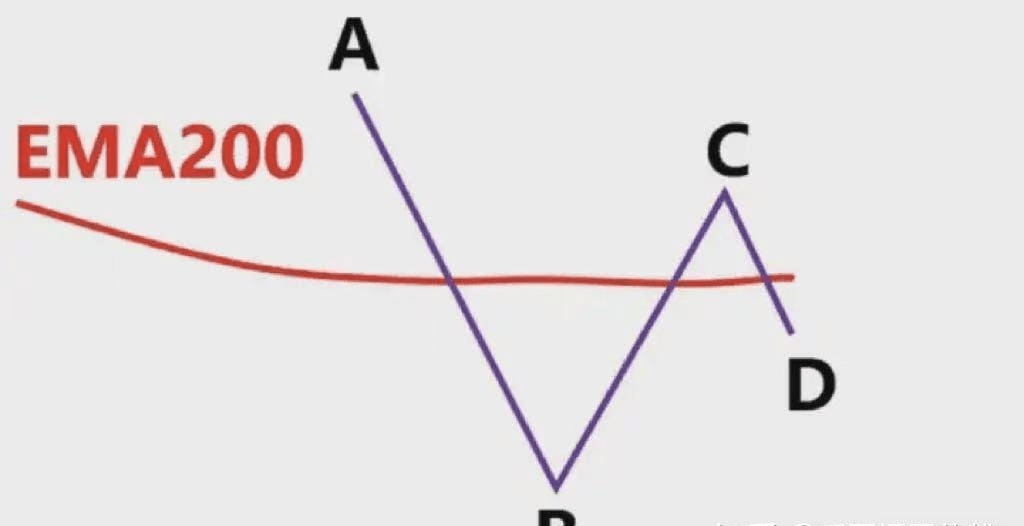
Figure 2.4-19
Then we believe that the current market is a volatile or disorderly market, and we will not participate in this type of market.
If the price is above EMA200, then we believe that the current market trend is mainly upward, as shown in Figure 2.4-20.
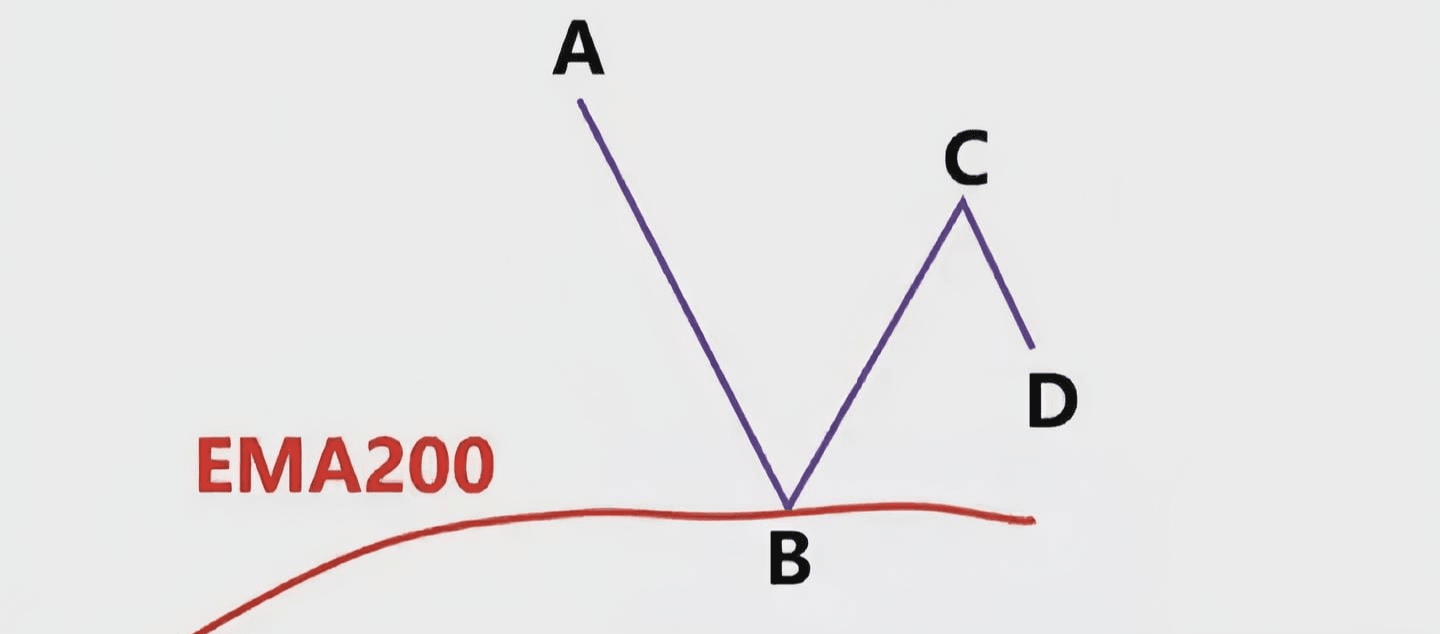
Figure 2.4-20 At this time, we should draw the Fibonacci retracement line based on the high and low points to observe the reaction of the price to the 0.382-0.618 area, so as to make corresponding strategies.
If the price is below EMA200, then we believe that the current market trend is mainly downward, as shown in Figure 2.4-21.
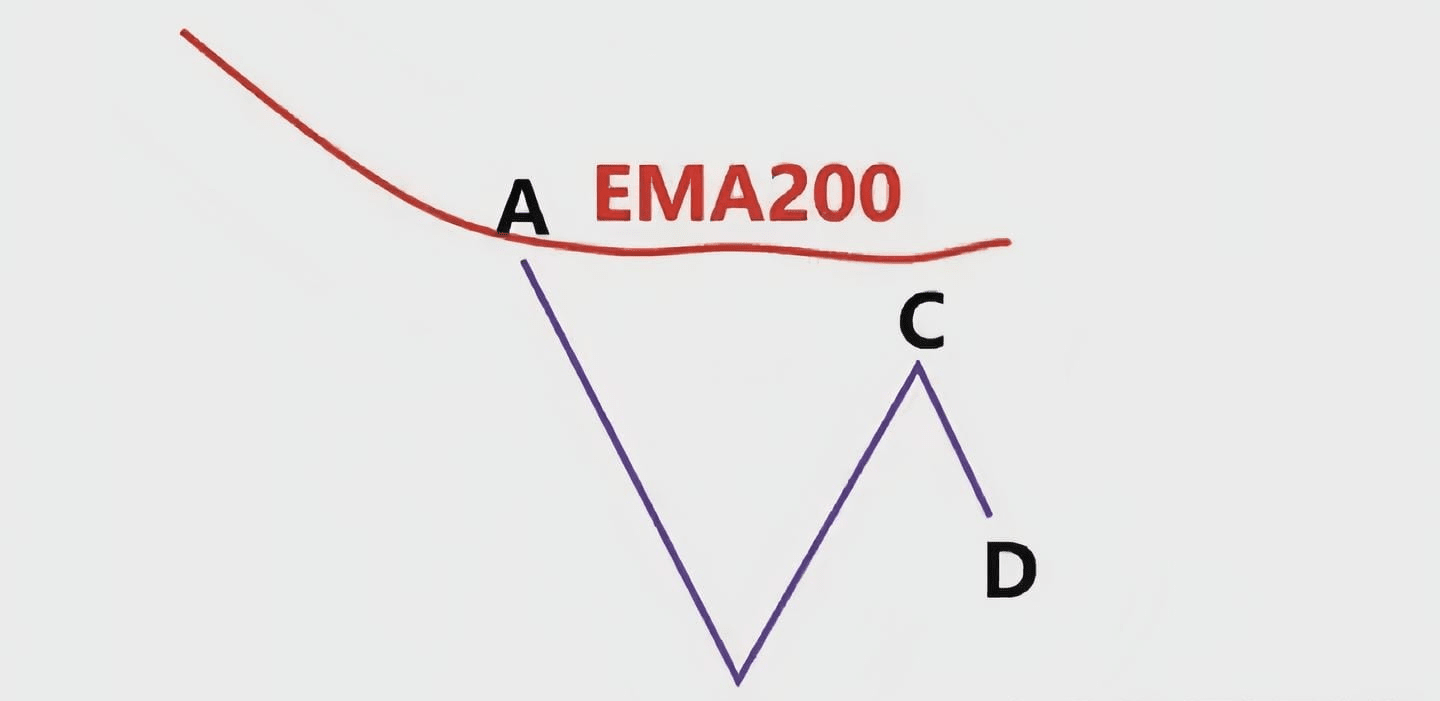
Figure 2.4-21 At this point, we should draw Fibonacci retracement lines based on the highs and lows to observe the price's reaction to rebounding to the 0.382-0.618 area, so as to formulate a corresponding strategy. After confirming the trend, we move on to the second step, confirming the highs and lows, that is, how to find the highs and lows.
Because drawing Fibonacci areas is relatively subjective, if you define the high and low points differently, then your Fibonacci areas will definitely be different, which will inevitably lead to different support and resistance areas, which may cause misjudgment. So how should you find the high and low points?
Let's assume that the market is rising, as shown in Figure 2.4-22. What should we do?
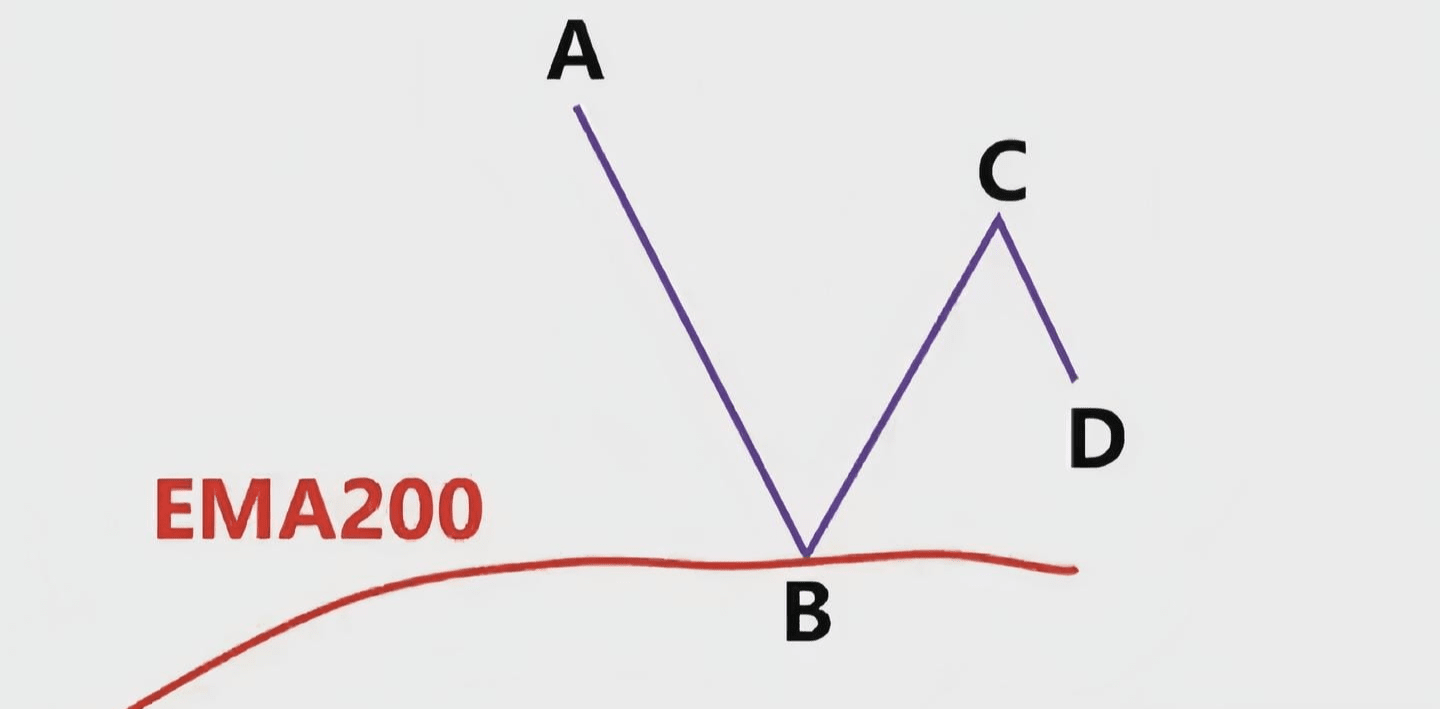
Figure 2.4-22
First, we can't directly connect the high and low points of the BC wave and then draw the Fibonacci. The price has fallen from the high point C to point D. At point D, it could be either a decline or an increase. Let's assume a decline. Then, we need to draw the Fibonacci based on the previous high point A and the previous low point, and then see if point B falls within the 0.382-0.618 Fibonacci retracement range.
If area B is in the callback area of 0.382-0.618, as shown in Figure 2.4-23,
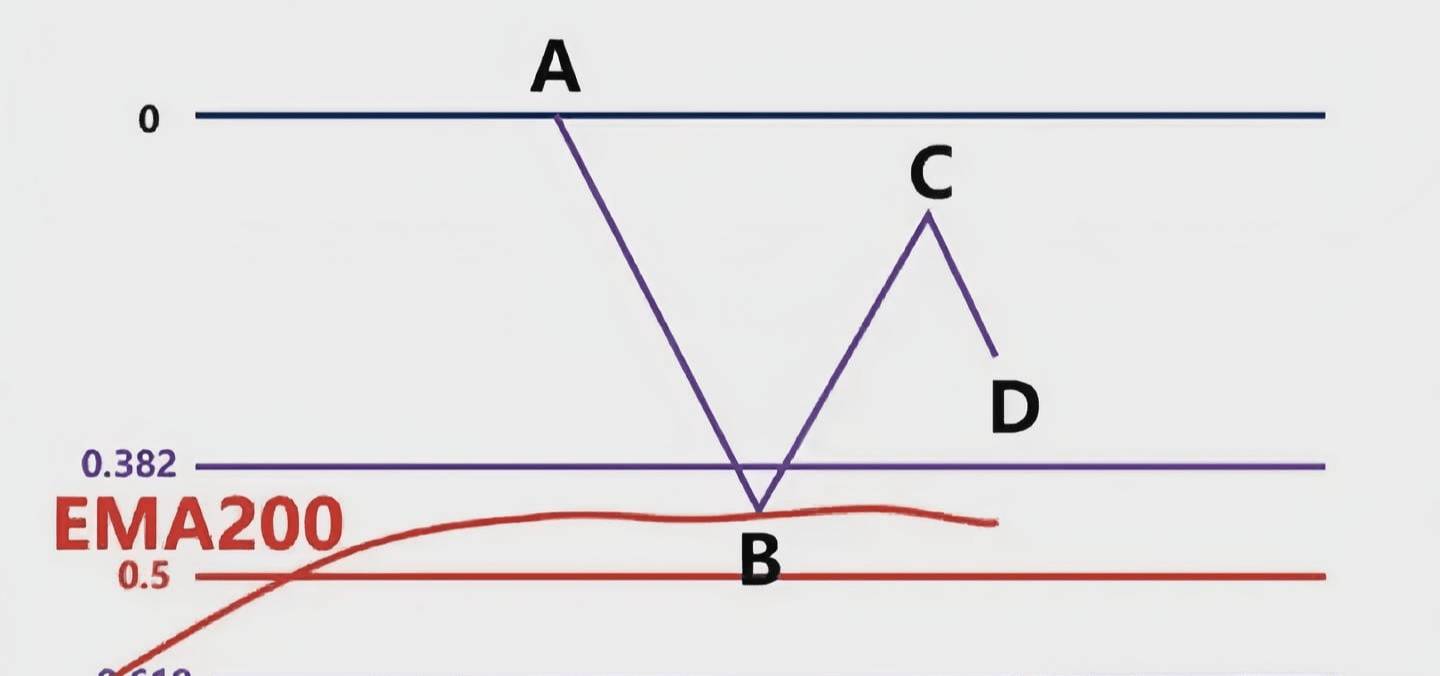
Figure 2.4-23
At this point, a secondary test of the swing low, point B, may occur—that is, a retest of the previous low, B, forming a double bottom pattern, followed by a direct upward move. Remember, double tops and bottoms are more powerful when they follow the trend. In other words, we need to look for double bottoms in an uptrend and double tops in a downtrend. Therefore, we need to draw a horizontal support line from point B, as shown in Figure 2.4-24. When the price reaches this area, we can observe whether the price behavior will form a double bottom.
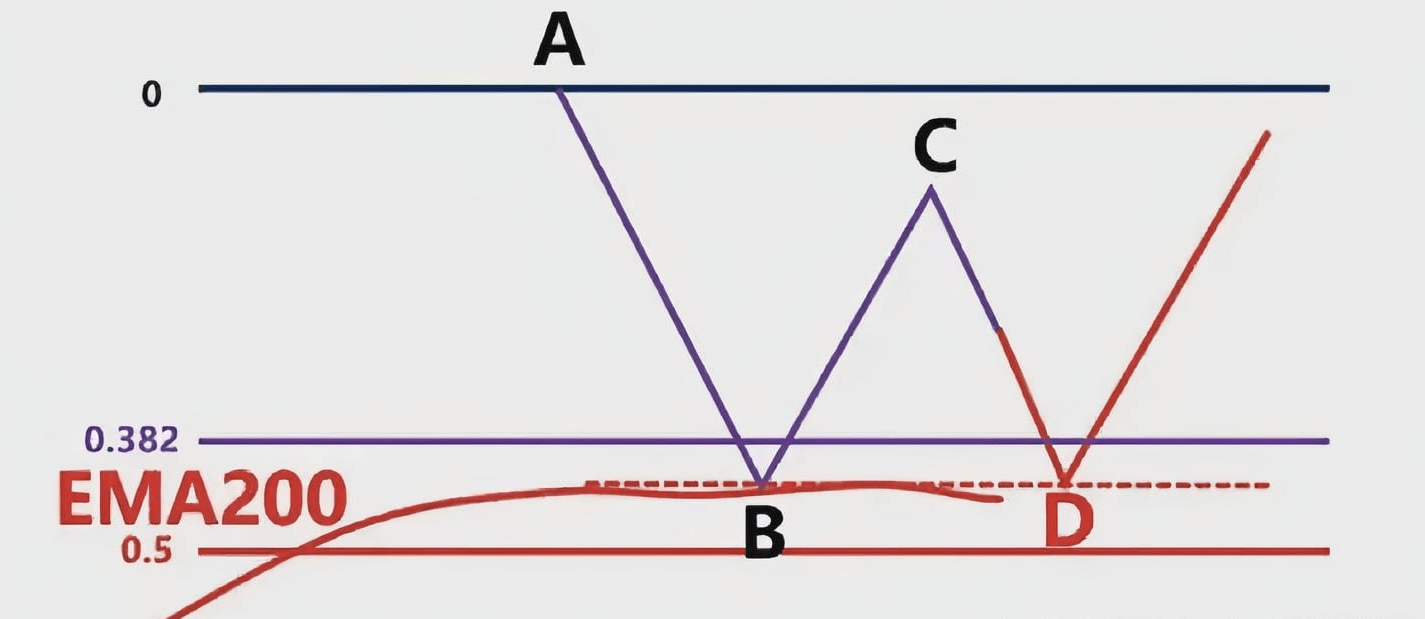
Figure 2.4-24
If area B is not in the callback area of 0.382-0.618, but above 0.382, that is, above the mild callback, as shown in Figure 2.4-25,
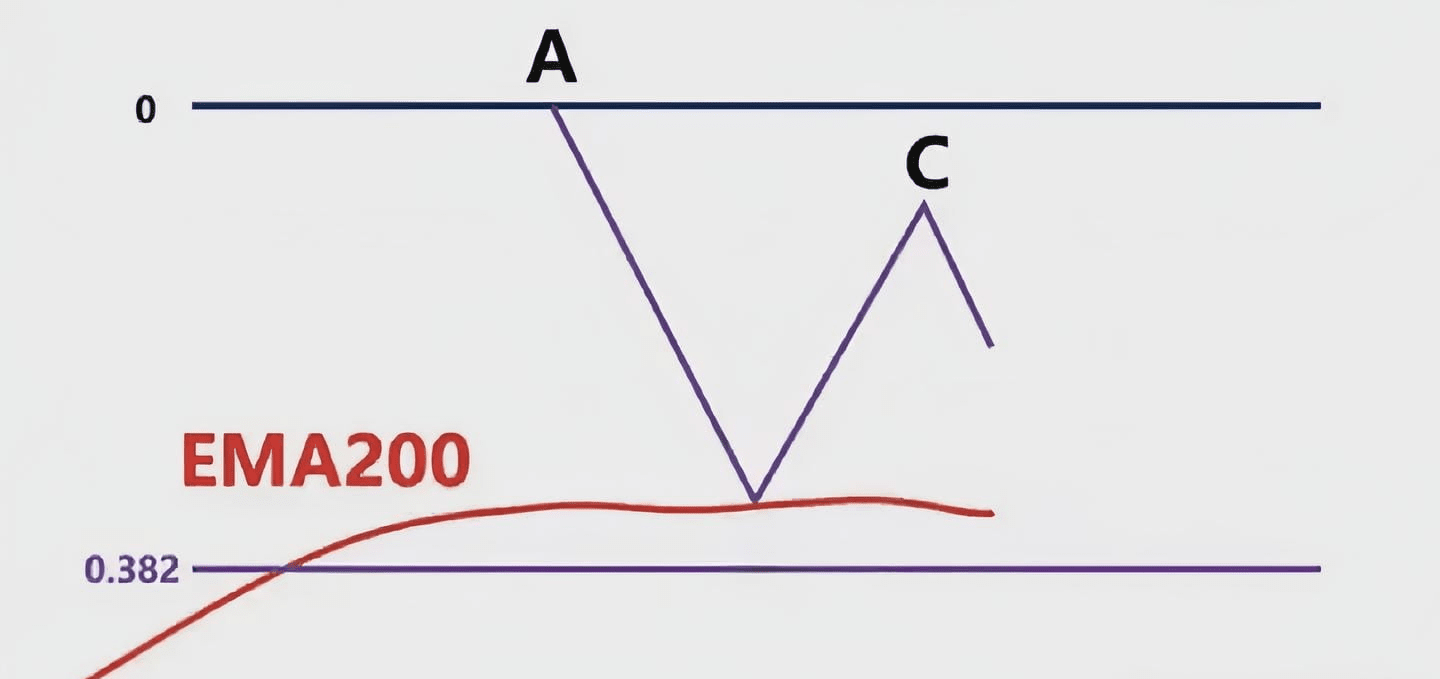
Figure 2.4-25
At this time, we also need to draw the horizontal support line at point B. The price may test the low point B for the second time, forming a double bottom pattern, and then rise directly. It is also possible that it will fall below the support area to point D, forming AB and CD with equal distances, and D will just pull back to the Fibonacci 0.382-0.618 area, and then continue to rise, as shown in Figure 2.4-26.
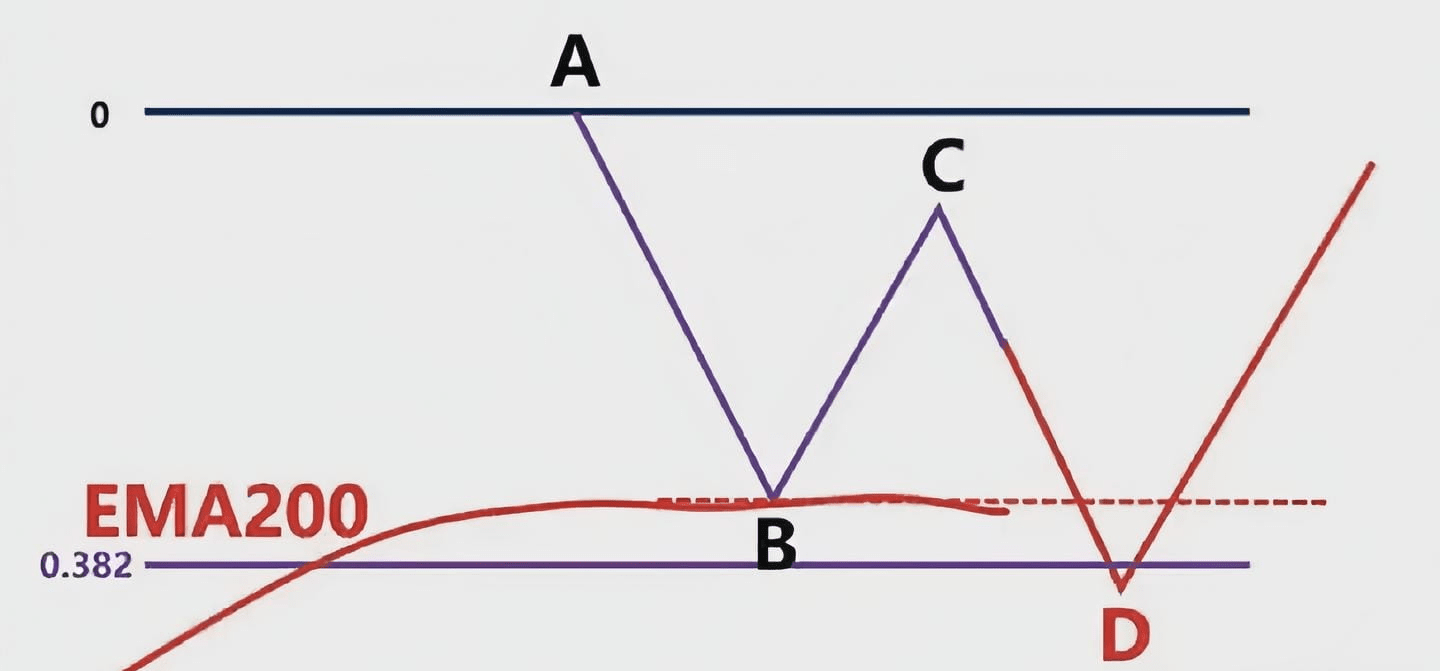
Figure 2.4-26
In other words, this pullback isn't a simple one, but rather a two-stage, equidistant pullback. This is because traders who shorted at point C will, based on the principle of equidistant lines AB and CD, immediately close their positions at point D. Short sellers will then be depleted, allowing bulls to continue their upward trend. Of course, a three-stage pullback is also possible, with prices continuing to rise. However, as long as the trend remains intact, we should follow the trend and trade with it. If area B isn't within the 0.382-0.618 range, but instead lies below 0.618, this indicates a deeper pullback, as shown in Figure 2.4-27.
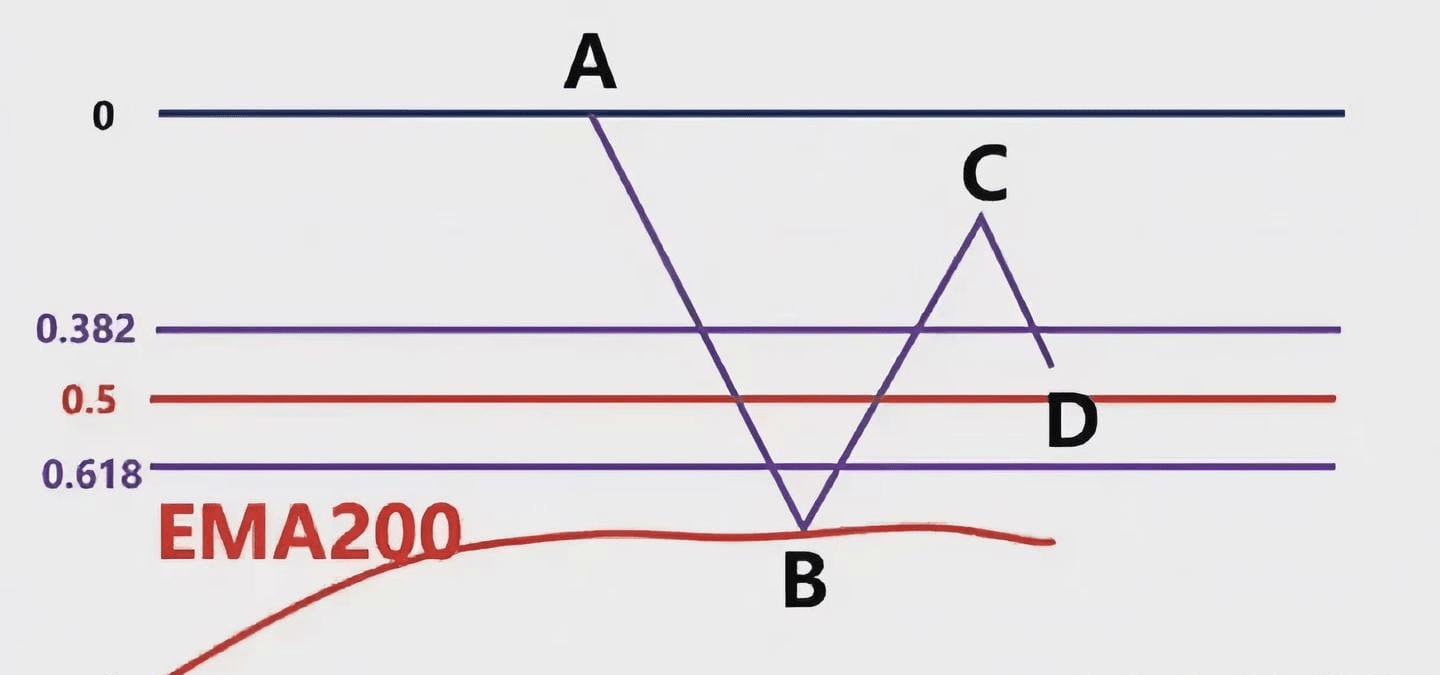
Figure 2.4-27
That indicates a deep pullback, which means that the upward momentum is insufficient and the buyer's power has become somewhat weak. At this time, the seller will also realize this situation, so the seller may intervene in the market. At this time, we also need to draw the horizontal support line at point B. We can pay attention to the reaction when C falls back to the horizontal support position, as shown in Figure 2.4-28.
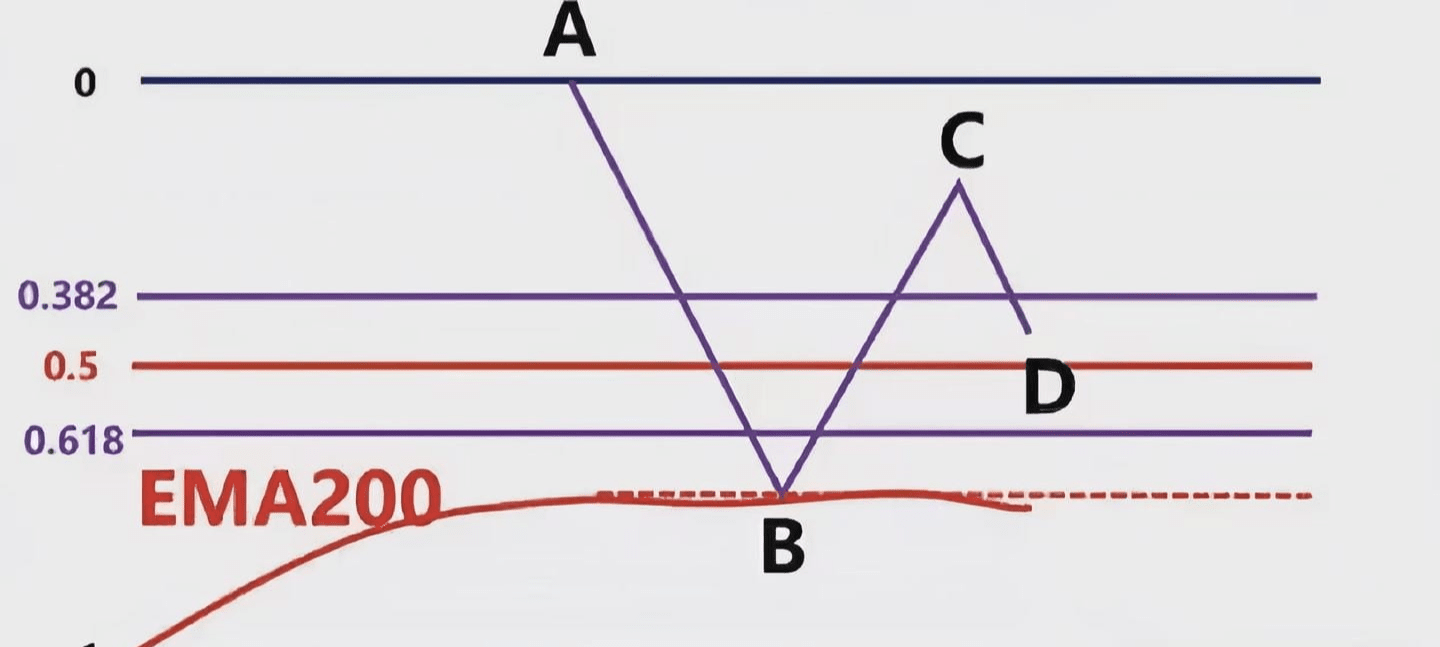
Figure 2.4-28
As we've mentioned many times before, we should follow the trend before a market reversal occurs, as it's always the easiest way to make money. If point B is broken, a range-bound consolidation pattern may emerge. At this point, we'll need to focus on the price performance of the horizontal support area drawn by the previous low point, B. This will be covered in detail in subsequent lessons; here, we'll focus on identifying swing highs and lows.
The above figures discuss the situation where the CD segment does not stop falling after reaching point D, and continues to fall. What if there is no decline at point D, but an increase, how should we draw the high and low points of the band? As shown in Figure 2.4-29,
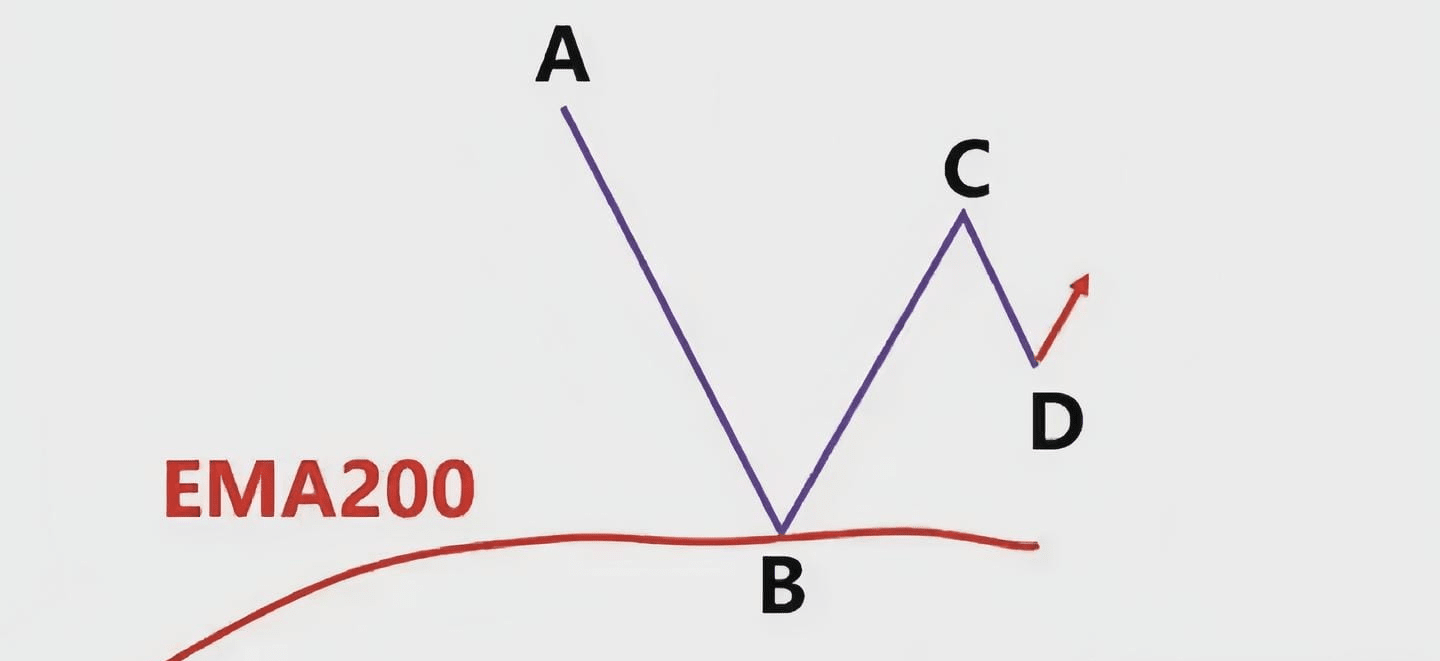
Figure 2.4-29
At this point, we should draw a horizontal resistance line at the previous swing high A and wait for the price to break through the previous swing high A. If the price breaks through the previous swing high A and then creates a new swing high E and then falls, we can draw a Fibonacci zone with the swing low B and the swing high E and observe the price action between 0.382 and 0.618, as shown in Figure 2.4-30.
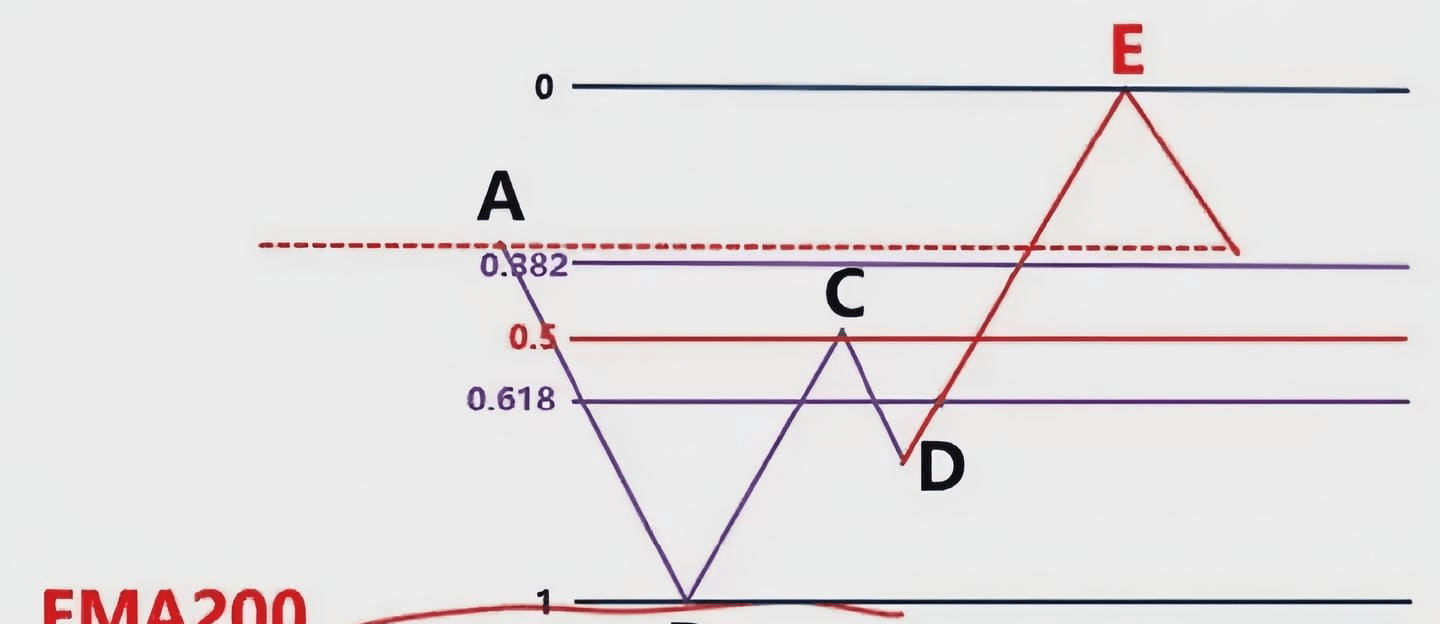
Figure 2.4-30
If the horizontal resistance line just drawn at point A is also within this area, a regional resonance will form, and this area should be closely monitored. Of course, when the price breaks through the previous high point A, it may encounter resistance and fall back, and then break through again, forming a dense range, as shown in Figure 2.4-31. At this time, it is a position where momentum is waiting for an explosion.
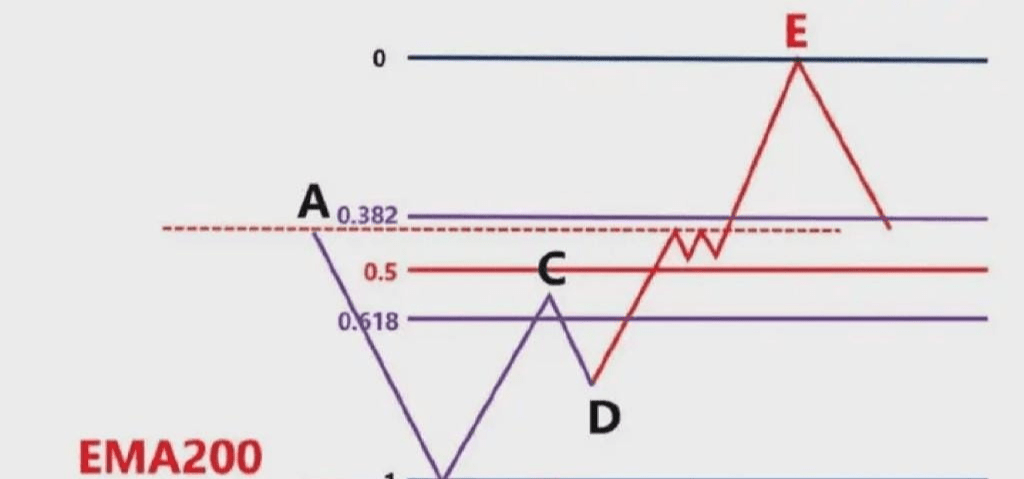
Figure 2.4-31
The most important thing is to see if it can eventually break through and form a new swing high. Once it breaks through, we can then identify the highs and lows and draw Fibonacci zones. So, the above is the entire process of identifying swing highs and lows in an uptrend. Now, let's assume the market is falling, as shown in Figure 2.4-32. What should we do?
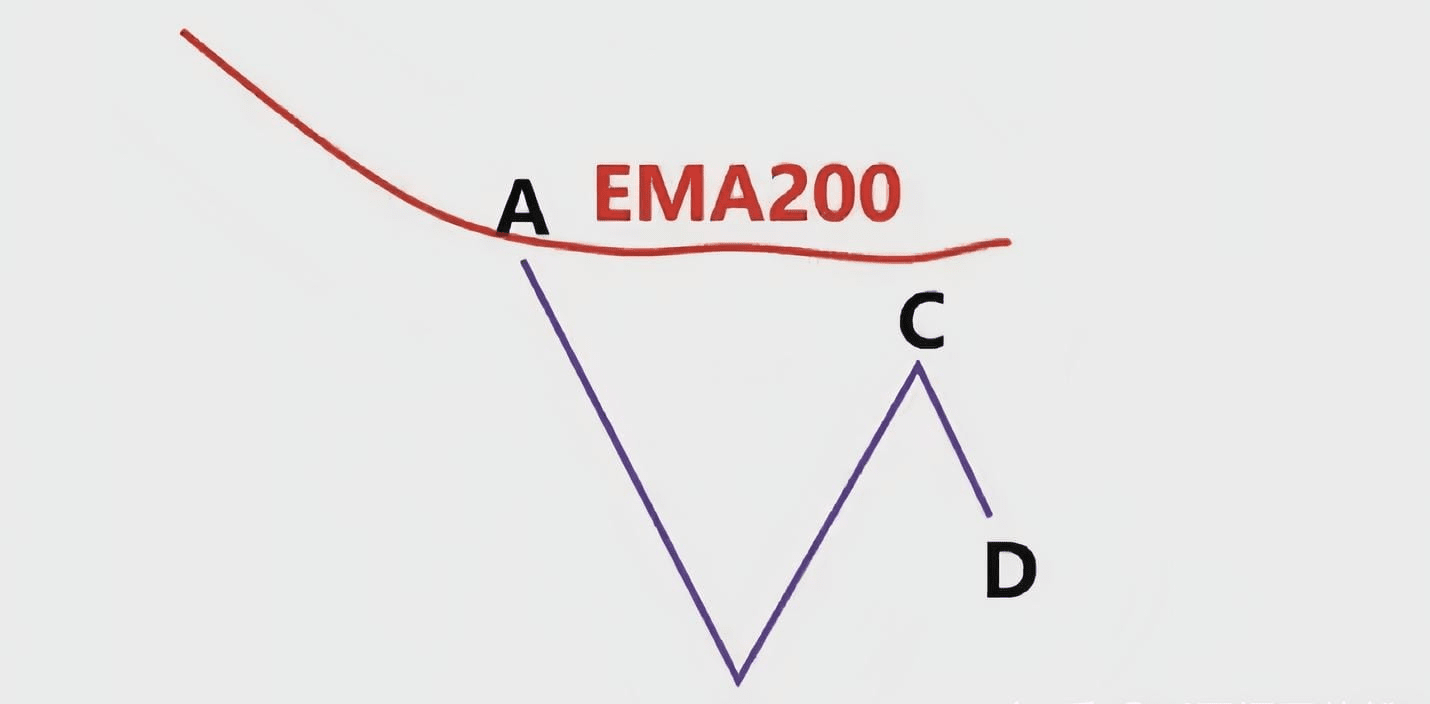
Figure 2.4-32
First, we cannot directly connect the high and low points of the band BC and then draw the Fibonacci. At this time, the price has fallen from the high point C to point D. At this point, it is possible to rise or fall. Let's first consider the assumption of rising. How should we draw the Fibonacci area? At this time, we need to draw the Fibonacci area based on the previous band high point A and the previous band low point B, and then observe whether the position of point C is in the 0.382-0.618 position area of this Fibonacci retracement. If the position of C is in the rebound area of 0.382-0.618, as shown in Figure 2.4-33,
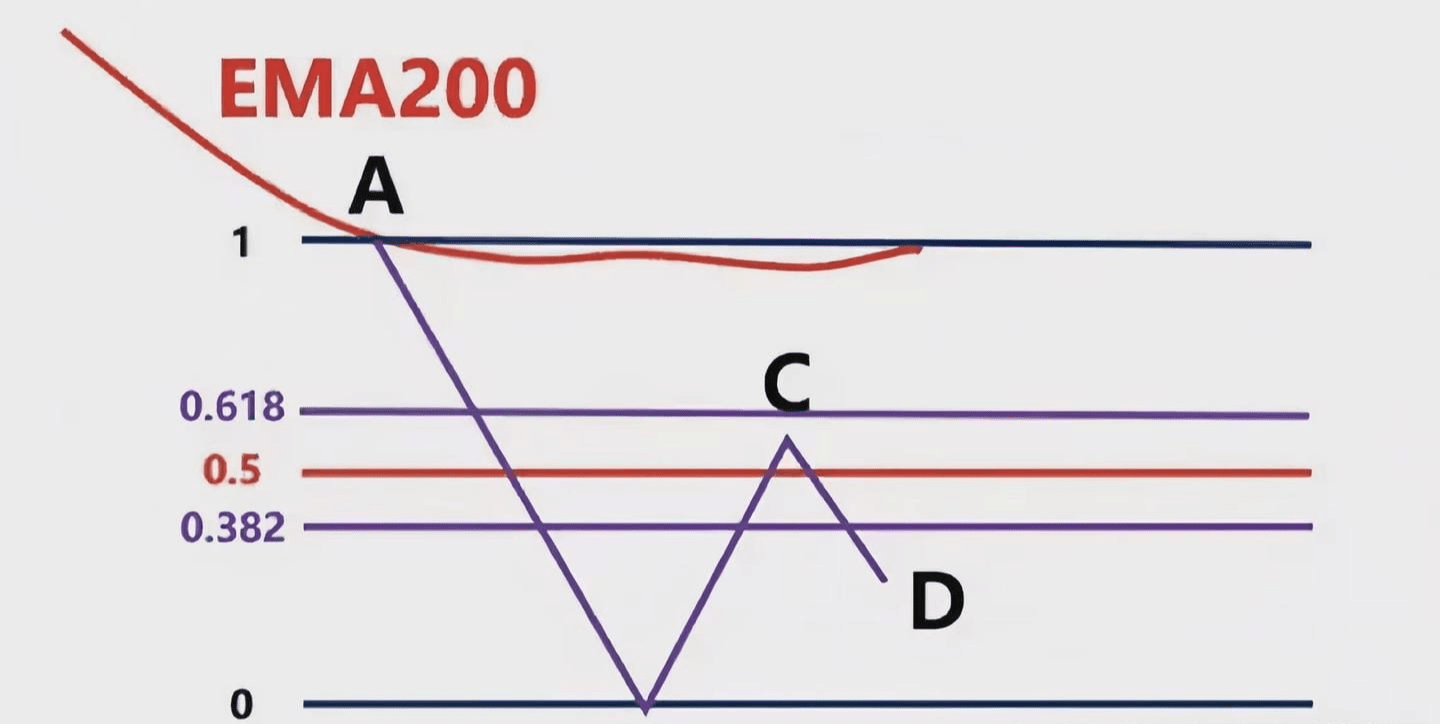
Figure 2.4-33
At this point, a secondary test of the swing high, C, may occur, meaning it will retest the previous high, forming a double top pattern, followed by a direct decline. This is what we said before: we need to look for double bottoms in an uptrend and double tops in a downtrend, and we must remember to trade with the trend. Therefore, we need to draw a horizontal resistance line from point C, and then wait for the price to reach this area, observing the price behavior to see if a double top pattern appears, and then decide how to enter the market, as shown in Figure 2.4-34.
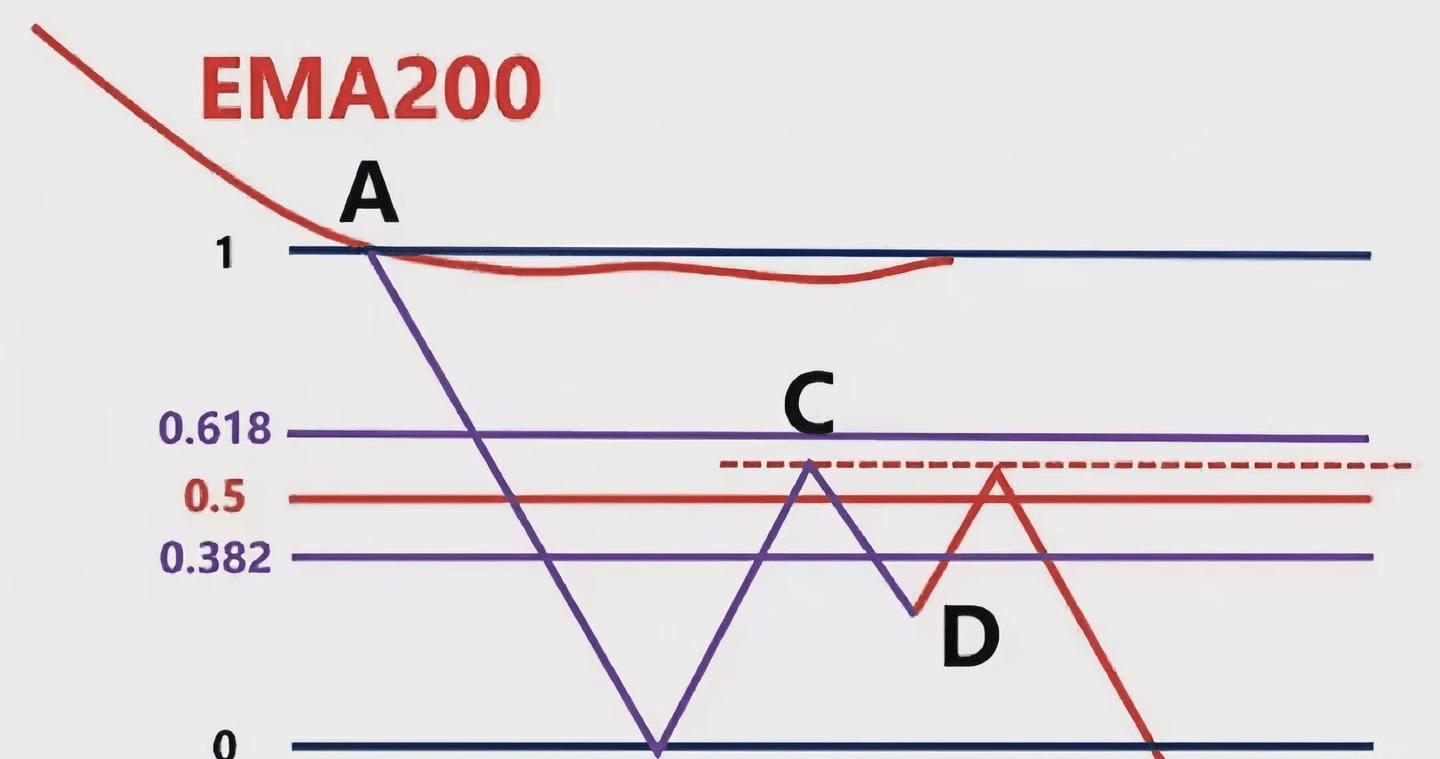
Figure 2.4-34
If area C is not in the 0.382-0.618 range, but above 0.382, that is, above the mild rebound area, as shown in Figure 2.4-35, what should we do at this time?
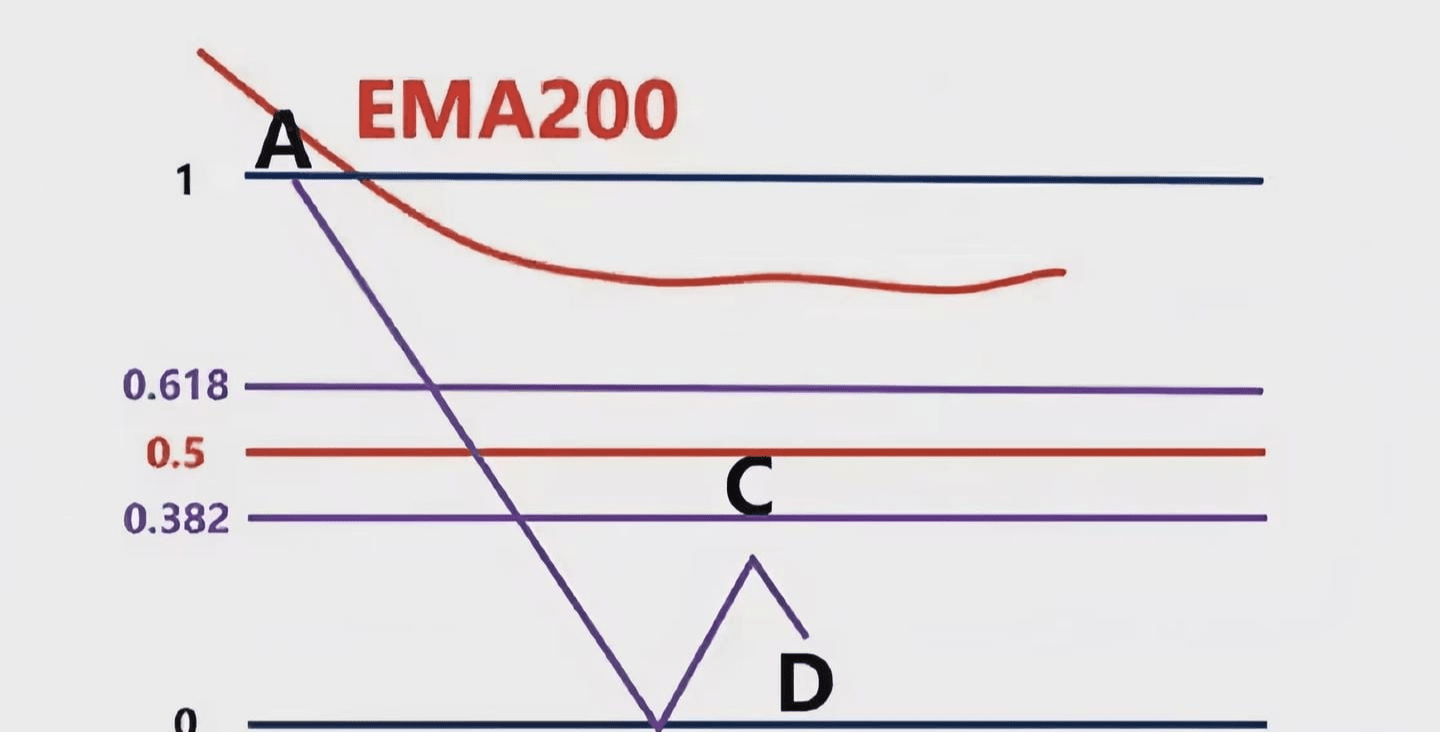
Figure 2.4-35
At this time, we also need to draw the horizontal resistance line at point C. The price may be the same as above, and conduct a second test at the high point C of the band, forming a double top pattern, and then directly fall, as shown in Figure 2.4-36.
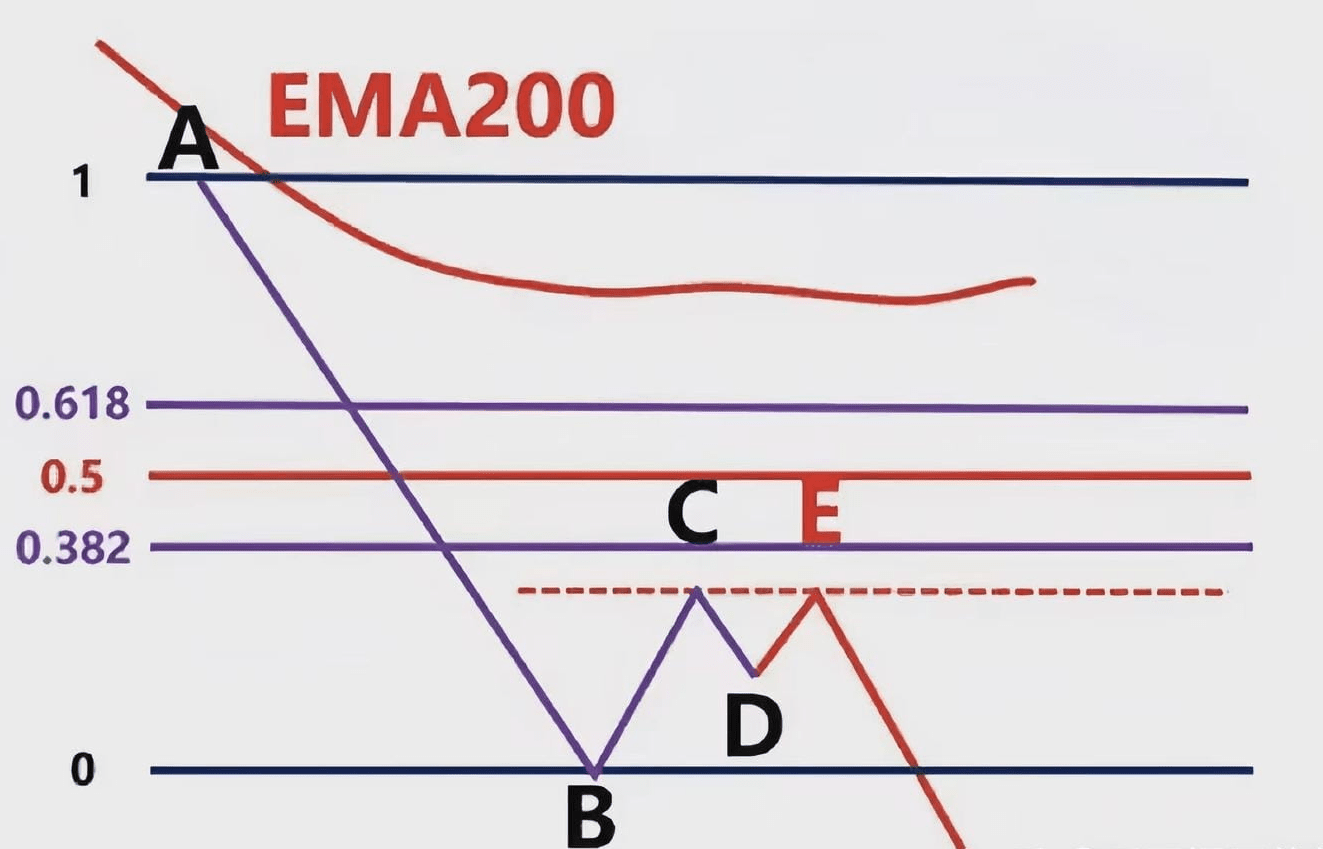
Figure 2.4-36
It is also possible to break through the resistance area to position E, forming equidistant BC and DE, and the rebound position of E just reaches the Fibonacci 0.382-0.618 area, and then continue to fall, as shown in Figure 2.4-37.
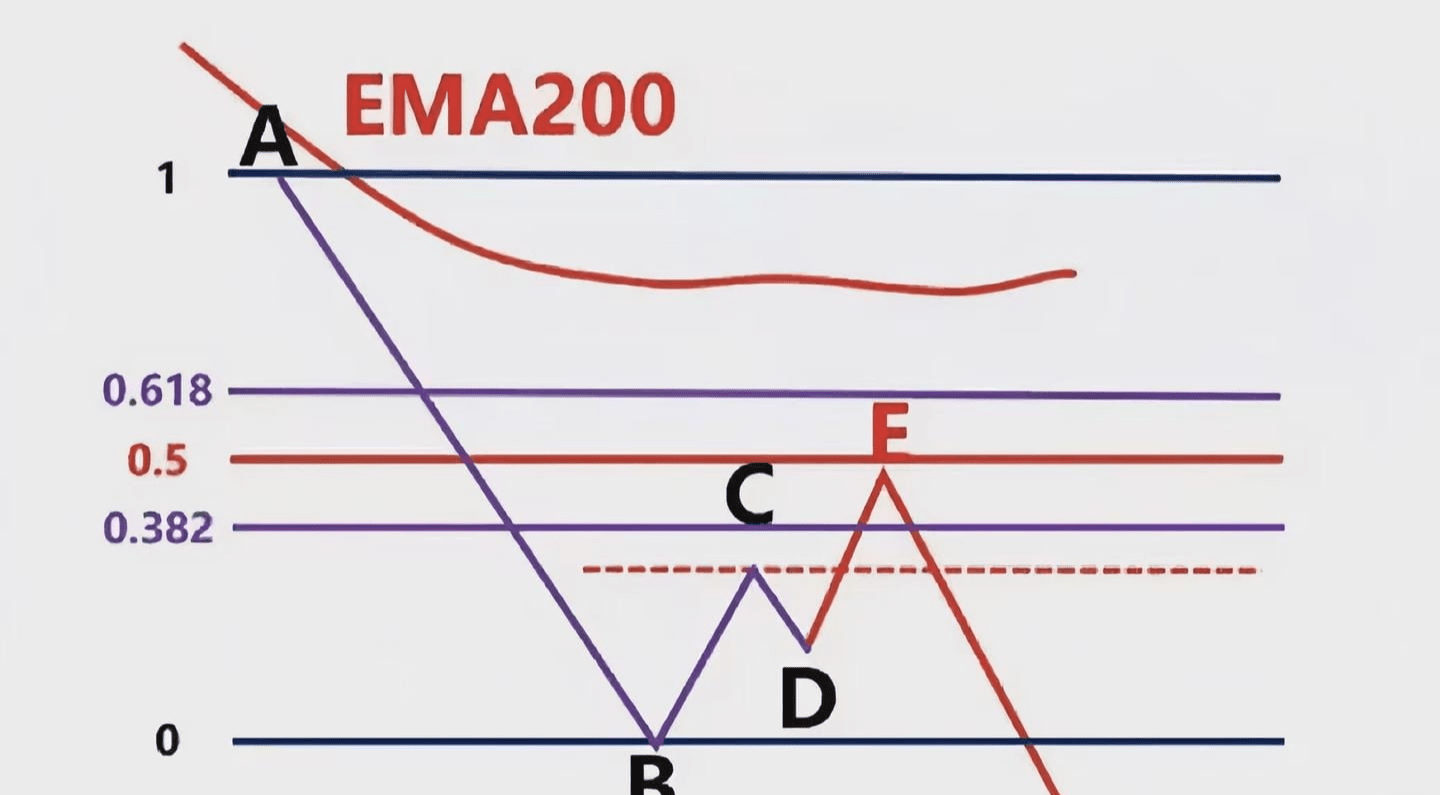
Figure 2.4-37
In other words, this rebound isn't a simple one, but rather a two-stage, equidistant rebound. This is because traders who short-term long positions at point D will, based on the principle of equidistant lines BC and DE, immediately close their positions at point E. This exhausts bullish momentum, allowing bearish forces to continue their decline. Of course, a three-stage rebound followed by further declines is also possible, but as long as the trend remains intact, we should follow the trend and trade with it.
If the position of C is not in the 0.382-0.618 area, but below 0.618, that is to say, it belongs to a deeper rebound, as shown in Figure 2.4-38,
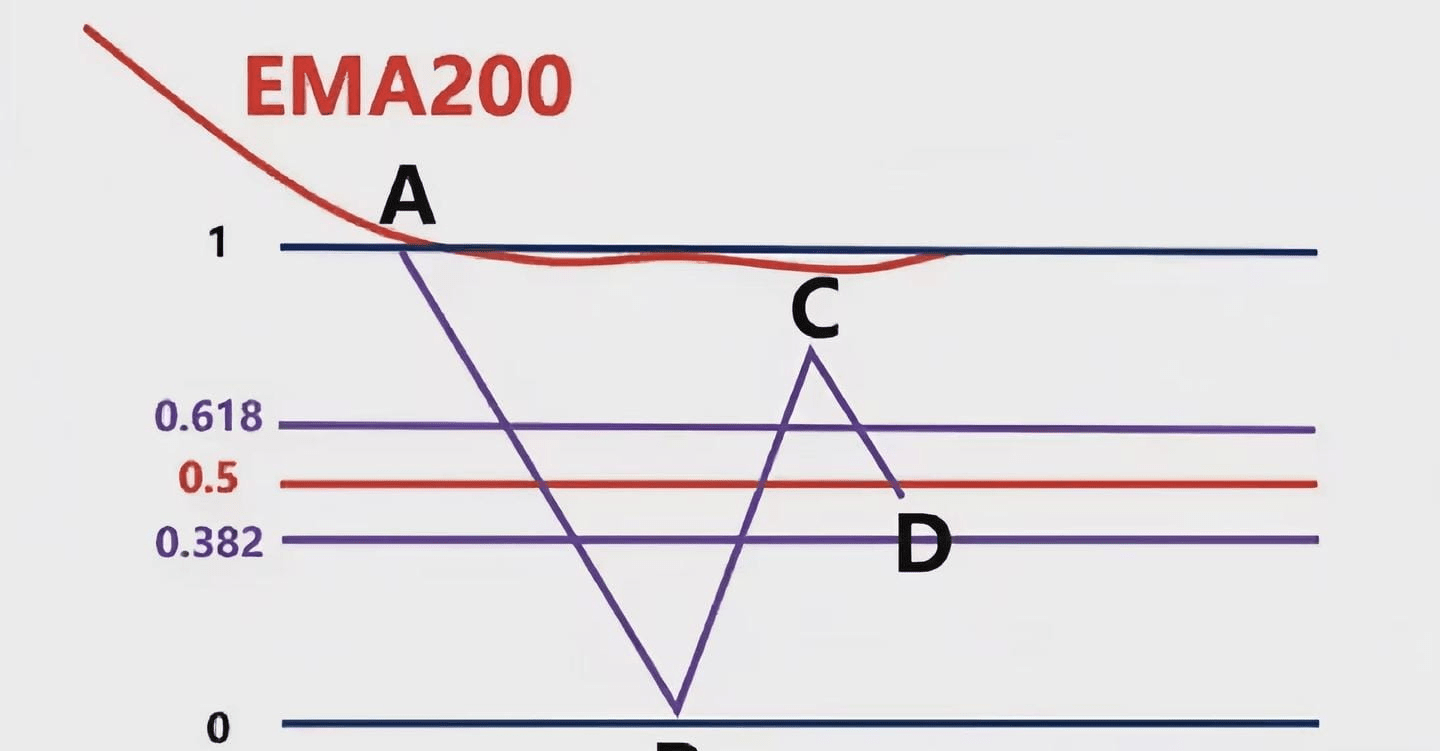
Figure 2.4-38
This indicates that there has been a deep rebound in the decline, which reflects the lack of seller power and may cause market fluctuations or reversals.
At this point, we draw the horizontal resistance line at point C. We can pay attention to the reaction when the price rebounds to the horizontal resistance position, as shown in Figure 2.4-39.
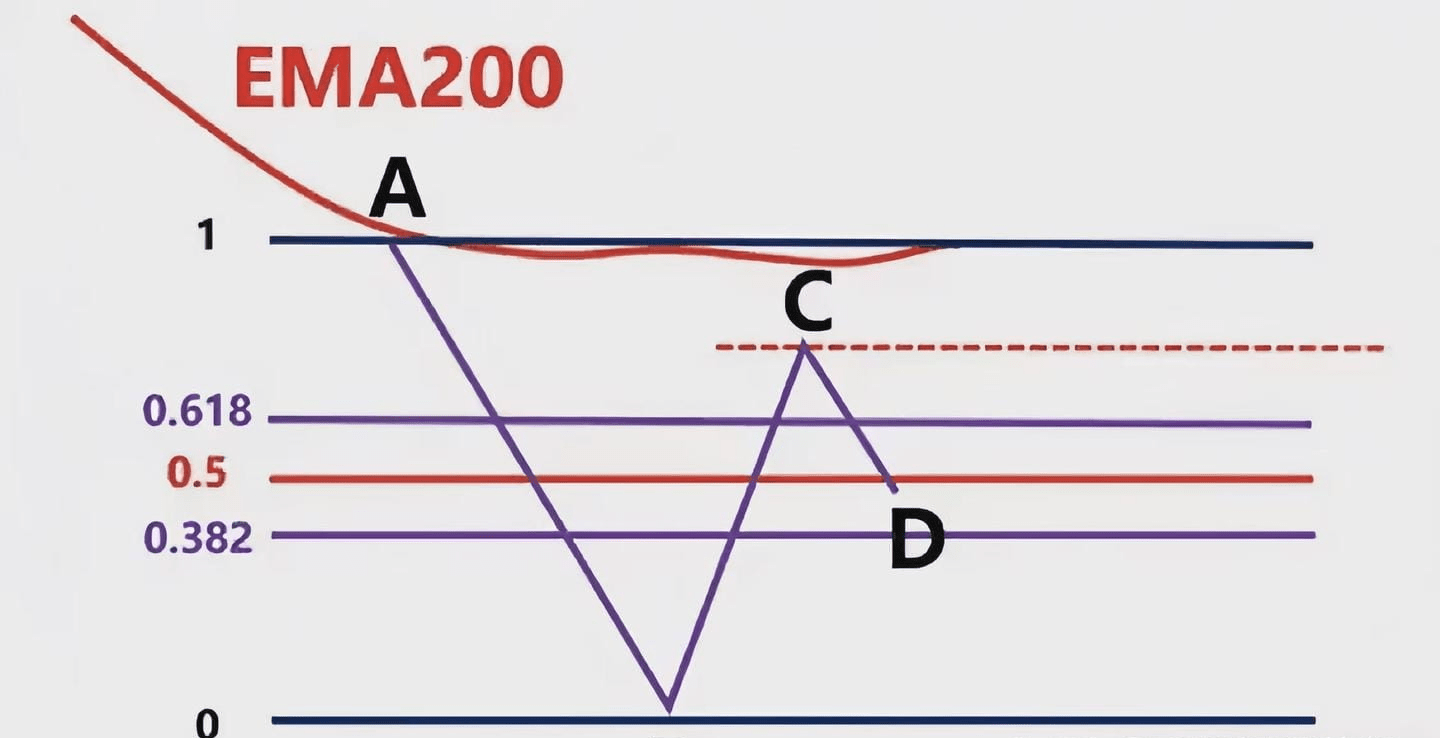
Figure 2.4-39
As mentioned many times before, if the market has not reversed, we should follow the trend, because following the trend is always the easiest way to make money. We should pay attention to whether it will form a double top, as shown in Figure 2.4-40.
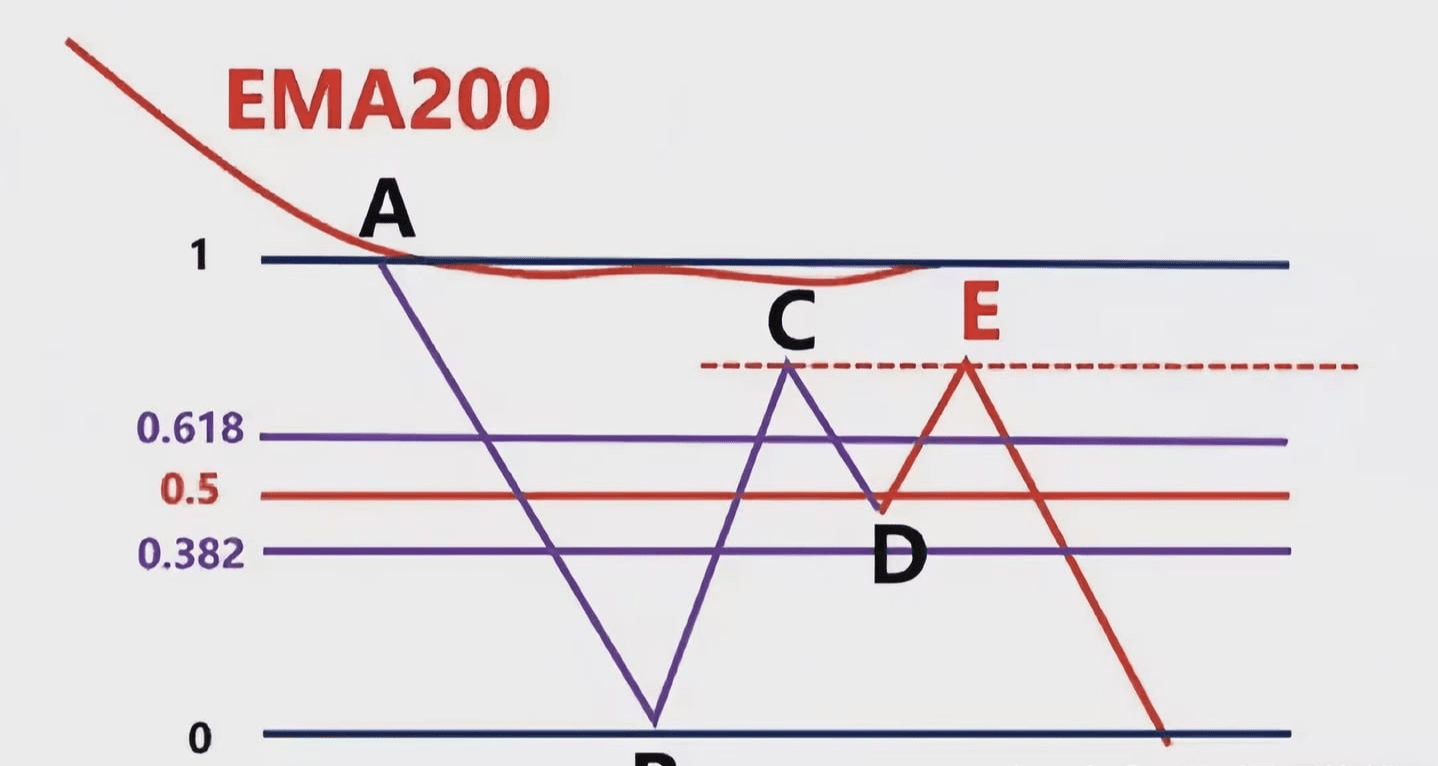
Figure 2.4-40
Therefore, it is possible that it will form a double top at the resistance line drawn at the high point C and then continue to fall. Of course, it is also possible that it will directly break through this resistance line. If point C is broken, we will focus on the band high point A, draw a horizontal resistance line through A, and then observe the price reaction near this resistance line, as shown in Figure 2.4-41.
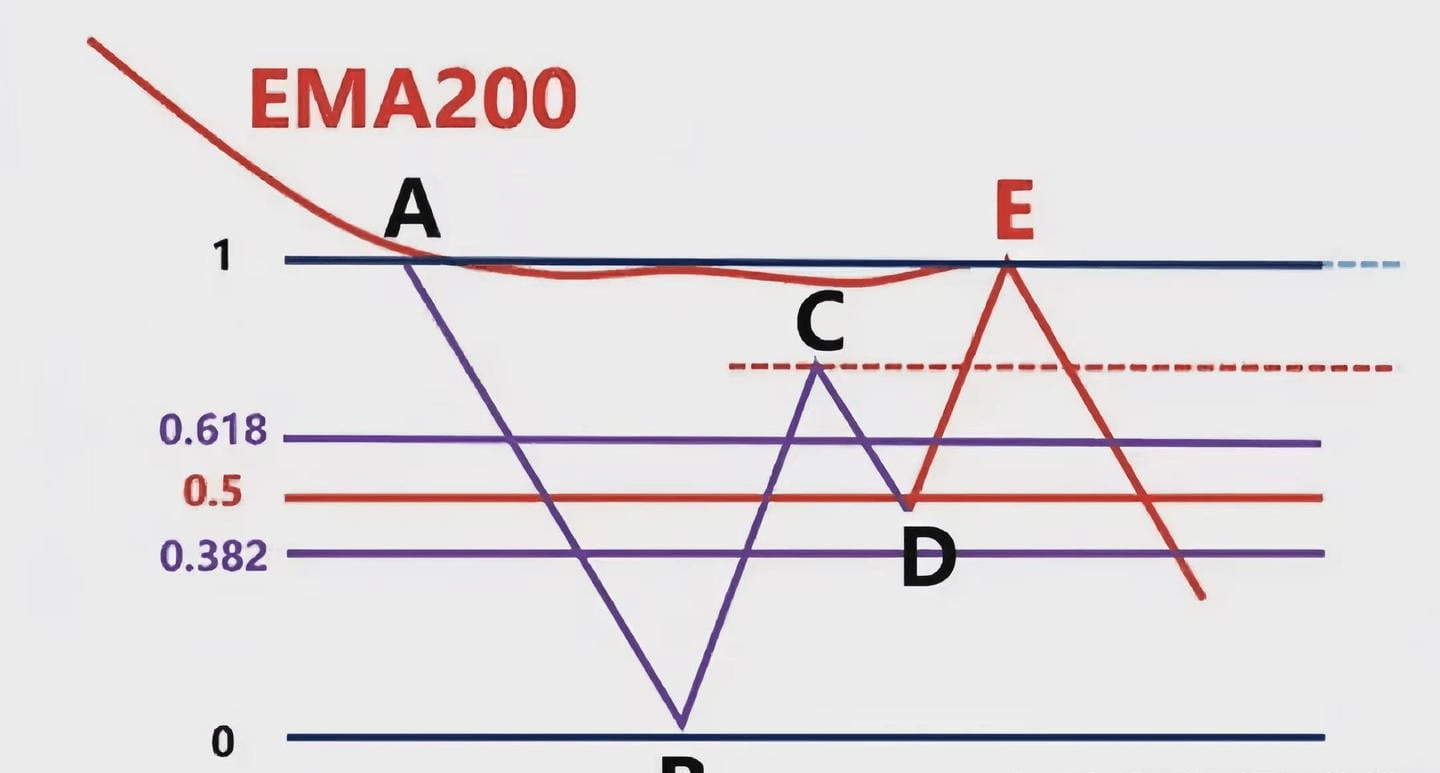
Figure 2.4-41
It could be consolidating, reversing, or continuing to fall after consolidation. These are unpredictable, so we need to pay close attention. The above charts mainly assume several scenarios where the price rises at point D. If the price does not rise at point D but continues to fall, as shown in Figure 2.4-42, how should we find the high and low points of the band?
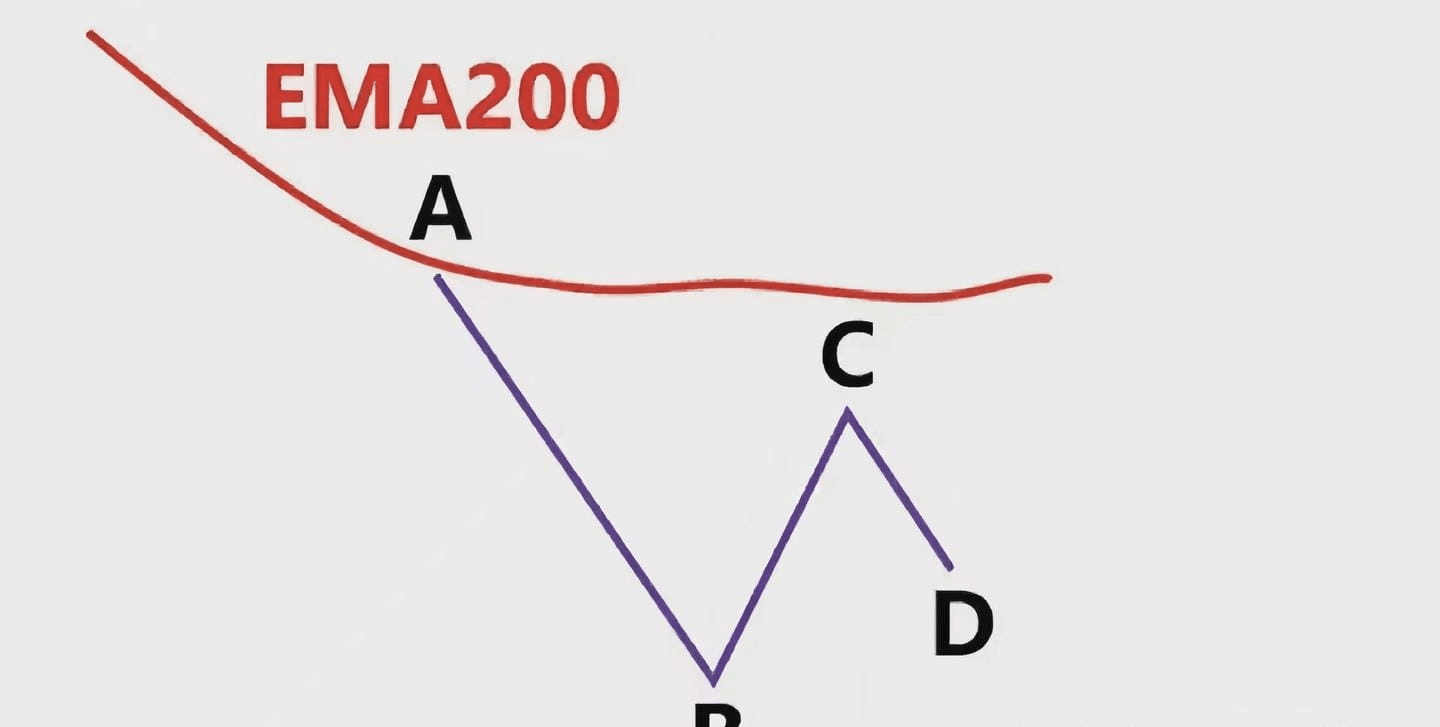
Figure 2.4-42
At this time, we should draw a horizontal support line with the band low point B, wait for the price to fall below the band low point B, and then create a new band low point E. At this time, we can draw the Fibonacci area with the band high point C and the band low point E, and observe the price behavior reaction between the 0.382-0.618 area, as shown in Figure 2.4-43.
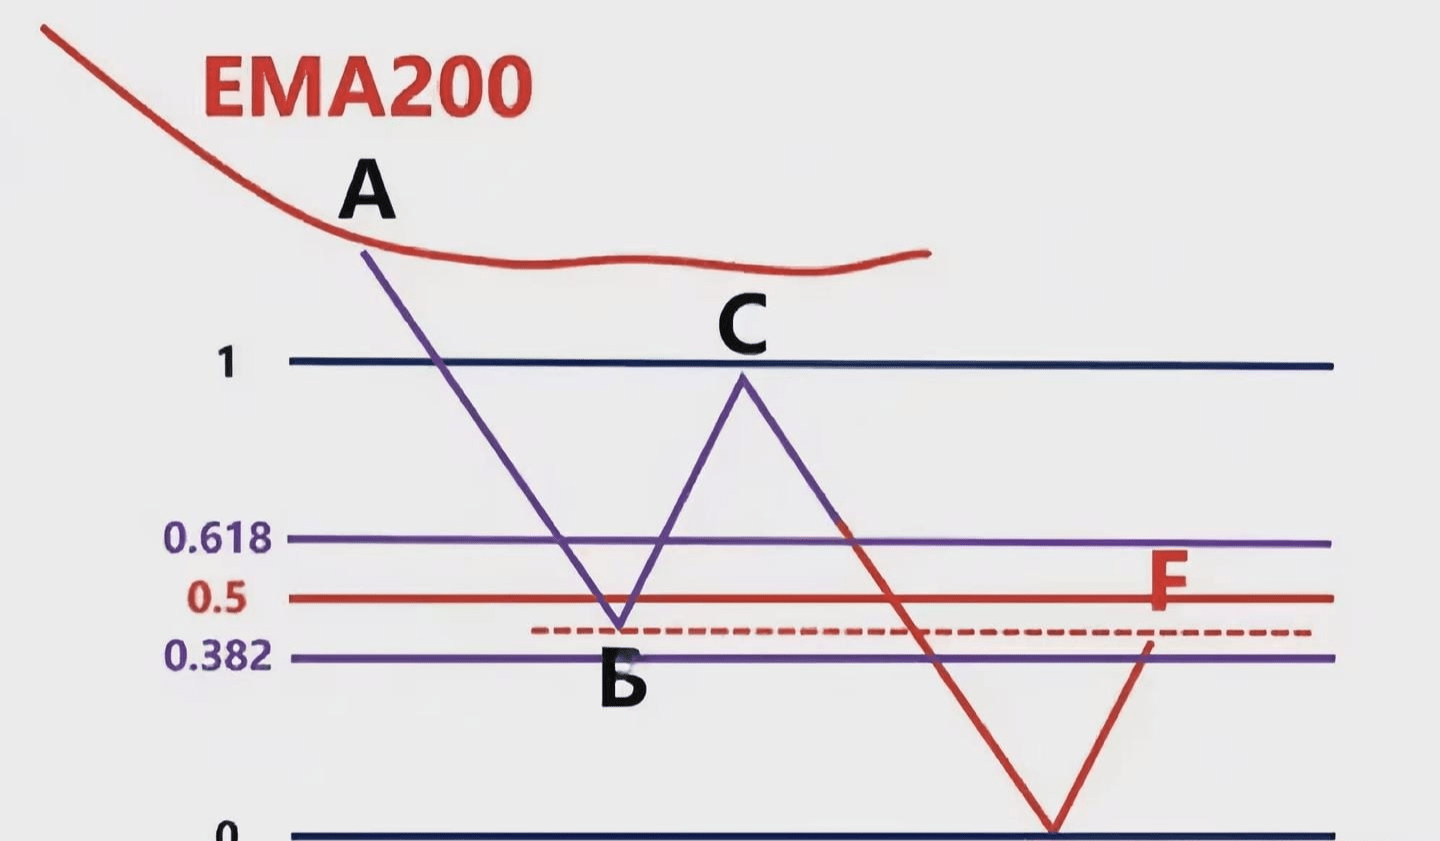
Figure 2.4-43
If the horizontal support line just drawn at point B is also within this area, a regional resonance will be formed, and this area should be closely monitored. Of course, when the price falls below the previous low point B, it may rebound from support and then fall below it again, forming a dense range, as shown in Figure 2.4-44. At this time, it is a position where momentum is waiting for an explosion.
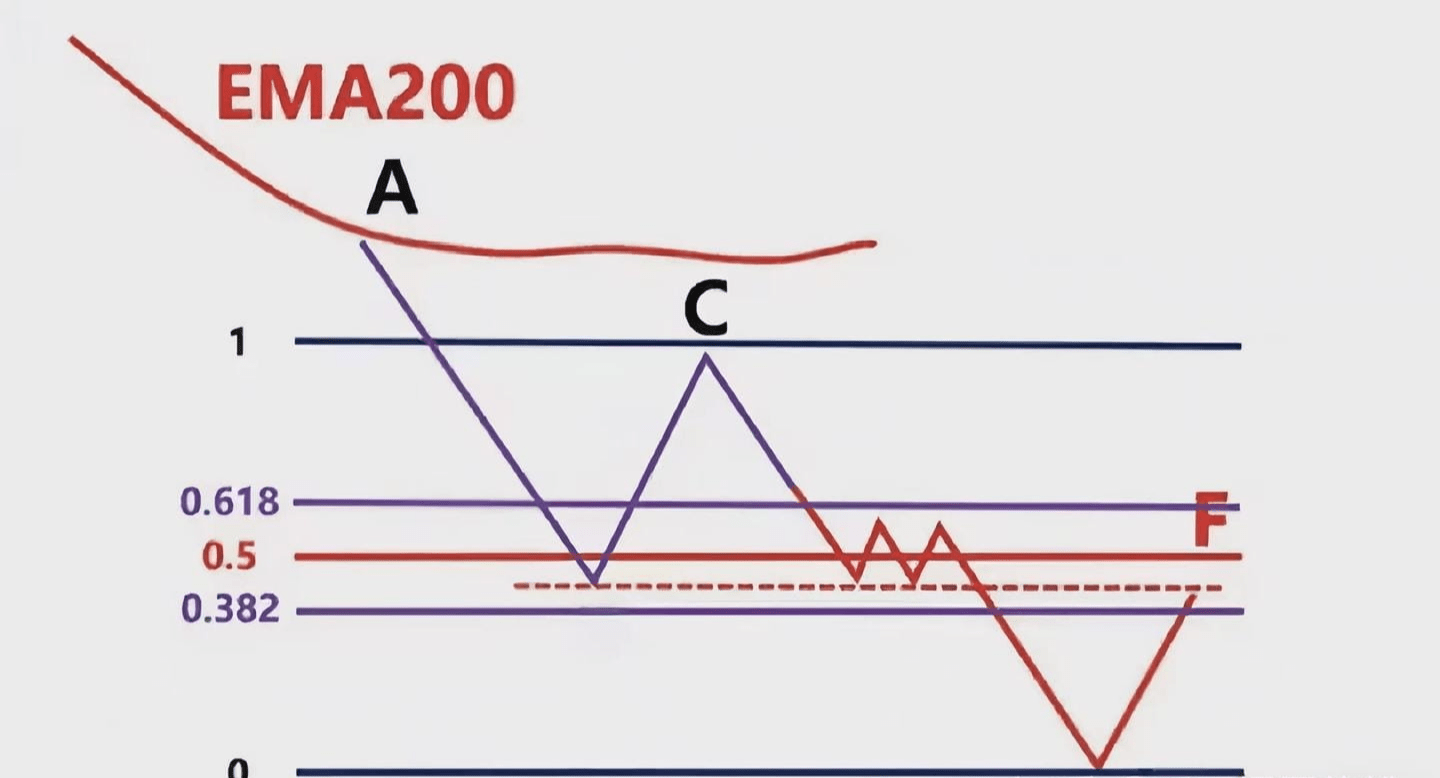
Figure 2.4-44
The most important thing is to see if it can eventually fall below and form a new low point, so that we can draw the Fibonacci area in this way. The above is the whole process of how to find the high and low points of the band in a downtrend. Now that the trend is determined and the high and low points of the band are confirmed, how do we draw it correctly? It is very simple. If it is an upward trend, the rule of drawing the line is to find the low point of the band first, then the high point of the band, that is, draw from the bottom to the top. At this time, we can see that 1 is at the bottom and 0 is at the top. If you find the high point of the band first and then the low point of the band, the numerical display of the graph you draw will be different, as shown in Figure 2.4-45.
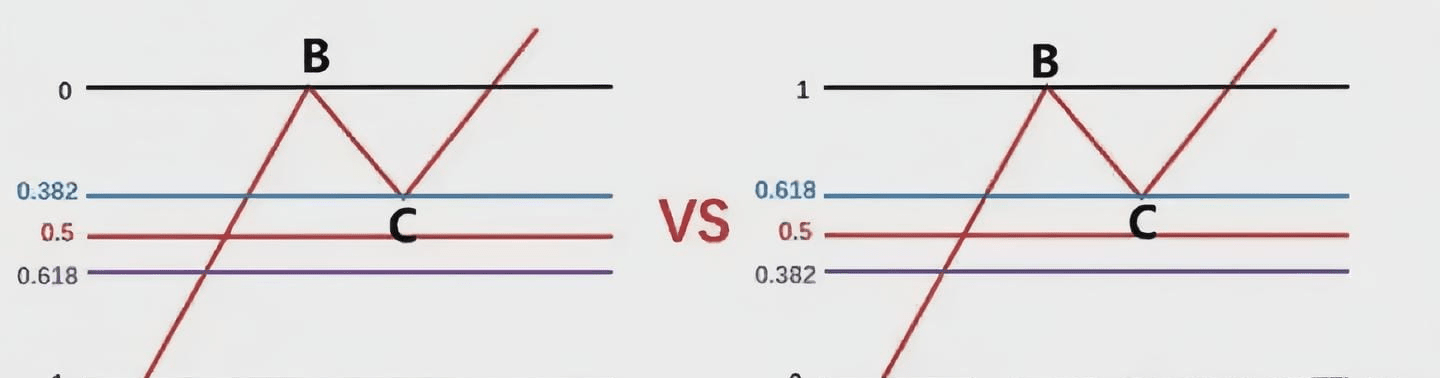
Figure 2.4-45
Obviously, the left one is correct, and the value on the right is the opposite. Some people don't pay attention when drawing, and draw very casually, which will lead to bad drawing habits. So in the early stage of learning, try to learn the correct habits, otherwise it will be difficult to change later. If it is a downward trend, then the rule of drawing lines is to find the high point of the band first, and then find the low point of the band, that is, draw from top to bottom. At this time, we can see that 0 is at the bottom and 1 is at the top. If you find the low point of the band first, and then find the high point of the band, the numerical display of the graph you draw will be different, as shown in Figure 2.4-46.
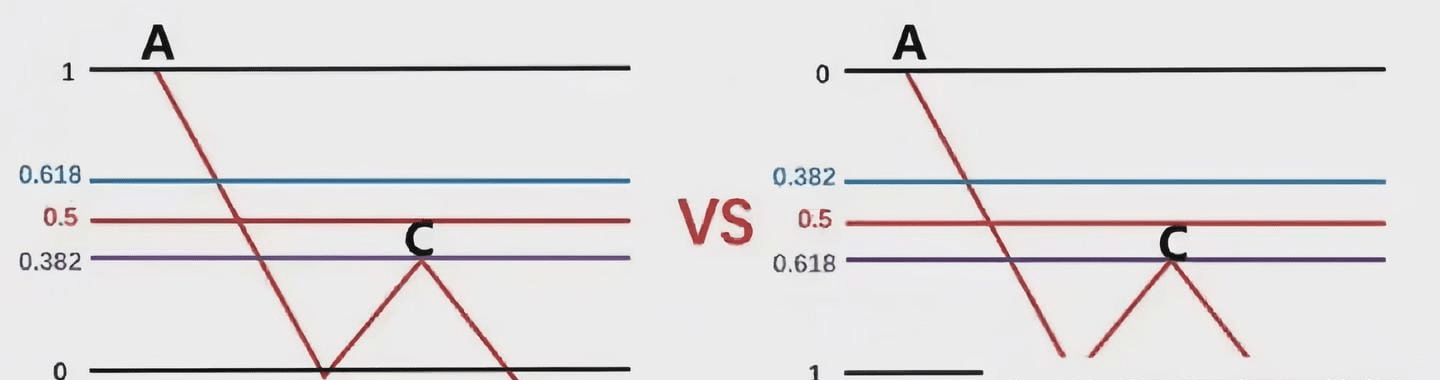
Figure 2.4-46
Obviously, the left side is correct, while the right side is reversed. The above is the detailed process for drawing Fibonacci lines. A question arises: when connecting high and low points, should we connect the shadows or the bodies? My personal understanding is that when connecting the highest and lowest points, we connect the shadows, not the bodies. Finally, let's look at the explanation of the actual market chart to deepen our understanding, as shown in Figure 2.4-47.
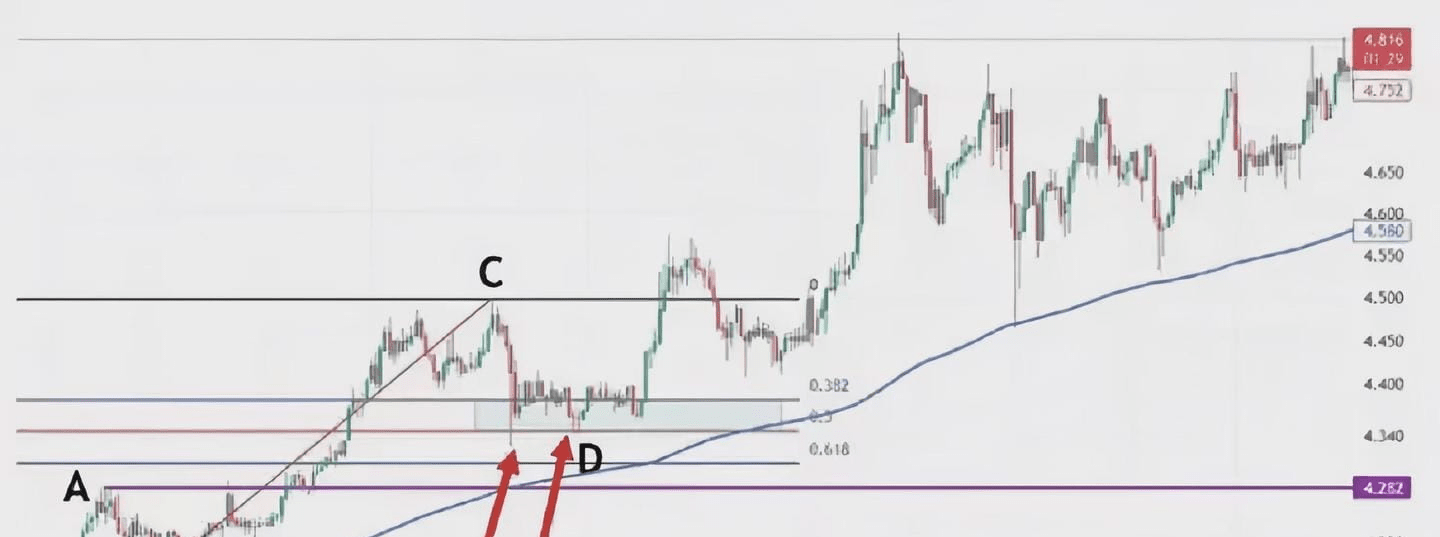
Figure 2.4-47
The blue line in the figure is EMA200. We see high point A and low point B. At this time, the price is above EMA200. We only go long and do not go short. We draw a purple horizontal resistance line with high point A. We see that the subsequent price directly breaks through A to reach high point C. We draw the Fibonacci area with low point B and high point C, and then observe the price performance when it returns to the 0.382-0.618 area, which is the light green area on the figure. We see that the price forms a double bottom in the area marked by the red arrow, and at the same time forms a small dense range at the bottom on the right. We can enter the market directly when it breaks through the top of this range. Of course, you can also choose other entry methods. Let's look at another chart, as shown in Figure 2.4-48.
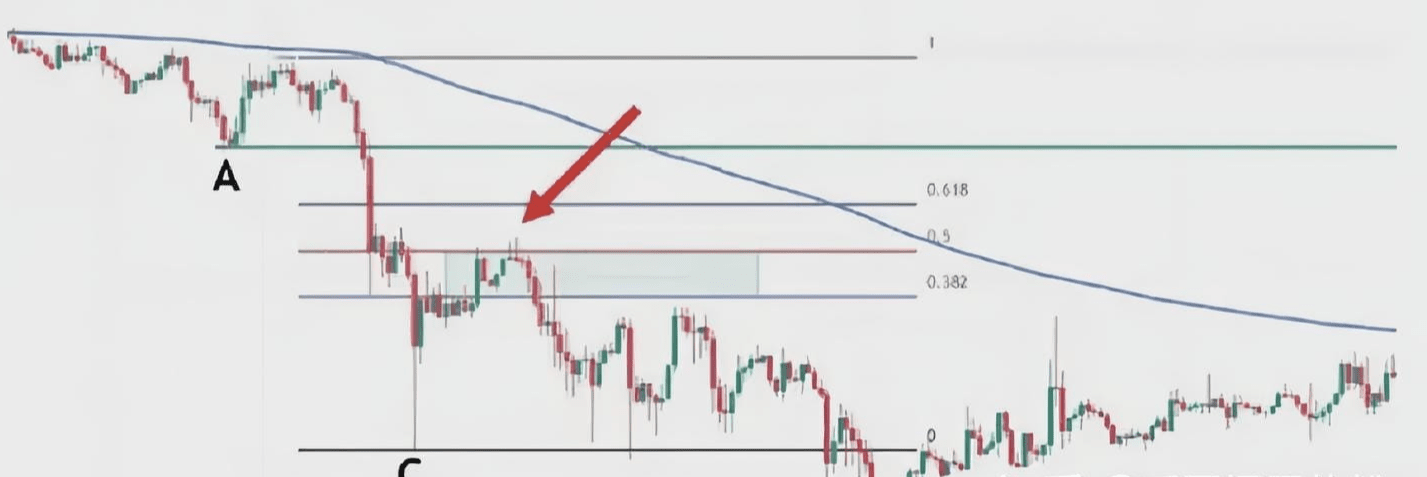
Figure 2.4-48
The blue line in the chart is the EMA200. We see low point A and high point B. At this point, the price is below the EMA200. We only go short, not long. We draw a green horizontal support line from low point A. The price then drops directly below A to reach low point C. We then draw Fibonacci levels using high and low points B and C. We then observe the price's return to the 0.382-0.618 range, shown in light green on the chart. We see a double doji (DD) signal forming at the 0.5 Fibonacci level, indicated by the red arrow. This signal forms a miniature double top with a small high point to the left, signaling an entry. Of course, you can also choose other entry methods. The above is a guide to Fibonacci charting techniques. I hope you'll practice and master it.
Now that you've made it this far, let me share another secret with you. This secret can help you avoid many pitfalls! Because 97% of people in the cryptocurrency world have made these mistakes, it's truly super valuable. What did those who achieved financial freedom in the cryptocurrency world do right?
As someone who has weathered several bull and bear cycles, and who knows a few who have truly emerged victorious, I want to say this: They often rely not on gambling but on perseverance; not on frequent trades but on crucial decisions. Behind wealth lies a mindset and discipline that defies human nature.
Below, I have summarized a few truly important principles based on my own experiences and those of those around me - these are often the opposite of the pitfalls most people fall into.
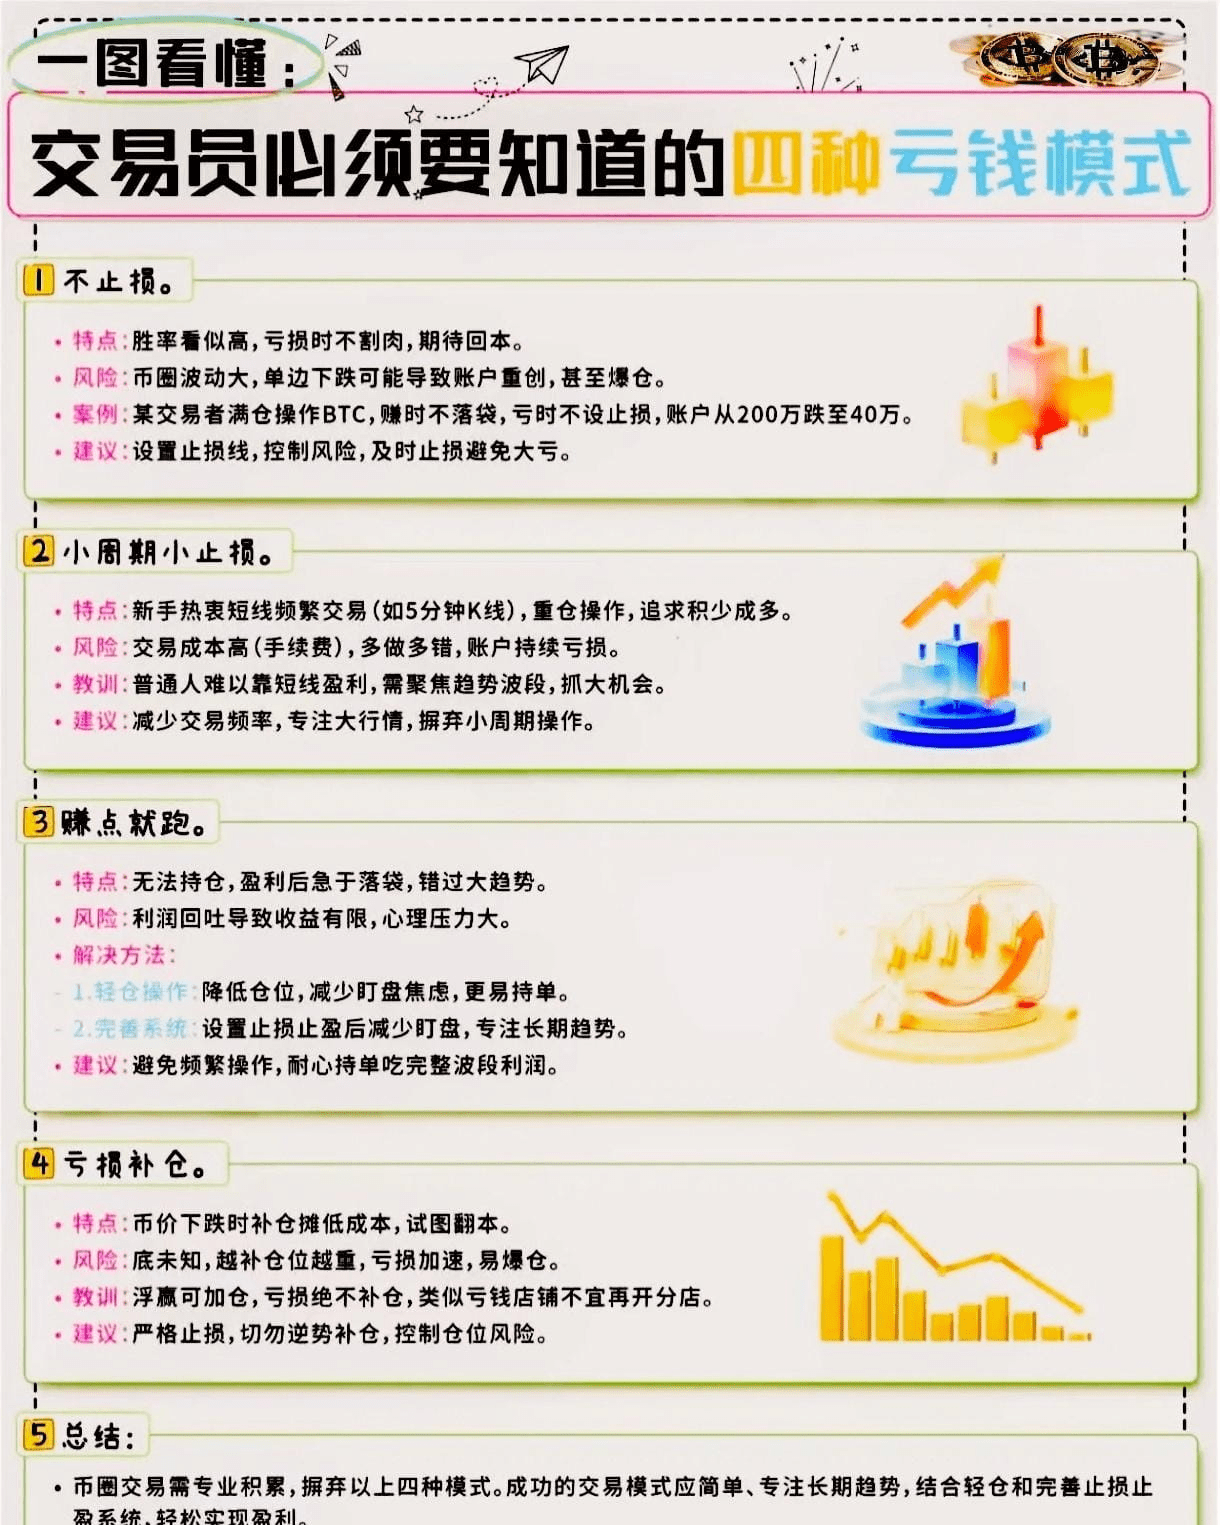
1. Strictly set stop-loss orders and don’t hold on to them ✅
The cryptocurrency market is extremely volatile, and a round of unilateral decline may wipe out the vast majority of people who do not set stop-loss orders.
I have seen too many people, from BTC to various altcoins, who comfort themselves by "holding on for the long term" when they are trapped, and even keep adding to their positions, but end up getting deeper and deeper into trouble.
Those who have truly come out of this have strict stop-loss discipline. They understand that survival is more important than anything else.
Do not accept large pullbacks, do not hope that "it will definitely go back up", and do not hope to "spread the cost" by chance.
In a word: cut off your arm to survive and live to the next bull market.
2. Infrequent trading to seize the big market ✅
Many people always think about "high-frequency trading" and "short-term compound interest", especially in the cryptocurrency circle, where 24-hour trading and contracts are rampant, making it easier for people to become addicted.
But in fact, frequent operations + short-cycle trading are precisely the fastest way for novices to lose money - not only do they consume energy, but they also pay a lot of transaction fees.
People who really make money often do not move during normal times, but invest heavily when opportunities arise.
They don't care about daily fluctuations, but only focus on real trend opportunities. In a bull market, they hold onto mainstream coins, and in a bear market, they go short or invest regularly. It's that simple.
3. Hold on to profitable orders and take advantage of the trend ✅
This is extremely inhumane.
Most people want to run away when they make a little profit, fearing that the profit will be lost; but they hold on to their losses, fantasizing about getting their money back.
Those who truly achieve freedom can hold on to profitable positions, and even increase their positions with floating profits, letting profits run.
How to do it?
Light position is the key to holding the order
Watch the market less and be less affected by short-term fluctuations
Trust your own judgment and don't let go easily until the whole market is complete.
4. Never cover your losses ✅
This is a bloody lesson.
Many people buy more as the price falls, and as a result, what was originally a small loss turns into a big loss; their positions become heavier and heavier, and their mentality completely collapses.
A truly sober person will only increase his position after making a profit. If he suffers a loss, he will either stop the loss or not invest at all.
remember:
“When you lose money, don’t try too hard to make it back. When you make money, you should work hard to make more.”
5. The last and most crucial point: cash in on the bull market and layout in the bear market ✅
The people around me who have truly achieved freedom through the cryptocurrency world are not “holders” who always have full positions.
They understand:
Sell gradually during the bull market frenzy
Continue to invest regularly during a bear market
Many people fall into the cycle: they are greedy and hold on to their stocks in the bull market, and they sell their stocks in despair in the bear market.
What they did right was:Buy when no one is interested, and leave when the crowds are buzzing。
Final Thoughts
The cryptocurrency world is a place where human nature is greatly exaggerated. There are many myths of getting rich quick, but there are even more people who leave the market in misery.
The so-called "financial freedom" is not about getting rich overnight, but about:
Disciplined
Be patient
Dare to buy when others are fearful
Dare to quit when others are crazy
Can you also insist on doing the right thing in these aspects?
Let’s encourage each other. Finally, I wish you good luck!!
A single tree cannot make a boat, and a single sail cannot sail far! In Erquan, if you don’t have a good circle and first-hand information about the cryptocurrency circle, then I suggest you follow Lao Wang, who will help you get ashore for free. Welcome to join the team!!!