In the cryptocurrency market, using candlestick charts to determine entry timing is an important method of technical analysis. Here are some methods for determining entry timing based on candlestick charts:
1. Identify the trend
• Uptrend: If multiple consecutive bullish candles (green) appear in the candlestick chart, and each bullish candle's closing price is higher than the previous one, it indicates that the market is in an uptrend.
• Downtrend: If multiple consecutive bearish candles (red) appear, and each bearish candle's closing price is lower than the previous one, it indicates that the market is in a downtrend.
• Trend reversal signals: Certain specific candlestick patterns such as hammer, inverted hammer, morning star, engulfing pattern, etc., typically appear during trend reversals and can serve as entry signals.
2. Focus on Support and Resistance Levels
• Support Level: When the price falls to a certain range and bounces back multiple times, that range is the support level. If the price approaches the support level and a bullish candlestick pattern (such as a hammer) appears, consider entering a long position.
• Resistance Level: When the price rises to a certain range and falls back multiple times, that range is the resistance level. If the price approaches the resistance level and a bearish candlestick pattern (such as a hanging man) appears, one might consider entering a short position.
3. Volume and Price Coordination
• Volume and Price Coordination in Uptrend: If the price is rising while the trading volume also increases, it indicates strong buying pressure in the market, and one might consider entering a long position.
• Volume and Price Coordination in Downtrend: If the trading volume increases while the price is falling, it indicates strong selling pressure in the market, and one might consider entering a short position.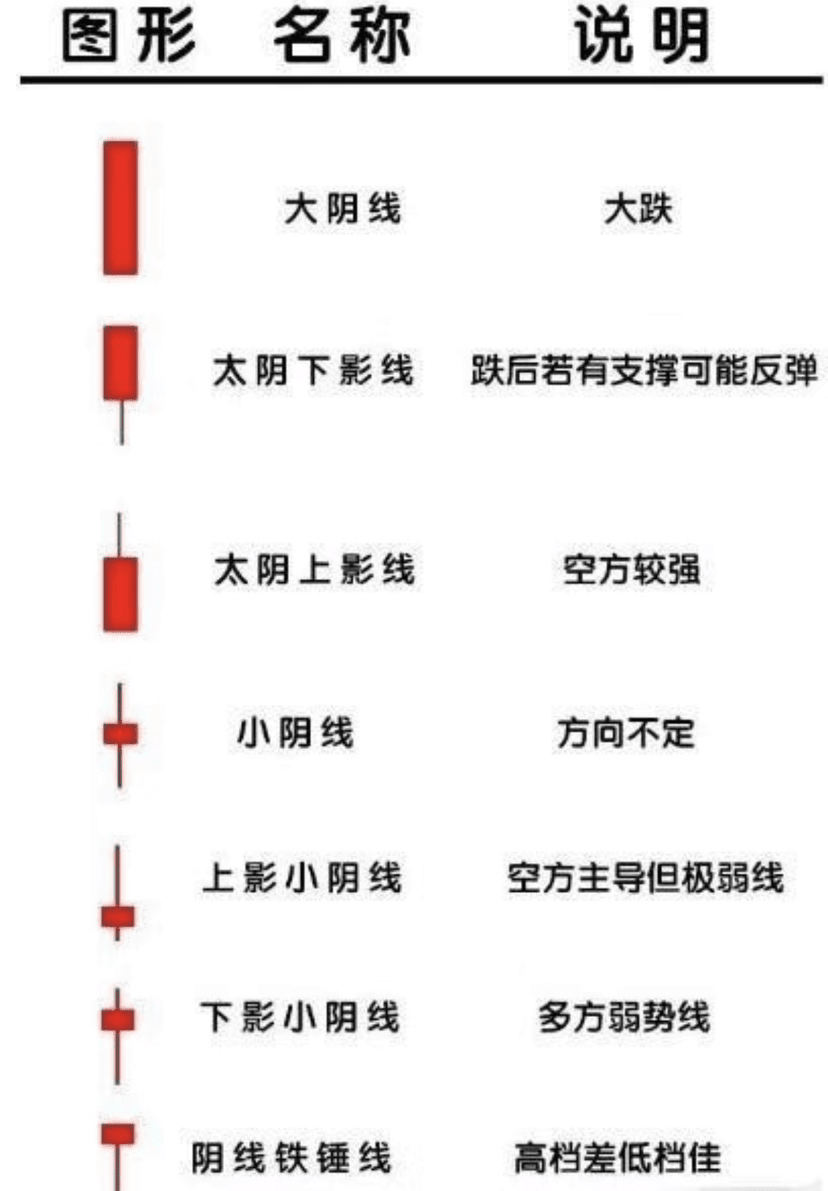
4. Special Candlestick Patterns
• Hammer: Appears at the bottom of a downtrend, with a long lower shadow, at least twice the body size, indicating that the market may reverse upwards, signaling a long entry.
• Inverted Hammer: The pattern is similar to a hammer, but the shadow is on the upper side, indicating that the market may reverse upwards, suitable for entering a long position.
• Three White Soldiers: Composed of three consecutive bullish candles, where each bullish candle's closing price is higher than the previous candle's high, indicating a strong upward trend in the market, suitable for entering a long position.
• Bullish Engulfing: A long bearish candle followed by a shorter bullish candle, where the bullish candle is completely within the body of the bearish candle, indicates that the downtrend may be ending, suitable for entering a long position.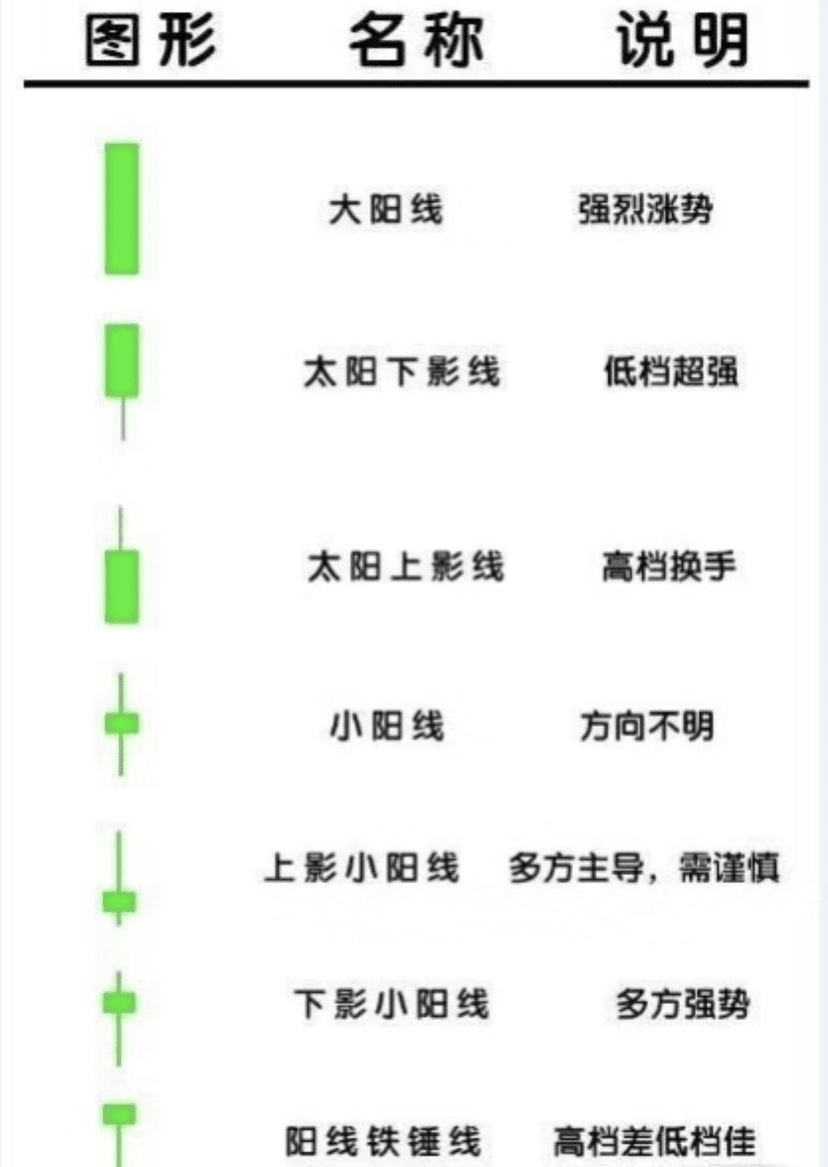
5. Combine with Technical Indicators
• Moving Average Crossover: When the short-term moving average (e.g., 5-day moving average) crosses above the long-term moving average (e.g., 10-day moving average), forming a golden cross, it indicates that the market may enter an upward trend, signaling a long entry.
• MACD Indicator: When the short-term MACD line crosses above the long-term MACD line, forming a golden cross, it indicates that the bullish trend in the market is strengthening, suitable for entering a long position.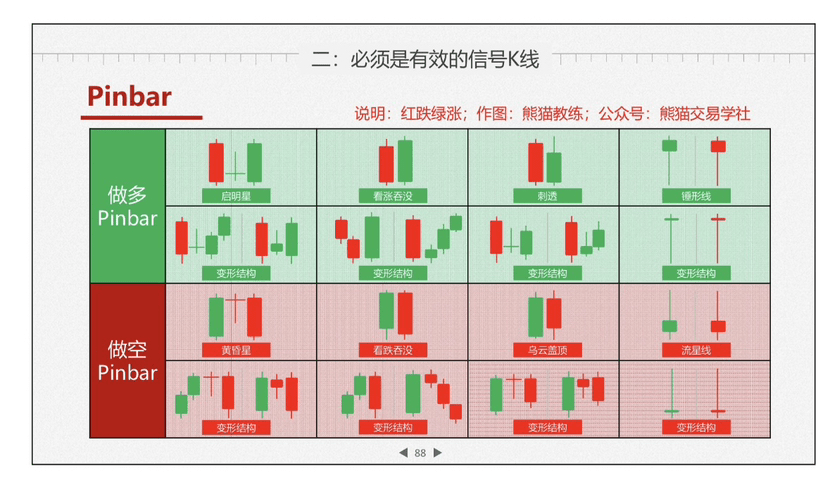
6. Risk Management
• Set Stop Loss: When entering a position, it is recommended to set a stop-loss point to control risk. The stop-loss point can be set outside of key support or resistance levels.
If you are still too confused, you can follow me. I usually analyze some cutting-edge information and practical strategies. Feel free to come and discuss, and let's seize the big opportunities together!@星哥狩猎日记
