🚀 DOGE/USDT Technical Analysis Update – Trader’s Eye View (4H Chart) 🚀
Dogecoin is once again catching the eyes of traders as price action shows a very interesting setup on the 4-hour chart. Let’s break it down step by step so you can see why this level is critical 👀:
---
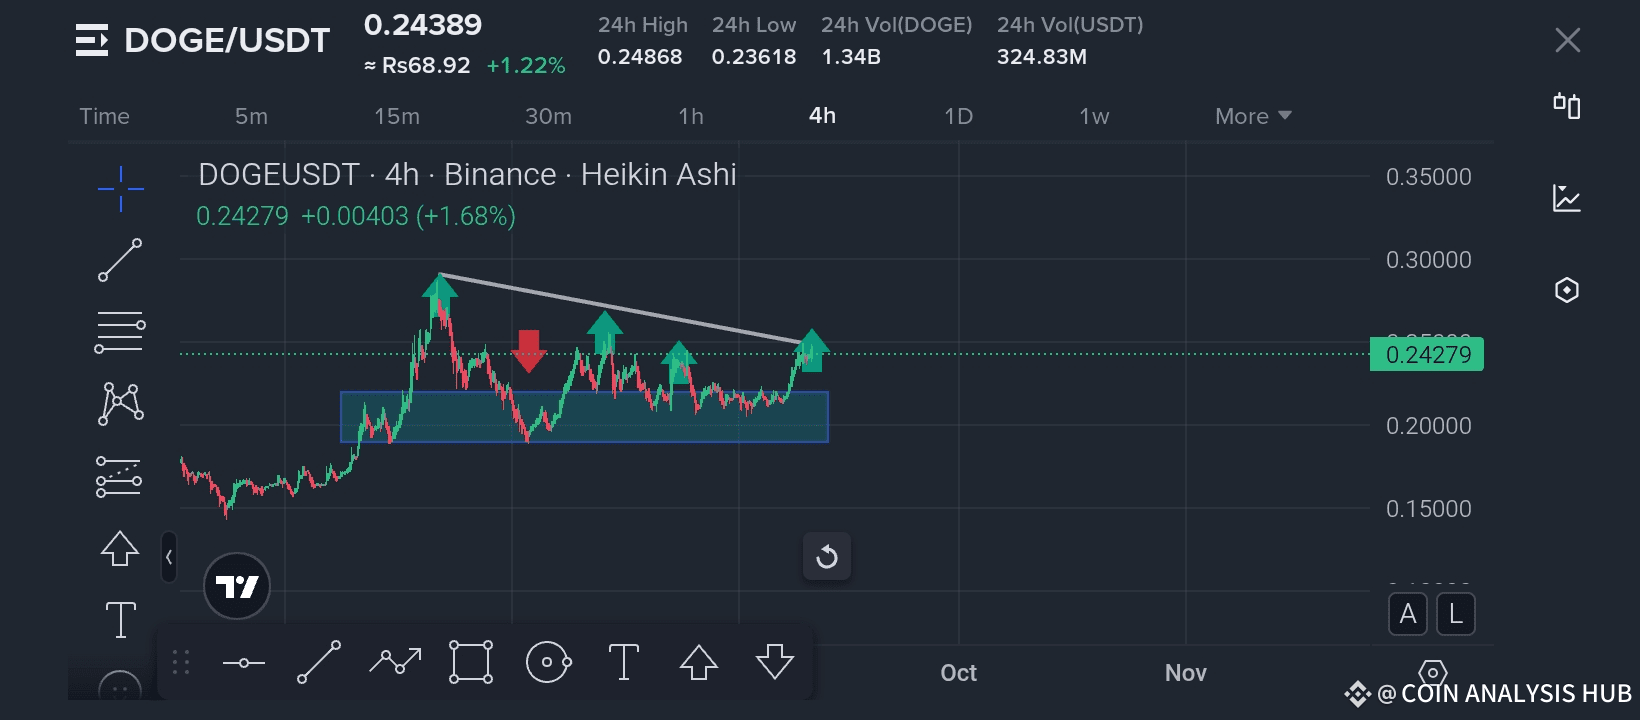
📊 Current Price: $0.24279 (+1.68%)
24h High: $0.24868
24h Low: $0.23618
---
🔎 Chart Insights
1️⃣ Strong Demand Zone
DOGE has been consolidating in a solid support box around $0.230 – $0.240 (highlighted in blue).
This range has acted as a strong demand zone where buyers keep stepping in.
2️⃣ Descending Trendline Resistance
Notice the white descending line (resistance trendline).
Price has tested it multiple times (green arrows), showing strong selling pressure.
3️⃣ Attempted Breakout
DOGE is once again testing the trendline, suggesting a possible breakout attempt.
A confirmed breakout above $0.25 – $0.255 could trigger strong bullish momentum.
4️⃣ Volume Factor
Current volume shows steady accumulation, hinting that big players might be loading up before the next move.
---
📈 Bullish Scenario
If DOGE breaks and holds above $0.255, we may see a rally toward:
🔹 First Target: $0.28
🔹 Second Target: $0.30
🔹 Longer-term Target: $0.35
📉 Bearish Scenario
If DOGE fails to break resistance, price could pull back to the support zone ($0.23 – $0.24).
Losing that zone could bring DOGE down toward $0.20.
---
🔥 Trader’s Eye Tip:
Always wait for a confirmed breakout with good volume before entering long positions. For short-term traders, $0.23 remains a solid support, while $0.25+ is the key breakout level to watch.
---
✨ If you found this analysis useful, don’t forget to:
👍 Like the post
💬 Drop your thoughts in comments
🔁 Share with other traders
👥 Follow our channel for daily eye-catching technical updates
👉 Stay sharp, stay patient – the DOGE breakout could be closer than we think! 🚀🐕💎
Best of luck 🤞 🍀 🤞
