Most people think trading is hard, but with 5-minute candlestick charts, you can start small and learn fast. Each candle shows what price did in just 5 minutes:
🟩 Green candle = price went up
🟥 Red candle = price went down
By spotting simple patterns, you can predict short moves and make quick profits.
---
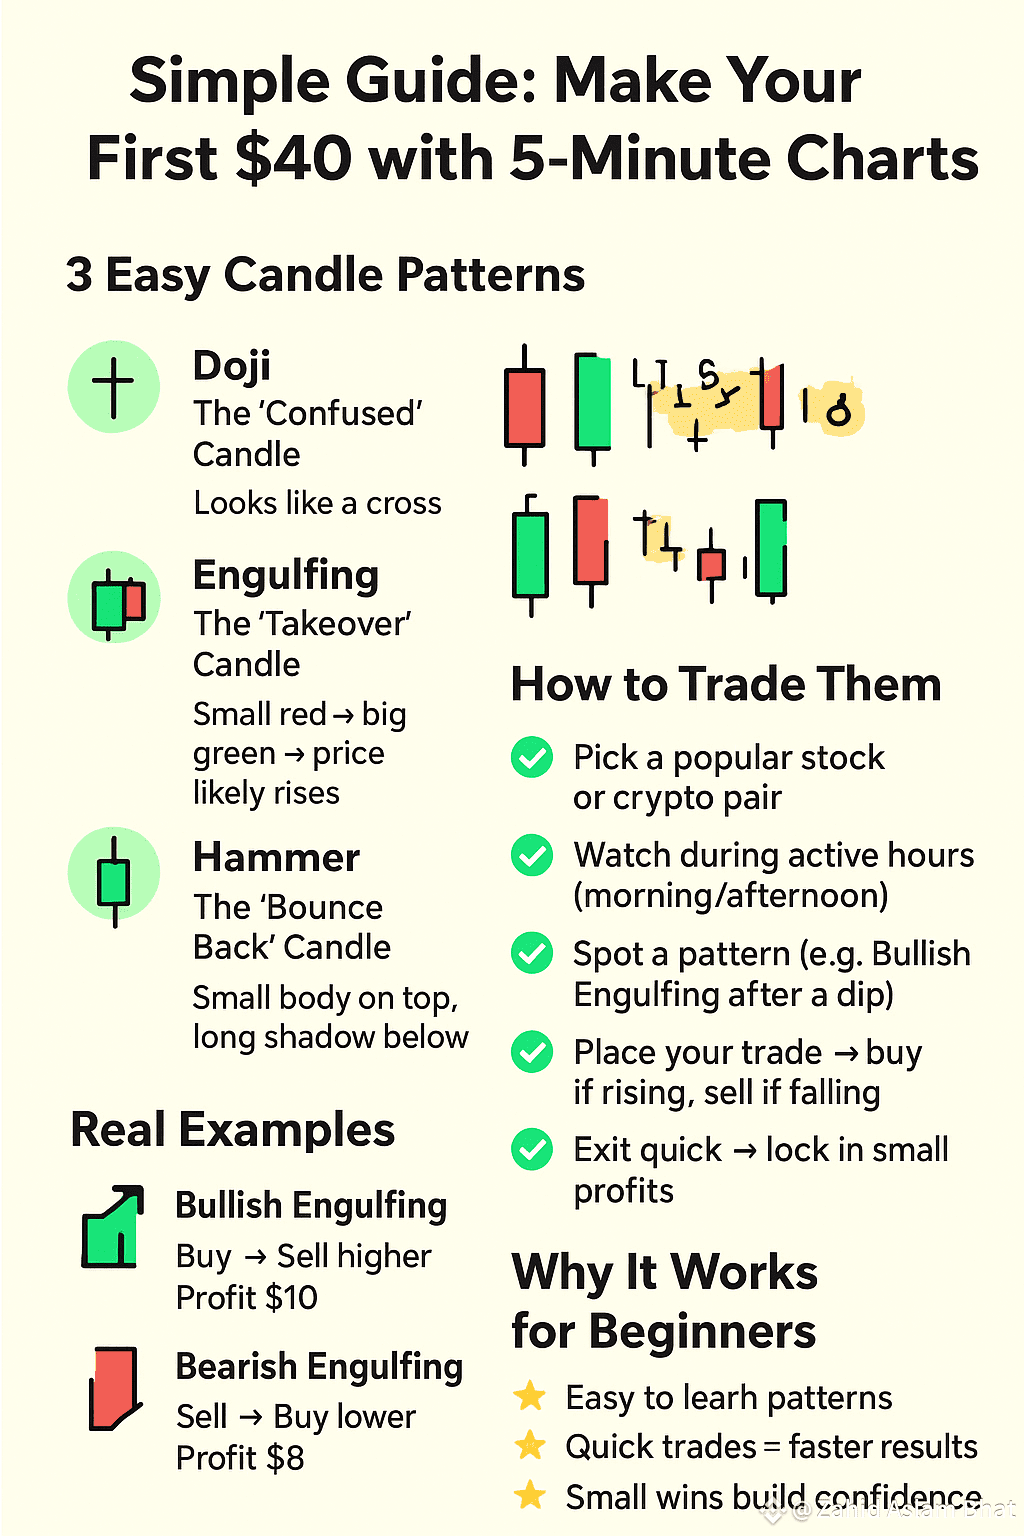
🔎 3 Easy Candle Patterns
1️⃣ Doji – The “Confused” Candle
➕ Looks like a cross
⚖️ Buyers & sellers balanced → trend may reverse
2️⃣ Engulfing – The “Takeover” Candle
🟩 Bullish Engulfing: red → big green → price likely rises
🟥 Bearish Engulfing: green → big red → price likely falls
3️⃣ Hammer – The “Bounce Back” Candle
🔨 Small body on top, long shadow below
💪 Buyers fought back → price may rise
-
🛠️ How to Trade Them
✅ Pick a popular stock or crypto pair
✅ Watch during active hours (morning/afternoon)
✅ Spot a pattern (e.g., Bullish Engulfing after a dip)
✅ Place your trade → buy if rising, sell if falling
✅ Exit quick → lock in small profits
--
💰 Real Examples
Spot Bullish Engulfing → Buy → Sell higher → Profit $10
Spot Bearish Engulfing → Sell → Buy lower → Profit $8
Repeat 4–5 times → $40 a day
🌟 Why It Works for Beginners
*Easy to learn patterns
*Quick trades = faster results
*Small wins build confidence
📌 Final Tips
Start small → risk less money
Be consistent → practice daily
Candles tell a story → learn to read them
👉 Master 5-minute candles, and hitting $40 a day becomes realistic.$BTC $XRP $SOL #BinanceHODLerOPEN #USNonFarmPayrollReport #MarketPullback #BTCvsETH #NEWTBinanceHODLer