It's now 2025, and domestic ETFs have all been approved. Globalization is inevitable. There are a bunch of U businesses out there trying to scare you and make you panic, using their usual tricks. You don't need to pay attention to that. The key is to consider how to enhance your ability to make more money in the crypto space before thinking about the withdrawal issue.
When you make a considerable amount of money, your social circle changes, and naturally, you can solve the withdrawal issue.
Now let me talk about how to make more money in the crypto space!
First, let me introduce myself. I was born in 1985 and entered the crypto space in 2013. I really started enjoying it in 2016. In 2017, I hit the big bull market and made my first 10 million right away. After that, I got carried away, and eventually lost all the money I earned, as well as my parents' hard-earned savings of over 3 million. I even borrowed 5 million from relatives and friends to trade, and lost all of it, paying the tuition fee to the market. In total, I lost over 8 million. My whole family was almost on the verge of collapse. My beloved wife was constantly arguing with me about this issue, even threatening divorce. With such immense pressure, I contemplated jumping off a building a few times. Fortunately, my willpower remained strong at that time, and I believed I could earn it back!
After a few years of adjustment, I began to quit my job to trade cryptocurrencies. I swore to my wife that if I didn’t earn it back... later I devoted myself wholeheartedly, summarizing the mistakes made earlier, observing the thoughts and skills of trading masters, and finally began to stabilize. Turning losses into profits is truly not easy! The account started to break even, combining contract and spot operations, no longer blindly entering and exiting, but planning the account properly; combining medium and short-term operations is the best for compound interest!
Later, I secretly borrowed 200,000 from my wife's family, and I used two years to turn that 200,000 into a net worth of over ten million. Now I own several small goals, and since then, my wife has seen me in a new light. From the moment I started making money, I became confident. My wife, like a good baby, is absolutely obedient to me!!!
Regarding my own experience, I divide it into four stages along the timeline.
Stage One (16-17). The ignorant are fearless; earning money to the point of losing reason. Entering the cryptocurrency world in 2016 (first touching it in 2013), I caught the bull market of 2017. With 100,000 as the capital, it peaked over 10 million. Two currencies left a deep impression: one is Public Trust Token (GXS), participating in a private placement with 2 BTC when BTC was at 6,000, and it opened at 3 million. The other is Antshares (later renamed Neo), buying 10,000 pieces at a price of 1, which rose to over 1,000, thus surpassing 10 million per single currency. Then I became complacent, thinking I could do anything, and at that time thought, why not set a small goal to earn 100 million first; once I earn 100 million, I would stop. Then... it became a story of someone with a mind full of desire, feeling invincible, getting taught a lesson by the market.
Stage Two (18-19). Reflect on oneself, start anew. In 2018, the market entered a downward cycle. Watching my hands full of altcoins and a hopeless future, my mood fell to the bottom. Every day I would scold myself as an idiot. However, the market will not open the back door because of your pain. Therefore, this stage is more about self-reflection and understanding the market. After a period of adjustment, I realized two truths. First, no one is more powerful than anyone else; we are all ordinary people. The reason I made money in 2017 was not because I was powerful, but simply because the market was too good, and I was lucky enough to stand on the trend—essentially a pig flying on the wind; taking off was inevitable. The second truth is about controlling funds. Small funds have their ways, and large funds have their ways. You cannot use small fund thinking to manage large funds; otherwise, it will end badly. After realizing this, I tidied up my emotions and began a new allocation of the chips in my hand, clearing most of the altcoins and swapping them for BTC, ETH, and USDT.
Stage Three (20-21). Rational allocation and timely profit-taking. After experiencing a complete bull and bear cycle, my mindset has become much calmer. Plus, the cryptocurrency market has entered an upward cycle again, so assets are continually appreciating. What I do more at this stage is profit-taking and continuous reallocation. Therefore, it is relatively less intense than in 2017. Perhaps due to aging, I feel that simplicity and tranquility are the true essence.
Stage Four (22-?). Cultivating inner strength, believing in the future. I am confident in the future of the cryptocurrency market. Exceeding previous highs is inevitable. Right now, we only need to do one thing: do not leave the market, stick to holding quality assets, and we will definitely reap rewards in the future.
(Six iron rules of cryptocurrency)
1. Only participate in the irreversible upward trend of the market.
"Only participate in the irreversible upward trend of the market." The market is reality; it is unquestionable and unchallengeable. The trend is irreversible. As investors, we must dare to acknowledge mistakes, correct them at any time, reject uncertain markets, and engage in those trends that even manipulators must follow. We must understand to go with the trend.
2. Refuse frequent trading.
The casino is open 24 hours; there is no need to trade frequently. There are many logics like timing, trial and error, and position control. What we advocate is to wait for the perfect opportunity like a hunter, rather than randomly investing as soon as we see prey.
3. Do not be superstitious about technical indicators.
First, we must acknowledge that all technical indicators have their lagging nature. For example, when the MACD indicator issues a golden cross buy signal, the currency has already risen significantly, and the moment the golden cross occurs, you might just be the one taking over!
4. Buy and forget about the cost price.
When you short or go long, the cost price has nothing to do with any subsequent operations, as whether to sell depends on market trends, and it has nothing to do with whether you are still making a profit. If the shape is good, hold on; if the shape is bad, reduce your position or even liquidate.
5. Participate with money you can afford to lose.
Use spare money to trade cryptocurrencies; all investments carry risks. Investors can increase their investment after mastering the game's profit techniques. Before that, you must participate with funds you can afford to lose; borrowing money often leads to severe losses!
6. Ensure that profits are withdrawn on time.
Without cashing out, everything is just numbers. Cryptocurrency investors are like gamblers who have not left the casino. Even if they temporarily earn a lot of money, they cannot be considered winners. Only when you extract cash from the market can you say you ultimately won. In the cryptocurrency world, withdrawing funds on time is a good habit.
From losing 8 million to currently having over 200 million in wealth, mastering the wealth password technology—mastering these technical indicators MA and MACD, Boll and RSI, will easily lead to tens of millions! (Pure dry goods, suitable for everyone, can be learned easily, and is easy to understand) Must collect!

1. Explanation and use of MA moving average indicator.
The MA indicator, also known as Moving Average, calculates the average price within its numbers. For example, MA5 represents the average price of 5 time periods (including the current) candle charts, whether at the minute level, hourly level, or daily level. The smaller the MA number, the more sensitive the fluctuations, focusing more on short-term fluctuations; conversely, the larger the MA number, the slower the fluctuations, focusing on long-term fluctuations.
Set the MA numbers according to your preferences. Here I share two sets of MA trading methods I commonly use: Vegas Channel and Squeeze Channel.
Vegas Channel
The Vegas Channel, whose simplified explanation is using the 144 and 169 moving averages to judge medium to long-term trends, is not suitable for periods below 15 minutes and is used for periods above 1 hour.
Why use these two moving averages?
Upon careful observation, we can see that 144 and 169 are the squares of 12 and 13 respectively. This principle implicitly contains Gann's square theory and the Fibonacci sequence. That is, the number 144 comes from Gann's square theory, and the number 169 is the square of the Fibonacci sequence number 13. Only by combining the two can we achieve better application effects in practical operations.
Example explanation:
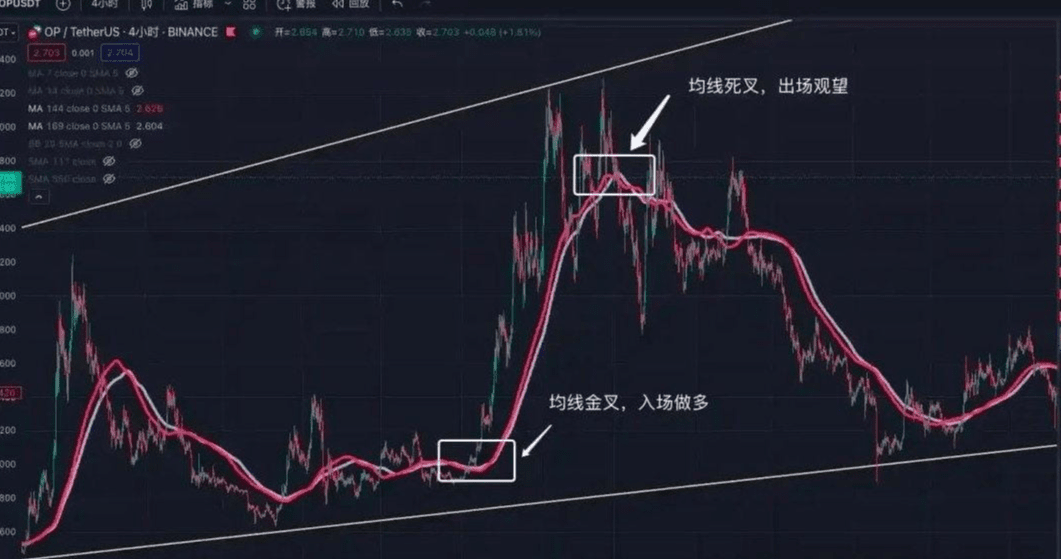
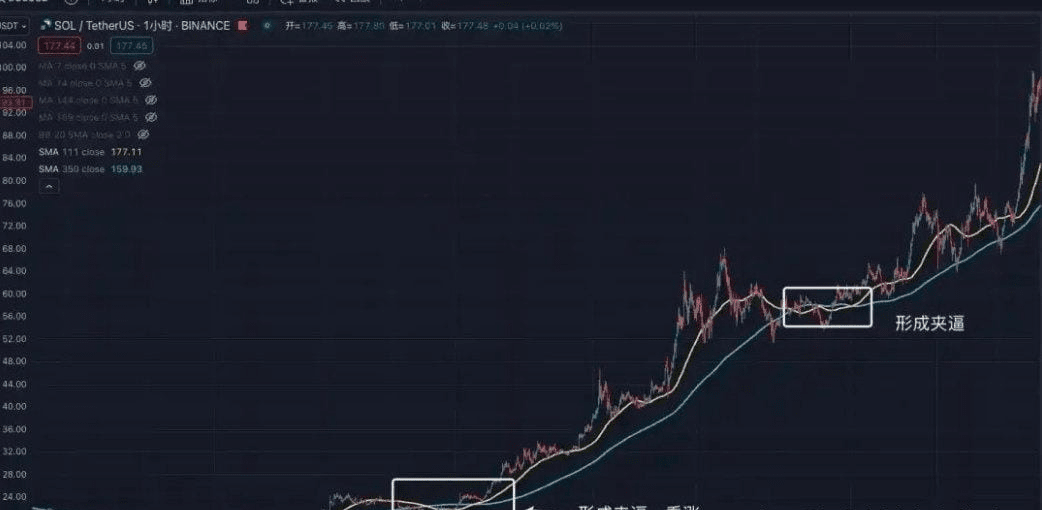
Using OP's four-hour trend as an example, we find that when the 144-day moving average crosses above the 169-day moving average, it forms a golden cross (the golden cross indicates that the 144 moving average crosses above the 169 moving average), which indicates a bullish view in the medium to long term. One can consider entering the market, while when the price peaks, the 144 moving average crosses below the 169 moving average, forming a death cross (the death cross indicates that the 144 moving average crosses below the 169 moving average), indicating a view to exit and observe in the medium to long term.
Some may ask, your statement is too absolute. How do you explain the frequent golden and death crosses of moving averages before horizontal trading? This is just gambling!
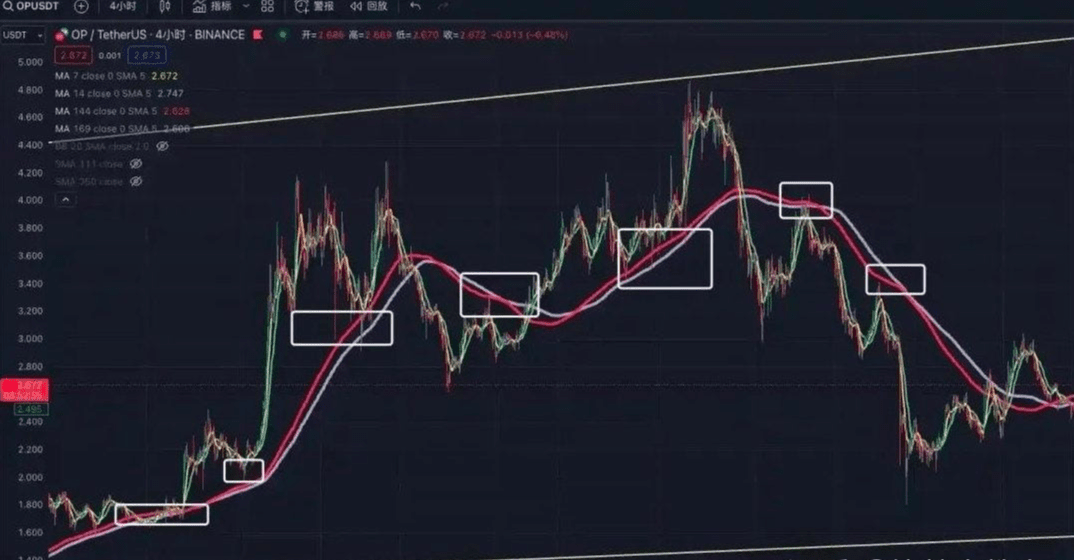
My advice is that since the 144 moving average and the 169 moving average cannot determine short-term trends and have a strong lagging nature, it is advisable to add 7 and 14-day moving averages to assist in judging short-term trends. Let’s further magnify the trend of OP, using high-level MA moving averages to assess medium to long-term market changes, and then using small-level MA moving average golden crosses for secondary confirmation to maximize certainty.
The Vegas Channel is used to judge medium to long-term trends. Due to the lagging nature of the Vegas Channel, it still needs to be paired with short-term moving averages for auxiliary verification. In a strong market, the 144 and 169 moving averages must rise. If the price ranges near the 144 and 169 moving averages, it indicates that the short-term market is relatively weak and is not suitable for entry. At the same time, the 144 and 169 moving averages have good support and pressure effects, suitable for ultra-short-term rebounds and other operations.
Squeeze Channel
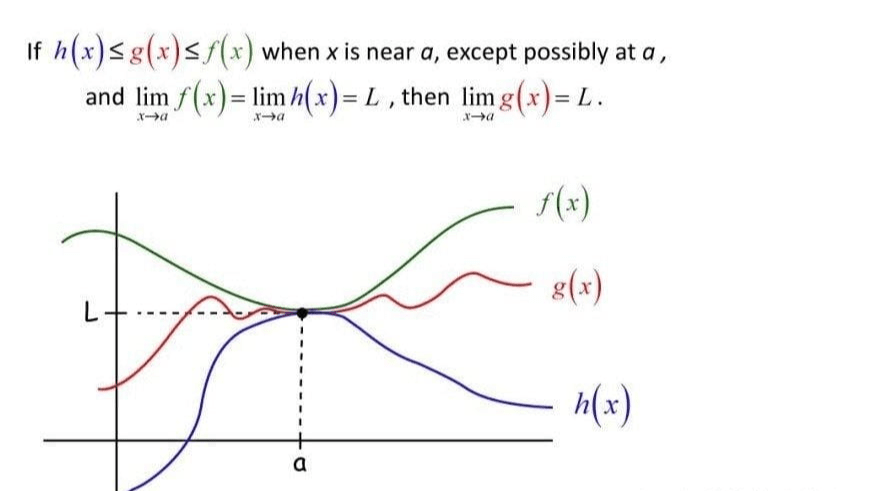
Squeeze Channel mainly comes from the Squeeze Theorem in mathematical calculus. Its simplified explanation is that if a function is 'squeezed' by two other functions near a certain point, and the limits of these two functions are the same, then the limit of this function will also tend toward the same value.
In secondary market trading, we can also use a similar squeeze theorem model. We can simplify it into two moving averages: 111 and 350. Due to the longer cycle of the 350 moving average, it is recommended for short-term trading.
Why these two moving averages?
350 divided by 111 gives us a number closest to pi, which is about 3.15, or we can say we divide 350 by 3.14, yielding the closest number, which is 111.
Example explanation:
Taking TRB's 1-hour trend as an example, when the blue line (350) moving average is on top and the yellow line (111) moving average is below, forming a shape similar to or approximating a triangle, it indicates that the 'squeeze' is successful. After success, the subsequent trend is bullish. However, it is essential to note that for a correct 'squeeze' formation, the 111 moving average must cross above the 350 moving average; if only one side crosses, it does not count.
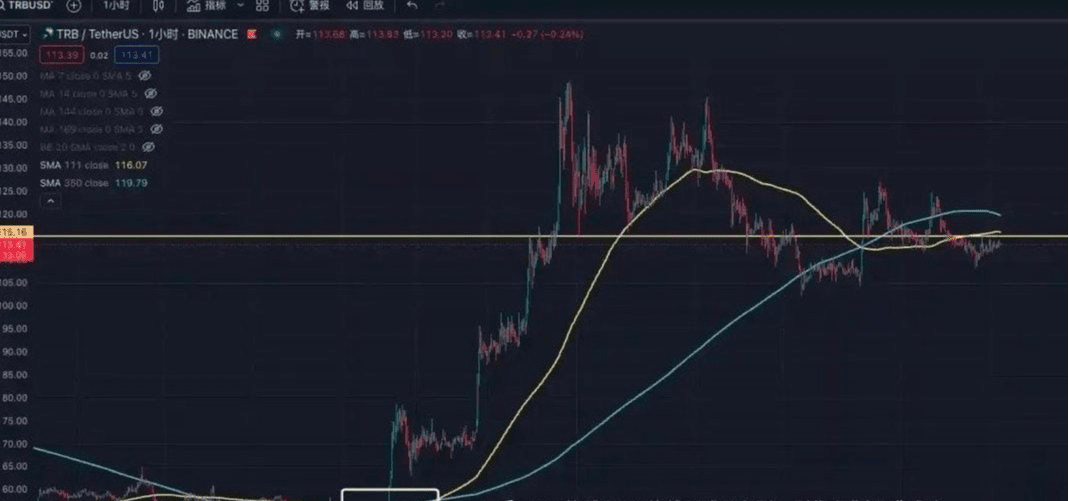
This channel is suitable for 1-hour and 4-hour levels, though the accuracy is generally average. However, once successful, the subsequent trend will be a large-scale market; thus, when a squeeze pattern appears, it is worth reinforcing attention and observation. We can also use other technical indicators for auxiliary judgment.
Advanced use of MACD and MA
In addition to the basic MACD and MA usage, just knowing these is far from enough. Ultimately, these technical indicators can be looked up in public materials, and many major players and manipulators intentionally create 'fake trends' to make you think it's too late if you don't buy. In reality, it's just a trick to get you on board.
How to prevent and identify these 'fake trends'?
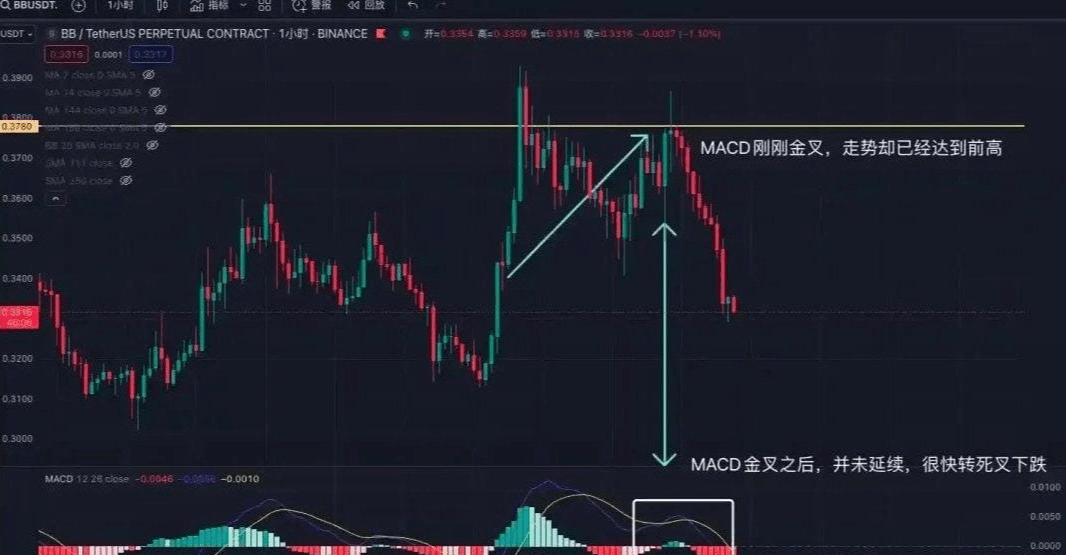
Fake trends mainly guide newcomers into the market through MACD golden crosses, using the 15-minute trend of BB as an example. When the 15-minute trend breaks through a new high, it quickly falls back. When MACD enters a death cross, it indicates that a pullback has begun. However, during the pullback, its trend is rapidly recovering, even approaching previous highs, but at this time, MACD has just begun the golden cross. We can understand this trend as 'having the heart but not the strength,' meaning the price has already rebounded to the previous highs while MACD has just started the golden cross. Over 80% of this trend will result in a situation like this; being tough for a while will end up soft.
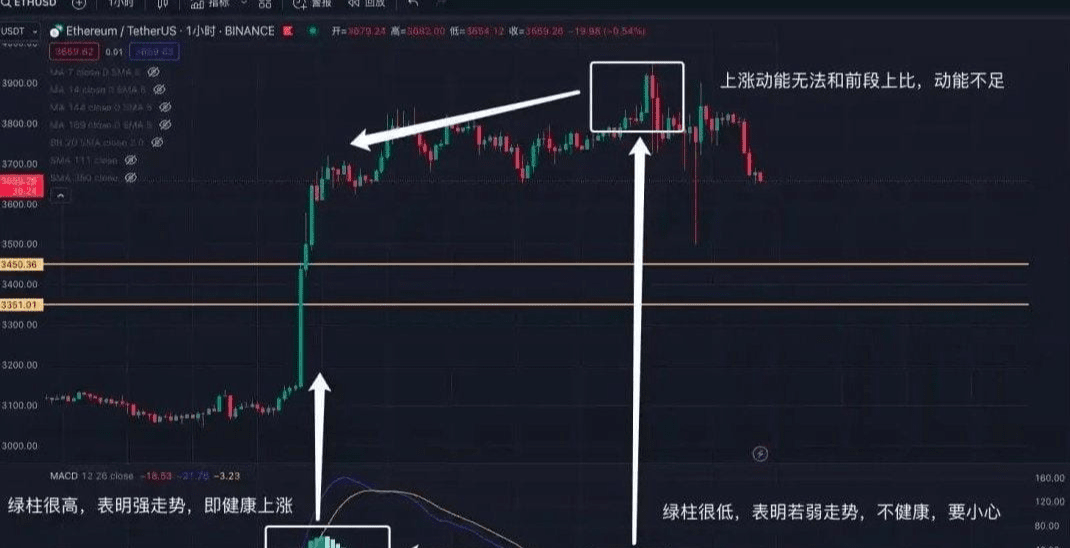
Next, we take the ETH 1-hour trend as an example. When MACD golden crosses and the green bars rise sharply, the price follows upward. This rise represents high-quality growth, indicating that you can enter. Then the price enters a horizontal adjustment phase, and MACD turns to a death cross. After adjustment, MACD enters a golden cross, but the growth and trend do not continue like the previous golden cross; instead, it lacks strength. The MACD volume bars are not in a sustained strengthening state. This 'hanging by a thread' state is very dangerous. Although MACD golden crosses, the strength is not strong, and the longer this sustained state lasts, the more dangerous it becomes. When the price breaks through a new high while MACD does not reach a new high, we call this 'top divergence,' which is a strong sell signal. Similarly, when the price breaks through a new low while MACD does not reach a new low, we call this 'bottom divergence,' which is also a buy signal.
Boll and RSI indicators.
BOLL (Bollinger Bands)
BOLL is a very simple and practical technical analysis indicator designed by American stock analyst John Bollinger based on the principle of standard deviation in statistics. I personally believe it is very useful in the secondary trading of blockchain.
BOLL consists of three lines: upper, middle, and lower. The upper, middle, and lower lines of Bollinger Bands have the meanings of resistance and support. When several reach the upper track of the Bollinger Band, there will be a pullback due to pressure. When reaching the lower track, it will rise due to support. When the stock price rises above the upper track of the Bollinger Band, it represents overbought conditions and the potential for a pullback; it also indicates that the stock is currently very strong. Conversely, when the stock price falls below the lower track of the Bollinger Band, it represents oversold conditions and indicates a very weak market. When the stock price drops from the upper track of the Bollinger Band to the middle track, the middle track acts as a support. If it breaks through the middle track, it becomes a resistance level. When the stock price rises from the lower track of the Bollinger Band to the middle track, it also faces pressure. Breaking through the middle track and stabilizing represents a transition from a resistance level to a support level.
Here are 10 golden basic rules for Bollinger Bands, very important:
1. Be cautious of pullbacks when prices break out of the upper track.
2. Be cautious of pullbacks when prices drop below the lower track.
3. Strong markets are always above the middle track.
4. Weak markets are always below the middle track.
5. The narrowing of the upper and lower tracks hides sudden changes.
6. The wider the opening, the greater the market momentum.
7. The middle track guides the trend direction.
8. A sudden narrowing of the channel indicates a reversal.
9. The channel suddenly opens up, and the consolidation is over.
10. The longer the narrowing of the channel, the smaller the opening, the more apparent and drastic the changes will be in the future.
Example explanation:
Taking the BTC 1-hour trend as an example, BOLL is mainly composed of three lines: upper track, middle track, and lower track. When the price exceeds the upper track, it indicates overbought conditions with a high probability of pullback. When the price drops below the lower track, it indicates oversold conditions with a high probability of recovery.
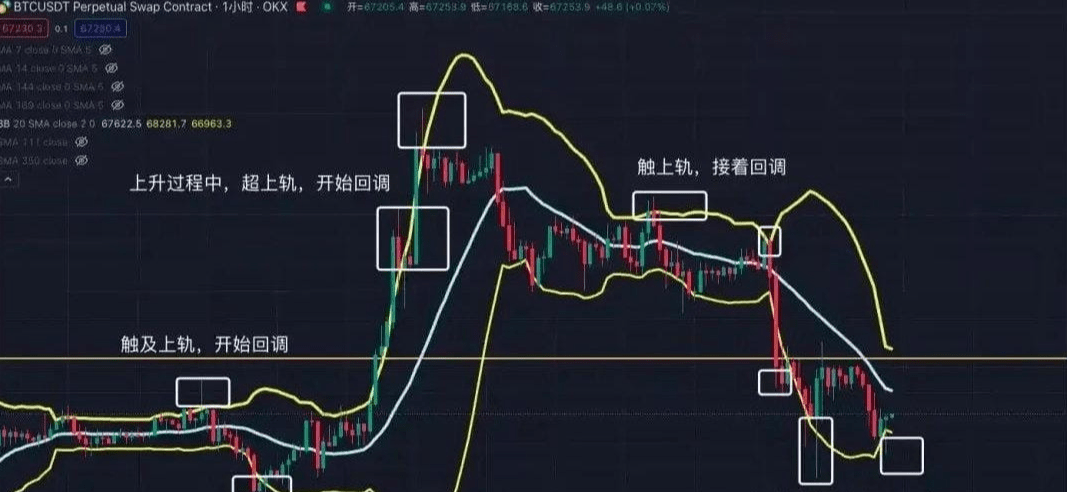
Next, we take the TRB 1-hour trend as an example. When the BOLL band narrows, it indicates that extreme market conditions will occur. However, BOLL cannot accurately determine the specific direction and needs other indicators to assist in judgment. The longer the narrowing time, the shorter the BOLL band indicates the future market will be more intense. At the same time, in a strong upward market, BOLL will gradually rise along the middle track, while in a super strong market, BOLL will continue to rise above the upper track. Conversely, in a weak market, BOLL will fall along the middle track, at which point the middle track transitions from a support position to a pressure position. In an ultra-weak market, BOLL will continue to fall below the lower track.
RSI (Relative Strength Index)
RSI (Relative Strength Index) works by calculating the magnitude of price changes to anticipate the strength of market trends and predict the continuation or reversal of trends. The RSI value fluctuates between 0–100, meaning that the price will never exceed this range. We can simplify it by understanding that when RSI reaches 70, it indicates an overbought condition, increasing the risk of a pullback, while when RSI drops below 30, it indicates an oversold condition, potentially leading to a rise.
Example explanation:
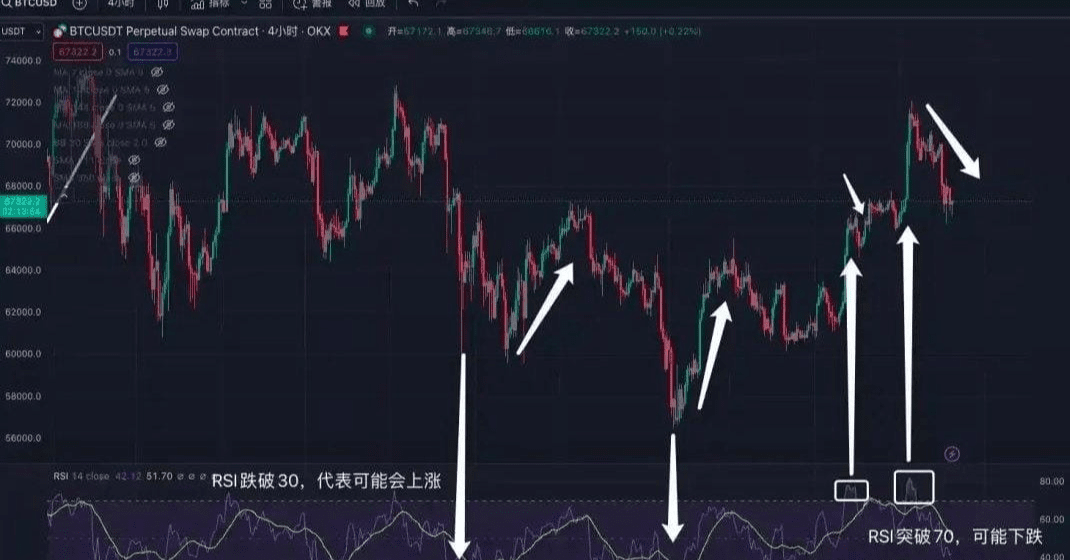
Taking the BTC 1-hour trend as an example, when RSI drops below 30 11, it indicates that a horizontal adjustment and pullback are needed. However, this pullback is not absolute; it merely indicates that the market is weak and cannot serve as a direct buying basis. Additionally, when RSI breaks above 70, it indicates overbought conditions and potential pullback risks. However, this still cannot serve as a buying and selling basis, only as auxiliary judgment. Note: In extreme market conditions, RSI can reach 99 or 1, so do not rely on RSI as the primary judgment basis.
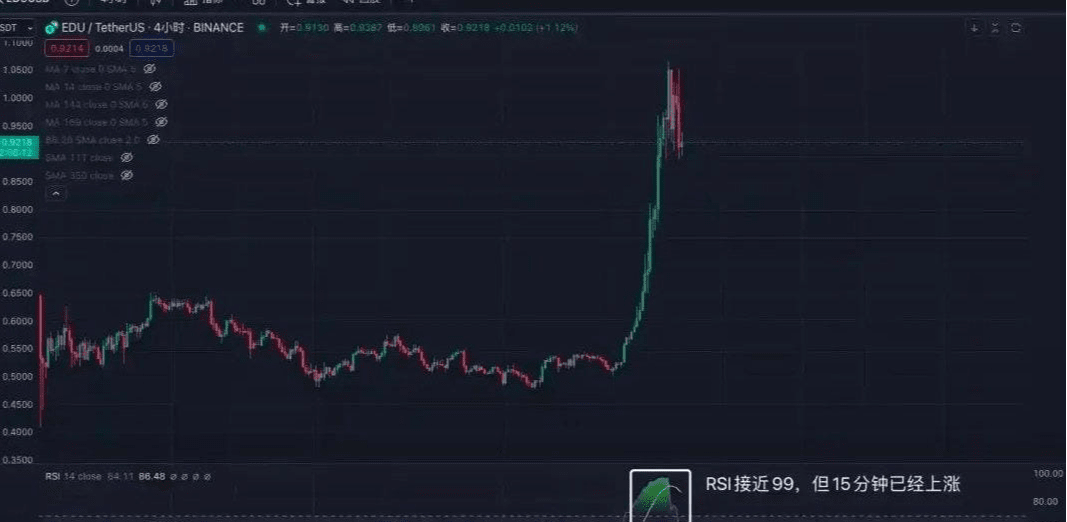
Next, we take the EDU 4-hour trend as an example. After RSI breaks 70, it continues to rise, ultimately reaching 99. Therefore, we cannot use the method of buying at 30 and selling at 70. We need to judge the nature of the stock/coin, whether it is low market cap, MEME type coins, or high-control coins. Compared to blue-chip coins, the RSI judgment for other small coins might need to be raised to the range of 90 and 10, rather than 30 and 70; this requires personal judgment.
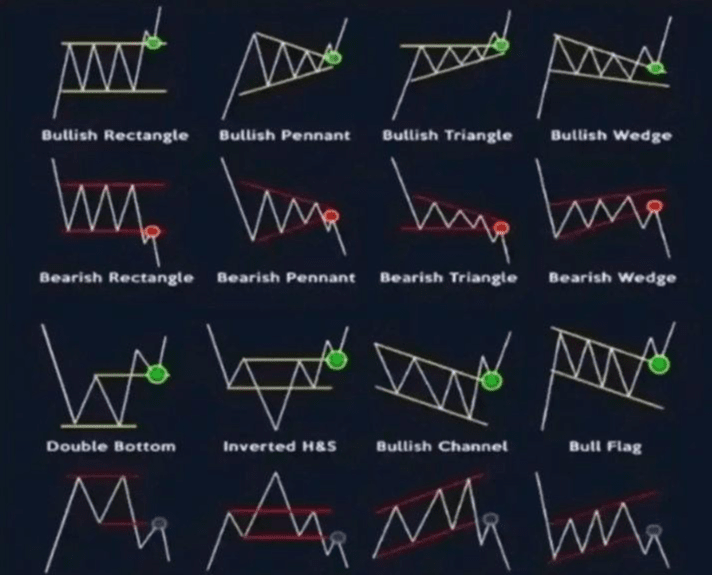
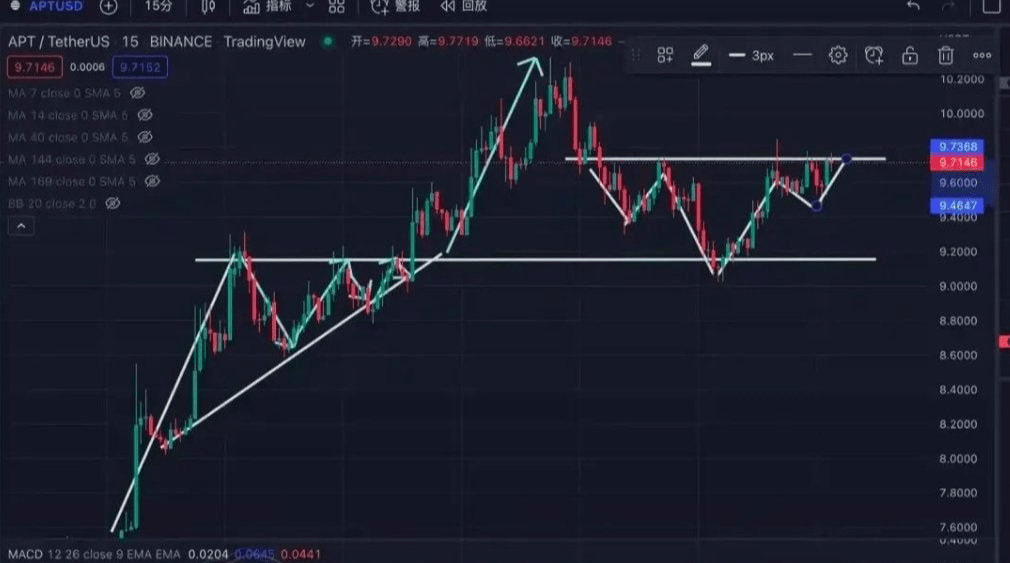
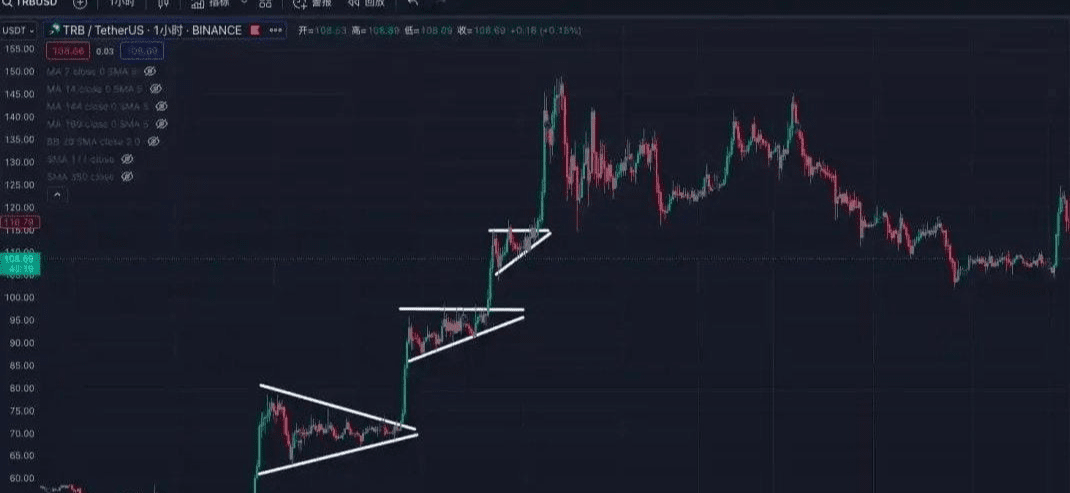
3. Flag pattern variations
Flag pattern consolidation is also called triangle consolidation. This consolidation is not judged by indicators but rather by the changes in the K-line trend. We can summarize it as 16 common basic change types. If you see a similar trend, you can buy; generally, the success rate is high, and the outlook is bullish, but failure can also occur. It is recommended to buy at the low point of the flag pattern, and when it breaks through the triangular area upwards, the breakthrough area becomes a support position, allowing intervention near the support in the future when the price drops.
Example explanation:
Taking the APT 15-minute trend as an example, its trend perfectly replicates the third and tenth patterns shown above. However, it is essential to note that this is merely a success case, as many major players and manipulators will deliberately create similar patterns to deceive you into entering the market. We need to be cautious in identifying and timely stop-loss.
Again, taking the TRB 1-hour trend as an example, we observe that TRB has indeed utilized the three-week flag pattern consolidation trend, achieving a threefold increase in a week. Therefore, when we see similar trends in the market, we can draw it out for verification.
Remember these 15 points when trading cryptocurrencies; they can help you avoid detours in the crypto world!
1. Luck and hesitation: Luck is the culprit of increased risk, and hesitation can lead to missed opportunities.
2. If long-term is gold and short-term is silver, then swing trading is diamond.
3. Never easily go all in at any time; this helps maintain a calm mindset and allows you to attack when needed and defend when necessary.
4. Eat fish in the middle segment, leave the head and tail for others.
5. Frequent operations will definitely lead to losing everything; hesitation leads to slow losses.
6. Trading mindset is paramount; strategy comes second, and technical aspects are only third.
7. The market arises in desperation, develops in hesitation, and ends in madness.
8. Greed is the eraser of profits; greed and fear are major taboos in investing.
9. Opportunities arise from declines; trading cryptocurrencies is about trading the future, cash is king.
10. Buying relies on confidence, holding relies on patience, and selling relies on determination.
11. There are no absolutely accurate indicators, only retail investors with partial understanding. Indicators are useful for those who know how to use them and harmful for those who do not.
12. Not cutting losses in trading cryptocurrencies will absolutely lead to significant losses.
13. When others are fearful, we should be greedy; when others are greedy, we should be fearful.
14. Newcomers look at price, veterans look at volume, and experts look at momentum.
15. Preserve the principal, control risks, earn profits, and maintain long-term stable profitability.
This is the trading experience that the instructor shares with everyone today. Many times, you lose many opportunities to make money due to your doubts. If you don’t dare to try boldly, to engage, to understand, how will you know the pros and cons? You only know how to take the next step after you have taken the first step. A warm cup of tea and a word of advice; I am not only a teacher but also a friend you can talk to.
Acquaintance is fate, knowing each other is a connection. The instructor firmly believes that fate will eventually bring people together, while a lack of connection is destiny. The journey of investment is very long; temporary gains and losses are just the tip of the iceberg. Remember that even wise people can make mistakes, and foolish people can have gains. Regardless of emotions, time will not stop for you. Pick up your worries and stand up again to move forward.
I am Old Chen, having experienced multiple bull and bear cycles, with rich market experience in various financial fields. Follow me, Old Chen, to penetrate the fog of information and discover the real market. More opportunities to grasp the wealth password, discover truly valuable opportunities, and don’t miss out and regret!
Teaching a person to fish is better than giving them fish. Cryptocurrency investors, whether novice or expert, gain not only financial returns from following the instructor but also growth in investment knowledge and experience. In the process of investing with Old Chen, the instructor will not only provide analysis ideas for the market, basic knowledge of watching the market, and usage methods for various investment tools, but will also bring exciting fundamental interpretations, sorting out chaotic international situations, and distinguishing various investment forces. Let you become a winner and an expert in investing!
In the cryptocurrency market, mastering the seven great trading strategies is essential to understand the nuances of investment, allowing you to be safe in the wind while turning dangers into safety. Old Chen has traversed the market for many years, well aware of the opportunities and traps within. If your investments are not going well and you feel reluctant about your losses, you can contact Old Chen, and I will correct your past. If you are currently profitable, I will teach you how to preserve your profits. If you are still lost in the market, the instructor is willing to guide you forward. The real tragedy in trading is not how much suffering you endure but how many opportunities you miss! Seize the present, and let’s move forward together. I am Old Chen, someone who wants to leave a name in the cryptocurrency world.

