This is not a 'feel-good' piece or a 'theoretical tutorial', but rather a rolling position strategy that I tested over the past 3 months with 10 accounts, with a maximum monthly return of 2100%
But the liquidation rate exceeds 80%.
If you just want to follow blindly, you can close the page now;
But if you are willing to strictly follow the strategy, you might become one of the 20% survivors.
Core logic: The 'compound interest bomb' of rolling positions
The essence of rolling positions is not 'always increasing positions', but 'increasing positions when profitable and cutting losses when losing', using the compound interest effect to let profits run.
But 90% of people fall into these 3 pitfalls:
1. Do not dare to increase positions when profitable (missed explosive market)
2. Stubborn loss (leading to final liquidation)
3. Wrong selection of targets (poor liquidity, spikes)
The core of my strategy: "3x leverage + dynamic profit-taking + hedge protection," prevents profit reversal while allowing you to benefit from trend movements.
Target selection: BTC/ETH exchange rate hedge (stable volatility, not easy to spike)
Opening strategy:
When BTC pulls back to a key support level (such as 60,000), open a 3x long position
After the first profit of 20% (200U), roll 50% of the profits into the next trade
Stop loss: Immediately close positions if the previous low is broken (keep losses within 10%)
Key details:
Only operate between 1-3 AM Beijing time (best liquidity, less control by market makers)
Use limit orders + take profit and stop loss to avoid slippage
Stage 2: 3000U→8000U (10-12 days)
Target upgrade: High volatility altcoins (such as SOL, ORDI)
Rolling position techniques:
Wait for a breakthrough of key resistance levels, then chase with 3x leverage
After a profit of 30%, take partial profits, and set a trailing stop for the remaining position
If you incur two consecutive losses, stop trading for the day
Risk control:
Absolutely avoid low liquidity altcoins (easy to be harvested)
After each trade, withdraw 10% of the profits to a cold wallet (to prevent emotional trading)
Stage 3: 8000U→20000U (final sprint)
Ultimate strategy: Contract + Spot combination
70% of funds are used for BTC/ETH trend positions (5x leverage, capturing large waves)
30% of funds should be allocated to low market cap high potential coins (such as certain exchange IEO coins, specific details can be discussed privately)
Set automatic profit-taking (lock in partial profits every 10% increase)
Final defense line:
When total funds reach 15,000U**, withdraw the principal and only use profits for speculation
If extreme market conditions occur, immediately switch to stablecoin arbitrage (annualized 20%+, for safety)
Why do 90% of people fail?
1. Emotional loss of control (profit expansion, stubborn loss)
2. Leverage abuse (blindly opening 10x, 20x)
3. Ignoring the time window (missing the best trading period)
My solution:
Use quantitative trading robots to execute automatically (avoiding manual operation errors)
Set a strict stop-loss discipline (stop trading if the daily loss exceeds 10%)
Regularly withdraw profits (to prevent "paper wealth")
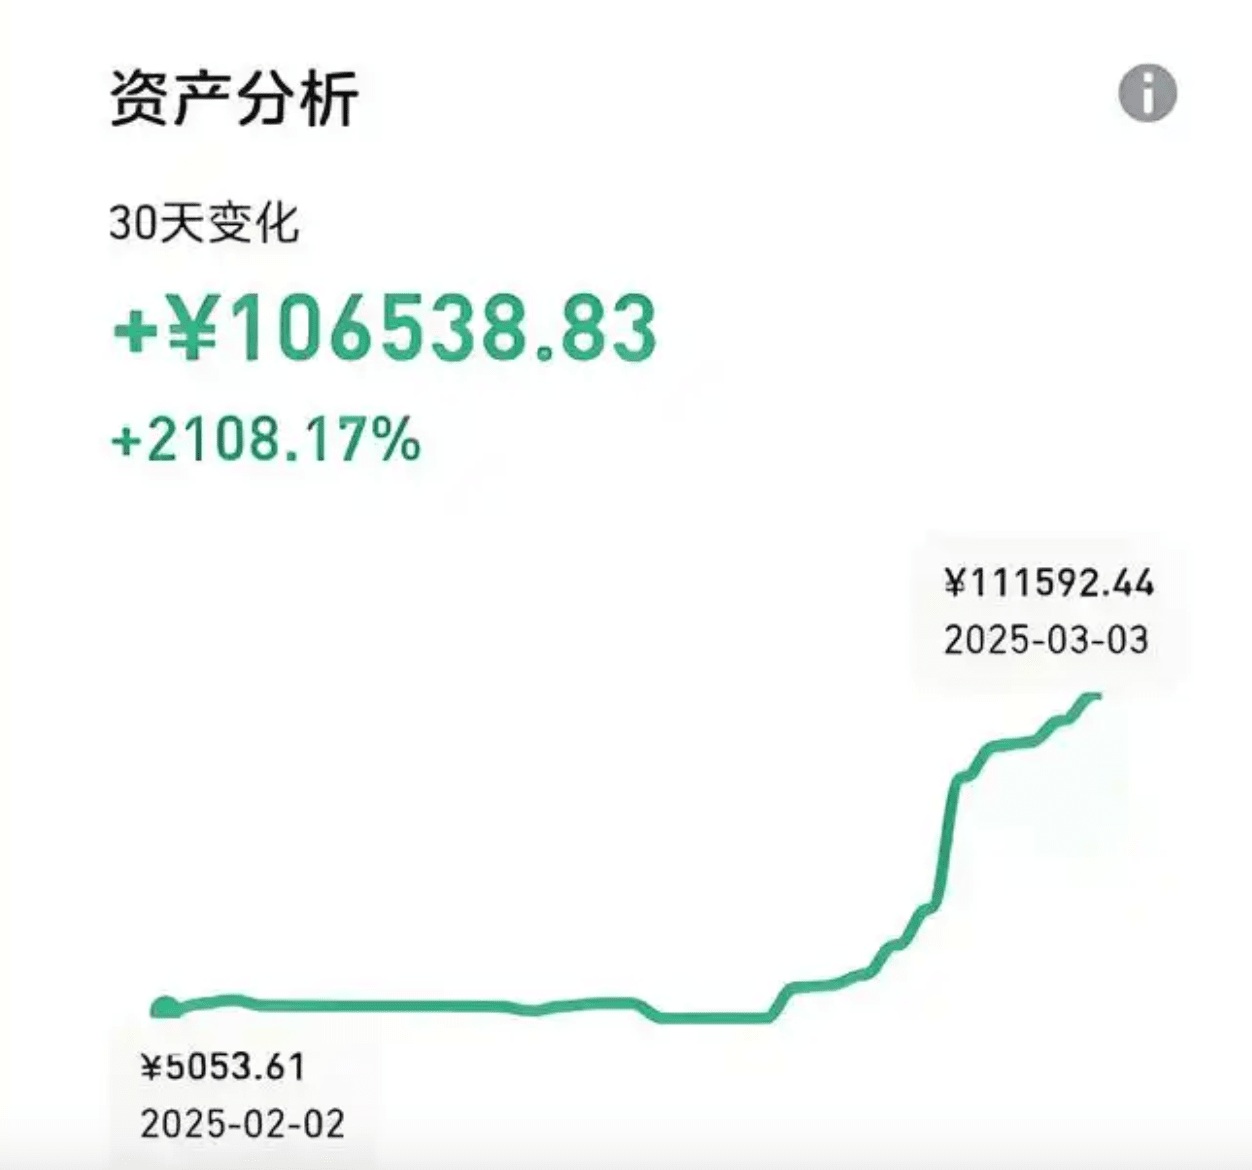
This method is also one that I have personally tested: from February to March 2025, in one month, I made 100,000 from 5,000! The profit rate reached 2108.17%!
The leverage used in cryptocurrency contracts depends on the following conditions:
1. Your risk preference
2. The cryptocurrency contract opened
3. The size of the contract's funds
4. Are you doing simple interest or compound interest?
5. Determine the size of the market.
Next, we will introduce two position management methods!
1. Left-sided position management
1) Do not shoot all your bullets at once; buy in batches!!!
2) You can divide funds into several parts. When you are not sure about the bottom, buying in batches is the most suitable method to average the cost price!!!
(3) The bottom for averaging should be handled flexibly according to market conditions. Do not add positions too frequently, as it will negatively affect the averaging of coin prices. Entering 20%, 30%, 50% is suitable for aggressive investors who are keen on bottom fishing!!!
(4) Initial entry capital is relatively small, and if the coin price does not rise but continues to fall, gradually increase the position, and the proportion of increment becomes larger, thus averaging the cost. This method has a lower initial risk, and the higher the funnel, the more substantial the profit!!
2. Right-sided position management
(1) Buy 1: When the 5-day moving average crosses above the 10-day moving average, add 30% to the position!!
(2) Buy 2: When the coin price effectively breaks the life line, continue to add 30% to the position when pulling back to the life line, ensuring that the total position reaches 60% at the beginning of the upward trend!
(3) Buy 3: After breaking the neck line or other important resistance levels, if it shows a pullback and stabilizes again, it indicates that the reversal upward shape has been established, add 20% to the position. The total position should reach 80%, holding the coins and waiting for the rise!!
(4) Buy 4: When the coin price appears above the life line and the 5-day and 10-day moving averages form a golden cross again, it is a typical signal for accelerating upward; at this time, the remaining 20% of the position should also be bought in time to maximize profits!!!
A "foolproof" method for trading cryptocurrencies that is simple and practical, even new investors can easily operate with an accuracy rate of over 80%. Both buying and selling in the cryptocurrency market can follow this method!
1. The selected coin must be in an upward trend; of course, those in a consolidation phase are also acceptable, but those in a downward trend or with the moving average opening downwards must not be selected.
2. Divide the funds into three equal parts. When the coin price breaks above the 5-day moving average, lightly buy 30% of the funds. When the coin price breaks above the 15-day moving average, buy another 30%. Similarly, when the 30-day moving average is broken, buy the last 30%. This requirement must be strictly enforced.
3. If the coin price does not continue to break above the 15-day moving average after breaking above the 5-day moving average, but instead shows a pullback, as long as the pullback does not break the 5-day line, keep the original position; if it breaks, sell.
4. Similarly, if the coin price breaks above the 15-day moving average but does not continue to break higher, if it pulls back without breaking the 15-day moving average, continue holding; if it breaks, first sell 30%, and if it does not break the 5-day moving average, hold the 30% position at the 5-day moving average.
5. When the coin price continues to break above the 30-day moving average and shows a pullback, sell all at once as before.
6. Selling is the opposite; when the coin price is at a high, if it breaks below the 5-day line, first sell 30%, and if it does not continue to drop, hold the remaining 60% position. If the 5-day, 15-day, and 30-day lines are all broken, sell everything without holding on to false hopes.
A trading system is a weapon that allows you to achieve stable profits.
It can help you mark key levels, discover entry signals, and find trading opportunities that can make you money.
So, to put it another way, as long as there is a stable trading system, one can act on opportunities within the system; if losses occur, it’s acceptable to retaliate, do what you should do, and leave the rest to the market. Ultimately, profits will always cover losses.
However, 99% of people’s biggest problem is not having their own trading system, so they fear losing money while trading because once that money is lost, it cannot be earned back. Even if they rely on luck to earn it back, they will ultimately lose it all through their own efforts.
There is a dumb way to trade cryptocurrencies that allows you to keep making money forever, with 30 million! This method achieves an 80% win rate! The top 10 chart patterns that must be known when trading cryptocurrencies can accurately predict market trends. Once you learn to master it, the cryptocurrency market will be your ATM.
Chart patterns are one of the most effective trading tools for traders.
They purely reflect price behavior, formed naturally by the buying and selling pressures of both sides. Chart patterns have a reliable track record, commonly used by traders to identify trend continuation or reversal signals, to open positions and predict price targets.
Chart patterns refer to specific price shapes on the chart that can predict future price movements.
Since technical analysis is based on the fundamental assumption that "history repeats itself," these classic patterns often verify high-probability rules corresponding to specific price patterns after repeated occurrences.
Therefore, chart patterns can be divided into:
(1) Continuation pattern - indicates that the existing trend will continue;
(2) Reversal pattern - indicates that the trend is about to reverse.
This article will showcase the top ten classic chart patterns every trader must know. The first part will detail reversal patterns and their application methods.
Reversal patterns (part 1)
Head and shoulders pattern
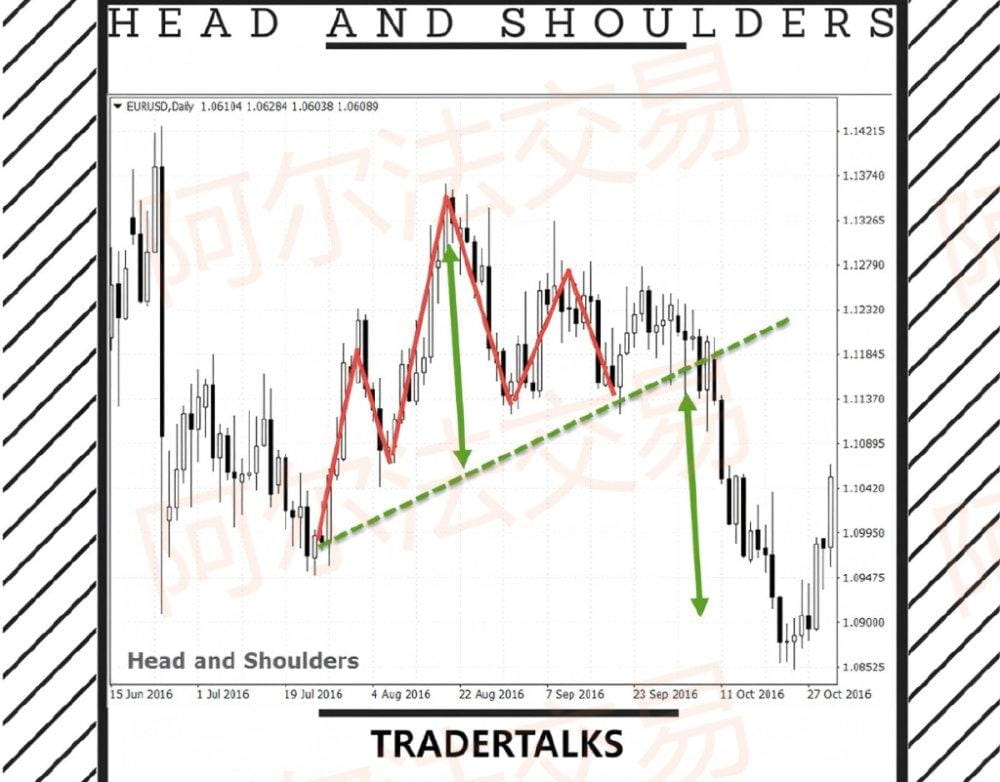
The head and shoulders pattern is a classic chart pattern that indicates that the current trend is about to reverse.
This pattern consists of three peaks (high points), with the middle peak (head) being the highest (marked by the red line in the chart).
When a secondary peak appears after the middle peak, it indicates that the bulls can no longer push the price higher. The shape looks similar to the head contour with left and right shoulders, hence the name.
The line connecting the low points of the two shoulders is called the neck line.
Important note: When the price breaks down the neck line, it is a selling signal, and the target price is the vertical distance from the head peak to the neck line (marked with a green arrow).
If the head and shoulders pattern appears in a downward trend, it is called the inverted head and shoulders pattern (consisting of three troughs).
Double top and double bottom
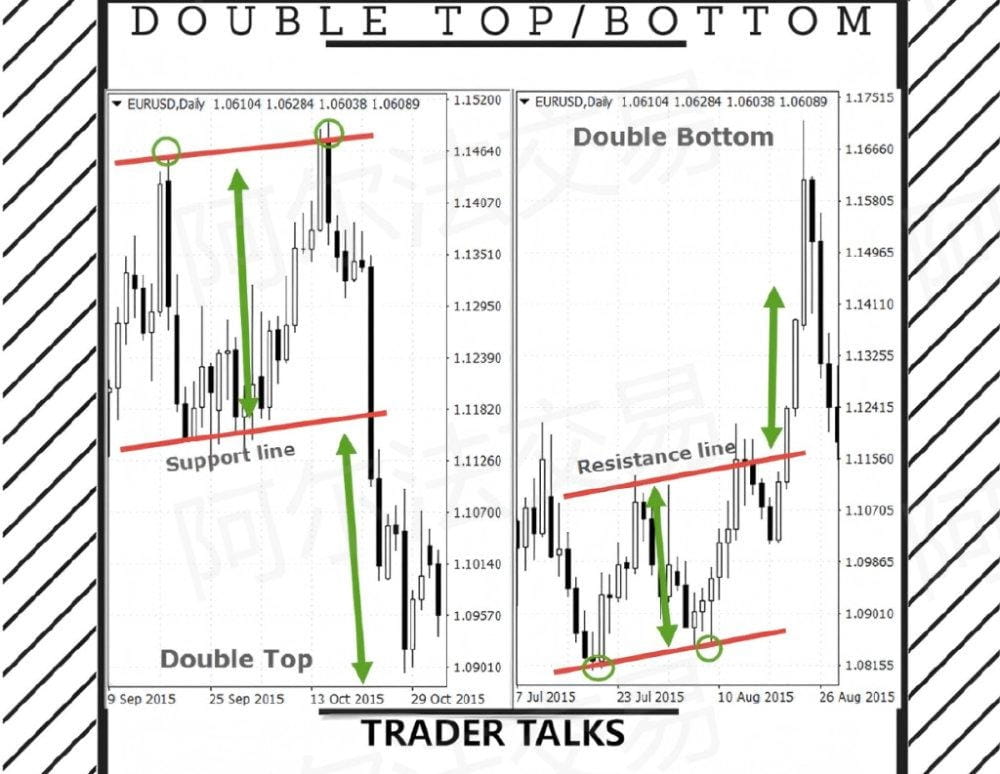
As another type of reversal pattern, double tops and double bottoms appear in upward and downward trends, respectively.
As the name suggests, a double top consists of two peaks that are close in height (or slightly different). This indicates that the bulls failed to break through the previous high, and the trend may reverse.
Important note: When the price breaks below the support line of the pattern, a sell signal is triggered, and the target price is the vertical distance from the peak to the support line.
The double bottom pattern is the opposite, consisting of two troughs. It shows that the bears cannot continue to lower the price. Buy when the price breaks through the resistance line, and the target price is the vertical distance from the trough to the resistance line.
Triple tops and triple bottoms
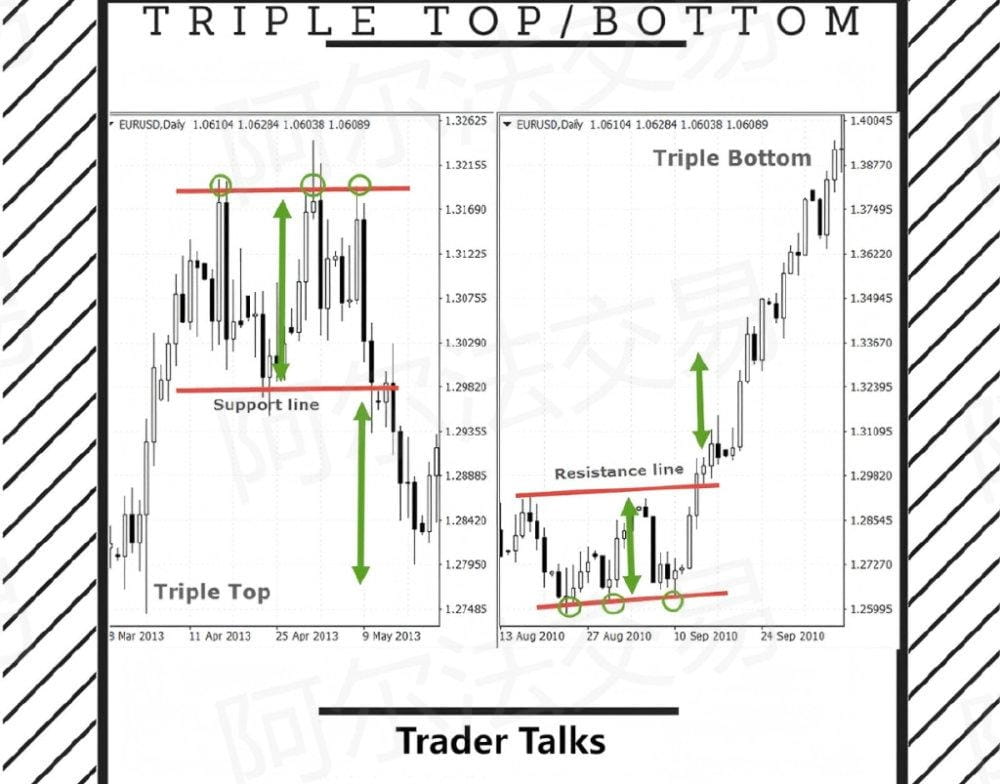
Triple Top and Triple Bottom patterns are essentially extensions of the double top and double bottom patterns. Both belong to reversal patterns, with the difference that triple tops/bottoms contain three peaks and troughs, respectively.
Important note: The triggering signal is also the breakthrough of the support/resistance line. The target price calculation method is: triple top is the vertical distance from the peak to the support line; triple bottom is the vertical distance from the trough to the resistance line.
Rounding top
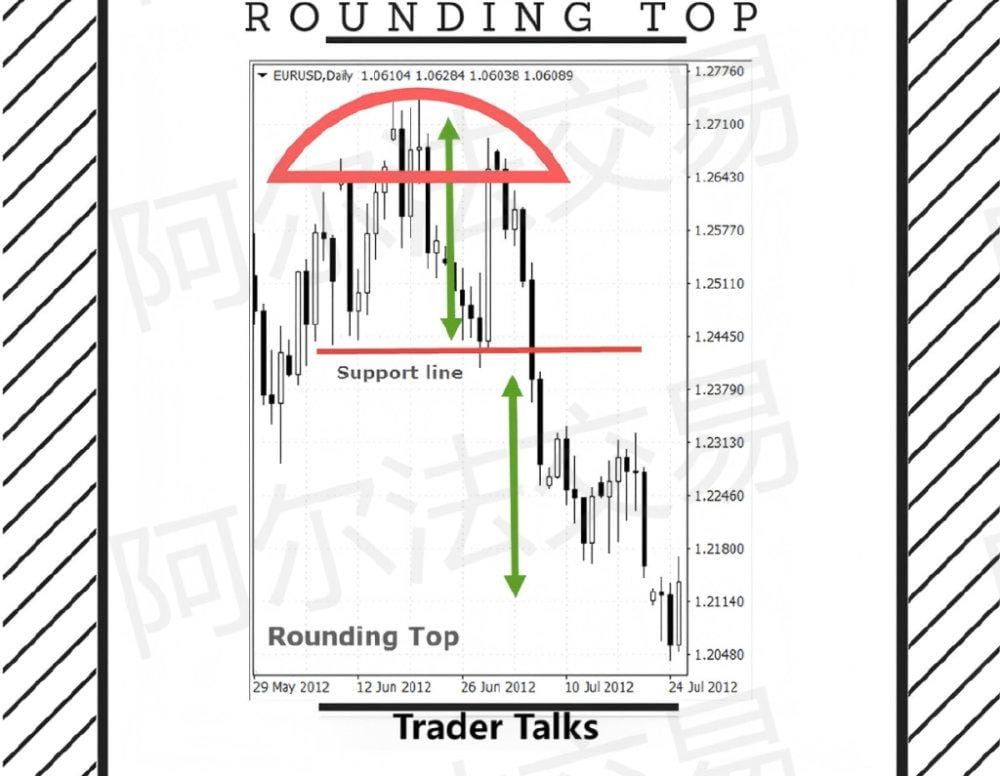
The rounding top pattern has a longer formation cycle than other patterns in this article. It reflects the gradual shift of market sentiment from a bull market to a bear market. As shown in the chart, the price gradually builds a "round top" outline.
Important note: When the price breaks below the support line, a short signal is triggered, and the target price is the vertical distance from the top to the support line.
Round bottom
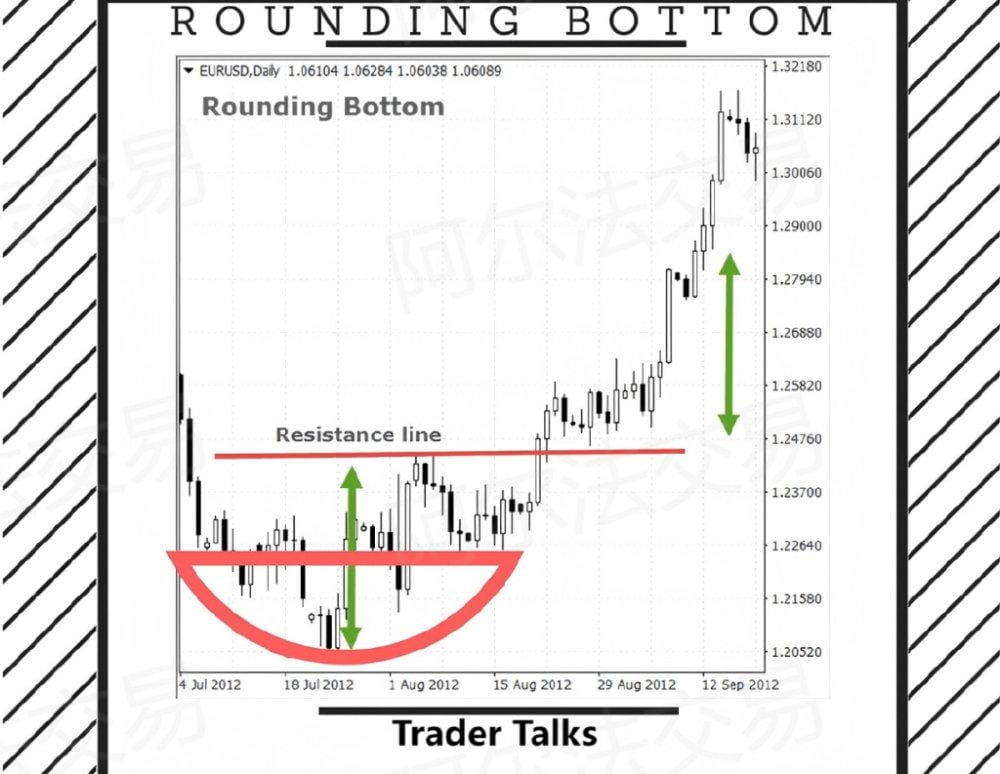
Rounding bottom is the mirror image of the rounding top. The price completes the gradual reversal of the downward trend through the "round bottom" structure.
Important note: The trading signal is the same as the rounding top - triggered by breaking the resistance line, the target price is the vertical distance from the bottom to the resistance line.
Continuation pattern (next part)
This article will reveal the most classic continuation patterns. Continuation patterns are equally important as reversal patterns and are more suitable for trend-following trading strategies. If reversal patterns are suitable for contrarian traders and swing traders, continuation patterns can provide excellent entry points for trend traders. The following shapes will open a new perspective on trading for you.
Rectangle pattern
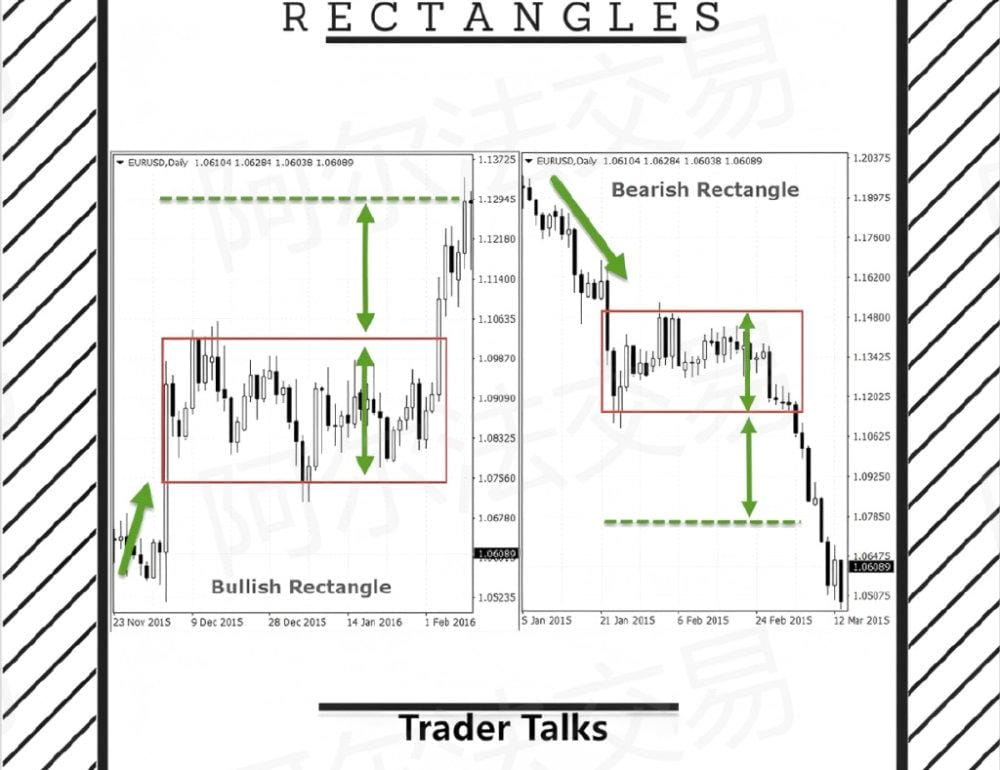
Rectangles belong to continuation patterns, confirming that the current trend will continue. According to the trend direction, they can be divided into bullish rectangles and bearish rectangles.
Bullish rectangles appear in an upward trend, forming when the price enters a sideways consolidation phase, and are likely to break through in the original trend direction.
Important note: When the price breaks above the upper track of the rectangle, a buy signal is triggered, and the target price is the height of the rectangle.
Bearish rectangles, conversely, form during the consolidation phase in a downward trend, indicating that the price will eventually break below the rectangle's lower track, with the target price amplitude also taken from the rectangle's height.
Wedge pattern
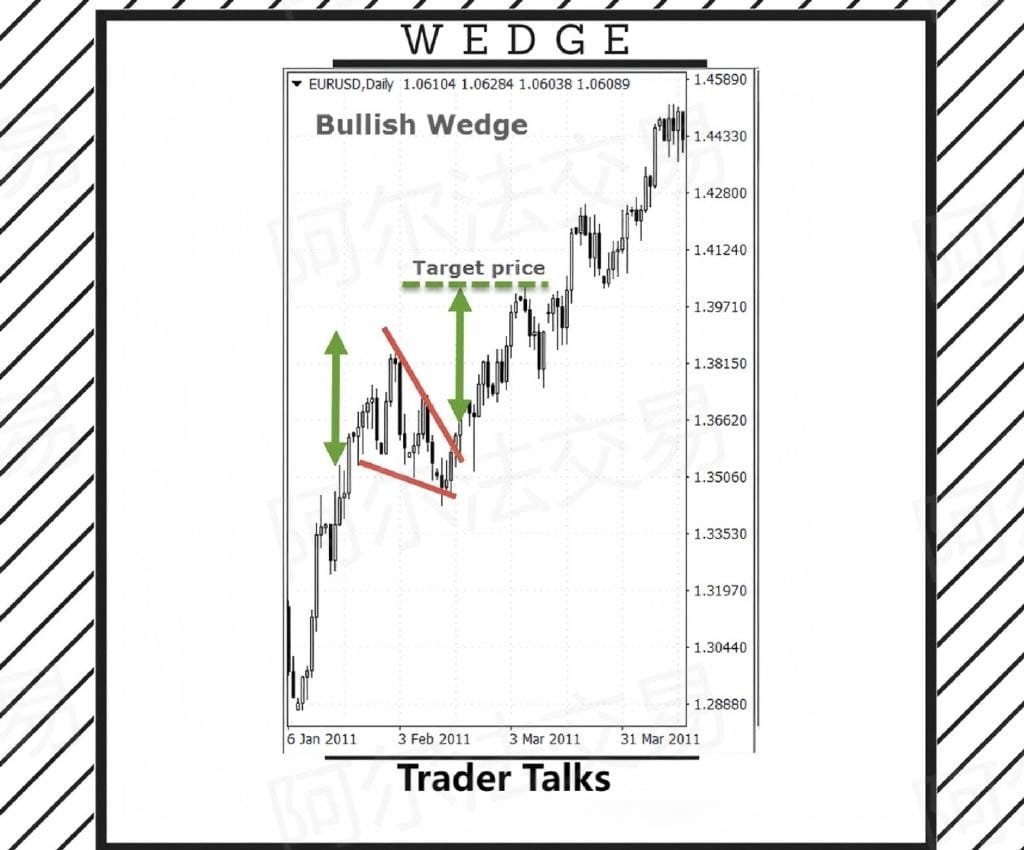
Wedges are another typical continuation pattern.
Bullish wedges appear in an upward trend, with prices running within converging trend lines. This converging pattern indicates that the bears are trying to suppress prices but cannot overcome the bulls' strength. Ultimately, the price breaks above the upper trend line, signaling the continuation of the upward trend.
Important note: The target amplitude is taken from the maximum vertical height of the wedge, projected the same distance from the breakout point.
Bearish wedges and bullish wedges have the same principle, but they appear in a downward trend, with an overall upward slope. Converging trend lines show that the bulls briefly interrupted the downward trend; when the price breaks the lower track, it indicates that the bears regain control. The target amplitude is also projected from the maximum height of the wedge.
Flag pattern
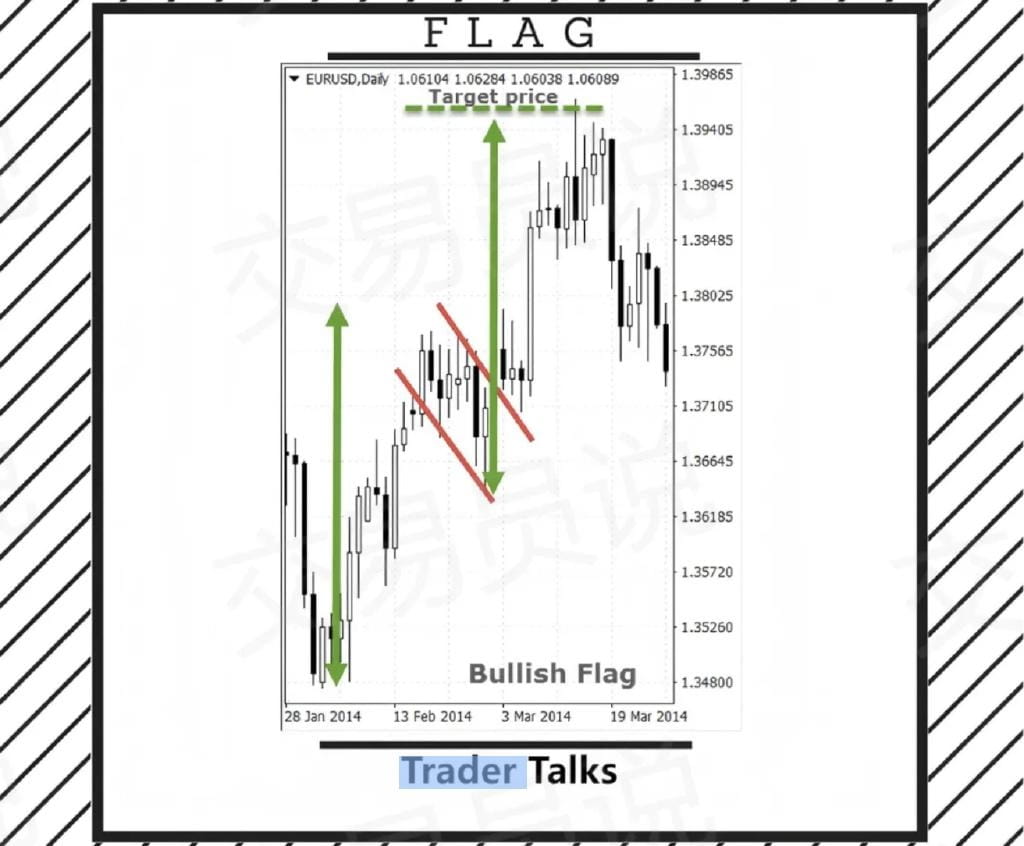
Flags are similar to wedges, but consist of parallel (rather than converging) trend lines, and include a characteristic flagpole structure. The target price calculation method is unique and different from other chart patterns.
Flags can be bullish or bearish; the image above shows a bullish flag.
In an upward trend, bullish flags will form, with parallel trend lines above and below the price trend, creating a descending slope.
Important note: Breaking the above trend confirms that the upward trend is recovering.
Bearish flags and bullish flags are basically the same, with the difference that bearish flags form in a downward trend and exhibit an upward trend.
The target amplitude calculation method: take the vertical height of the flagpole (green arrow) and project it from the end of the flag (taking the lowest point for bullish flags and the highest point for bearish flags).
Triangle pattern
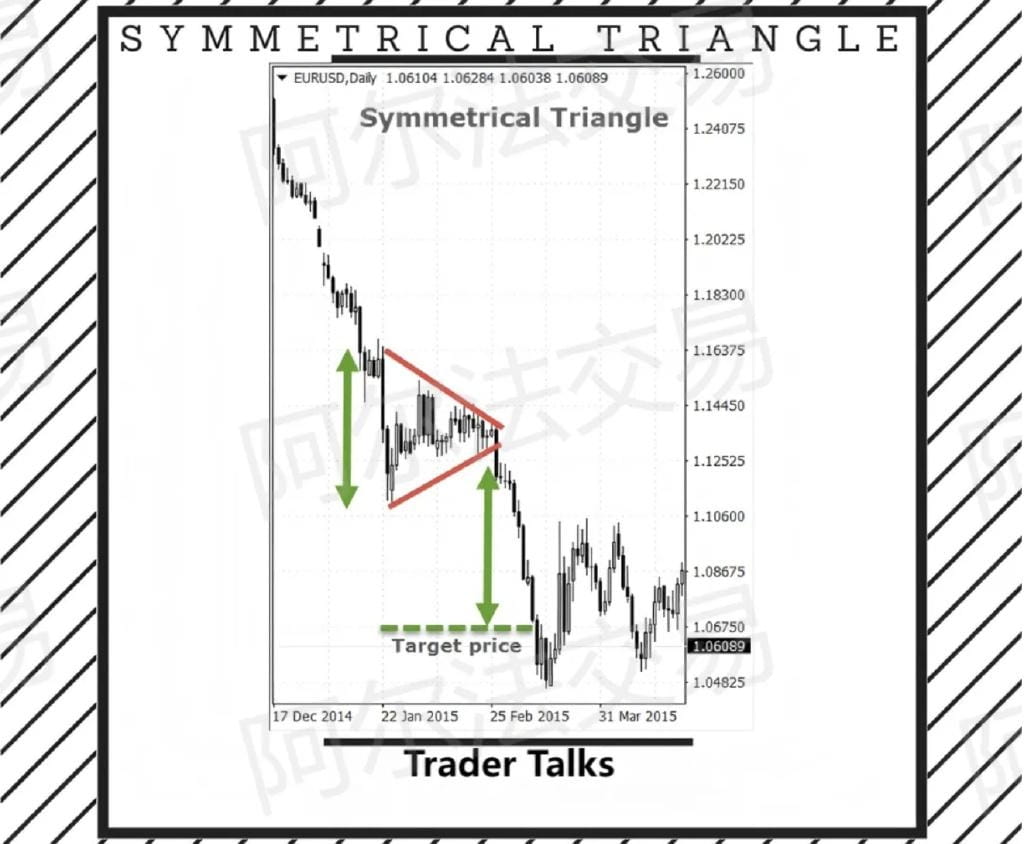
Triangles are classified into ascending triangles, descending triangles, and symmetric triangles.
These three types of triangles look very similar, with the difference that the ascending triangle has a flat upper trend line, while the descending triangle has a flat lower trend line.
The symmetric triangle is the most common shape, just like the wedge shape, but neither the slope points upwards nor downwards, with no clear slope tendency.
Important note: In a downward trend, breaking the lower trend line indicates the continuation of the downward trend; while in an upward trend, breaking the upper trend line confirms the original upward trend.
The target price equals the maximum height of the triangle, projected outward from the breakout point.
Cup and handle pattern
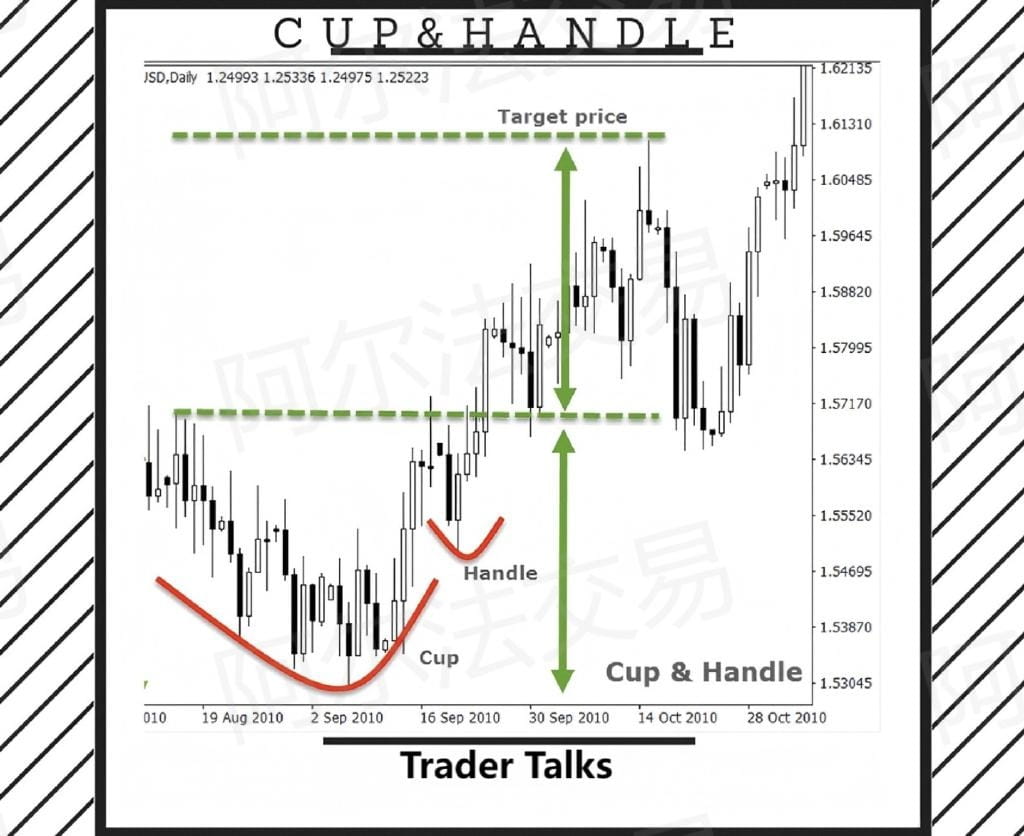
Cup and handle pattern is a rounding top pattern characterized by an additional pullback (the "handle" part) following the rounding top. It is a continuation pattern indicating that in an upward trend, sellers are trying to push the price down, but market sentiment gradually shifts from sellers to buyers.
In addition, a pullback (the formation of the handle) is the last attempt by sellers to take control of the market. After the price breaks through the resistance line (green dashed line), the target price calculation method is the height of the cup and handle pattern.
Inverse Cup and Handle pattern typically appears in a downward trend, with rules opposite to those of the regular cup and handle pattern.
Summary
The main purpose of this article is to show you another perspective on trading. As you can see, these chart patterns may help in judging the trend direction, but you should not rely solely on them.
In this article, we introduced 10 main chart patterns that every trader should understand. We believe these are the most important, but if you think I missed any key patterns, please share them in the comments section.
Again, it is emphasized that, as mentioned in our previous articles, no trading method can be blindly copied. No single indicator is万能的 (universal), and no trading system can maintain success under inappropriate operations. You need to find the method that suits you and stick to it.
I am Ah Peng, after experiencing multiple bull and bear markets, I have rich market experience in various financial fields. Here, I penetrate the fog of information to discover the real market. Seize more opportunities for wealth and discover truly valuable opportunities, don't miss out and regret later!
Ah Peng only does real trading; the team still has positions available, so hurry up #加密市场回调 $BTC$ETH


