Just how patient are top cryptocurrency traders? My mentor, when I first started trading, spent 80% of his time waiting and 20% trading. Now he lives a comfortable life, fishing, playing golf, and catching a few market waves a year.
I still clearly remember his sigh that day: Life is sometimes so wonderful. You can't get it when you try your best, but you get results after you really let go.
My mentor was also an old investor in the past. He was very familiar with chasing rising and falling prices. After his account suffered a heavy blow, he temporarily withdrew from the cryptocurrency circle. When he was old and had free time, he picked it up again. Unexpectedly, there was a turnaround in his life. I have summarized some of the sixteen key factors and would like to share them with you.
1. Choose altcoins in a bull market and buy BTC in a bear market. This is my secret!
2. Pay special attention to the coins with large volume at the bottom. This is a start signal, don’t miss it!
3. For upward trending coins, when they pull back to important moving averages, it is the best time to buy. Remember to seize the opportunity!
4. Don’t trade frequently. It is enough to get the big trends right a few times a year. Greed will lead to big losses!
5. You must control your position well. Never go all in and leave yourself room so that you can cope with market changes!
6. If you are losing money on junk coins, don’t add to your position. It is wise to stop the loss in time and don’t let yourself get deeper and deeper into trouble!
7. The news can only be used as a reference. Don’t blindly follow the trend, otherwise you will bear the consequences at your own risk!
8. Never touch coins that you are not familiar with. Focus on the track that you are familiar with, so that you can be sure of winning!
9. Don’t be swayed by market sentiment. Stay calm and rational so that you can make the right decisions!
10. If altcoins rise too much, they will definitely fall; if they fall too much, they may not necessarily rise. Choice is very important, so you must keep your eyes open!
11. When most people are optimistic, that is often when risks come. Remember this and don’t let yourself become the one taking the blame!
12. Learn to hold empty positions and wait for the market to give clear signals before entering the market. This will help you avoid unnecessary losses!
13. Don’t follow the hype about hot topics. Hot topics often come and go quickly. Don’t let yourself get trapped!
14. When trading, you must have your own trading system and strictly implement it to maintain stable profits!
15. Investing is a long-distance race. Only by maintaining a good attitude can you have the last laugh. Don’t let yourself give up halfway!
16. Investing doesn't guarantee profits; there's a high probability of losses. So, try to invest with your spare cash. Investing with spare cash will improve your mindset and increase your chances of winning. Remember this, and don't let investing put you in trouble!
Playing around in the cryptocurrency world is, to put it bluntly, a battle between retail investors and bankers. If you don't have cutting-edge information and firsthand data, you'll be ripped off! If you want to work with me and harvest the bankers together, come find me! [Official Account: Trend Prediction] Welcome like-minded cryptocurrency traders to discuss together~
Only buy this kind of trend in your life, and go from huge losses to huge profits!
I have practiced this method for tens of thousands of transactions, with a winning rate of up to 98%! Last month in March, I also earned 120,000 U in just one month!
There are two types of engulfing patterns: bullish and bearish.
The engulfing candlestick pattern consists of two candlesticks, so it falls under the category of double K patterns.
The structure of this pattern is very easy to recognize. On the chart, the first candlestick is completely engulfed by the next candlestick. Remember, for an engulfing pattern to form, the body of the first candlestick should be completely contained within the body of the next candlestick. Take a look at an example of an engulfing pattern below:
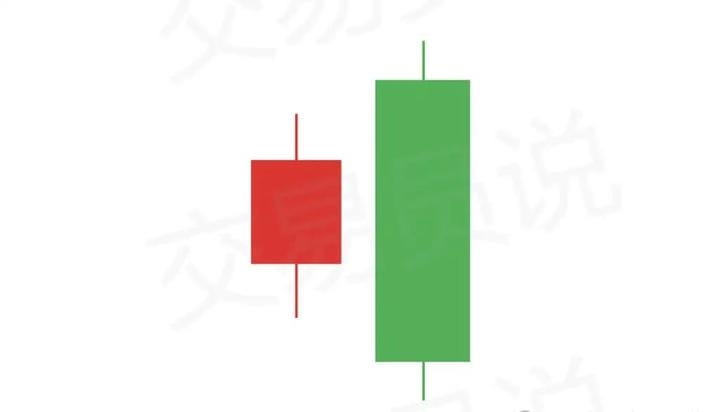
This is what the engulfing candlestick pattern looks like on a chart. As mentioned above, the first bearish candlestick (red) is completely engulfed by the real body of the following bullish candlestick (green). Similarly, the opposite scenario is also possible. An engulfing candlestick can be bullish, while an engulfing candlestick can be bearish.
The potential of the engulfing candlestick pattern
The engulfing candlestick pattern is a strong reversal signal. If the price forms an engulfing candlestick pattern on the way up, it gives us a signal that a top may be forming.
Conversely, if the price forms an engulfing pattern during a decline, it indicates that the price action may be forming a bottom.
Types of Engulfing Patterns
As mentioned earlier, there are two types of engulfing patterns, namely the bullish engulfing pattern and the bearish engulfing pattern. Let’s now look at each of these engulfing patterns separately:
Bullish Engulfing
The bullish engulfing candlestick pattern typically appears during a bearish trend. It begins with a bearish candlestick on the chart, which is then completely engulfed by the real body of the next bullish candlestick. This pattern creates bullish potential on the chart, potentially reversing the prevailing bearish trend. Take a look at the bullish engulfing candlestick pattern below:
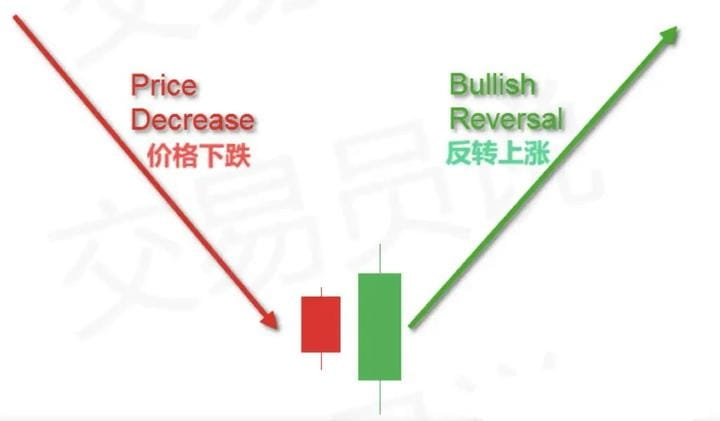
Notice that the first candlestick in this pattern is bearish and is completely contained by the body of the next bullish candlestick. This forms a bullish engulfing pattern, signaling a trend reversal. A valid bullish engulfing pattern suggests that a bullish move could begin after the recent decline.
Bearish Engulfing
The bearish engulfing pattern functions in the opposite way to the bullish engulfing pattern. It typically appears during a bullish trend. The pattern begins with a bullish candlestick, which is then completely engulfed by the body of the next bearish candlestick. This pattern creates strong price reversal potential on the chart, potentially shifting the current bullish trend into a new bearish one. Now consider the bearish engulfing pattern below:
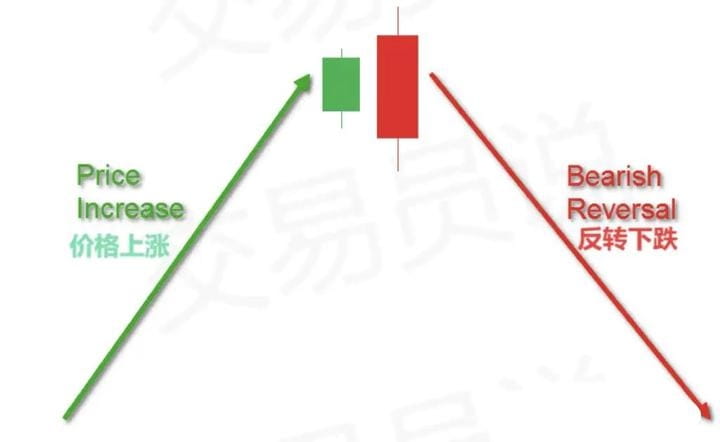
In the image above, the engulfing candlestick is bullish (green), while the engulfing candlestick is bearish (red). The second candlestick's body completely envelops the first candlestick, completing the bearish engulfing pattern on the chart. A bearish engulfing pattern can signal the start of a new downtrend on the chart.
Engulfing pattern confirmation
The confirmation of the engulfing pattern occurs on the candlestick following the pattern. It needs to break above the real body of the engulfing candlestick to confirm the validity of the pattern.
A valid bullish engulfing candlestick pattern will then have a third candlestick (bullish) that breaks above the body of the engulfing candlestick. A valid bearish engulfing candlestick will then have a third candlestick (bearish) that breaks below the body of the engulfing candlestick. This is what engulfing confirmation looks like on a chart, as shown below:
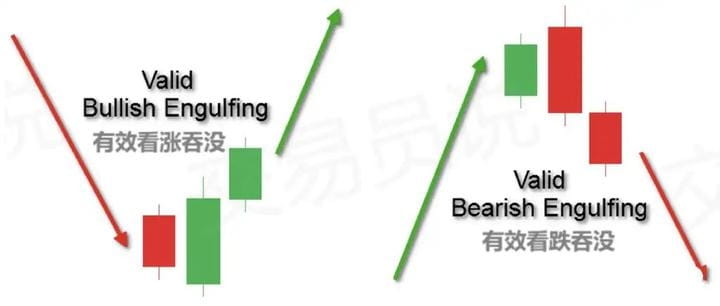
Notice that this time we see a confirmation candlestick following the pattern. When you see this kind of candlestick behavior after an engulfing pattern, it confirms the validity of the pattern.
Engulfing pattern trading strategy
We have already discussed the structure of the Engulfing pattern in detail. Now let's discuss the trading strategies associated with this chart pattern.
Engulfing pattern trade entry
The entry point for a trade is usually when the engulfing candlestick is confirmed. This is the third candlestick (the one following the engulfing candlestick), which should break through the body of the engulfing candlestick and move in the expected direction. When the candlestick closes outside this level, we have confirmation of the pattern and can open a corresponding trade.
If the engulfing pattern is bearish, the price should breakout below the body of the engulfing candlestick. In this case, we should prepare for a short trade. If the engulfing pattern is bullish, the price should breakout above the body of the engulfing candlestick. This means we should enter a long trade.
Setting a stop loss for the engulfing pattern
Without a doubt, controlling risk should be your primary consideration when trading. Therefore, you must set a stop-loss on your engulfing trades.
The best stop-loss placement for an engulfing candlestick is outside the engulfing candlestick's limits. If the engulfing candlestick is bullish, the stop-loss should be placed below the lower shadow of the engulfing candlestick. If the engulfing candlestick is bearish, the stop-loss should be placed above the upper shadow of the engulfing candlestick.
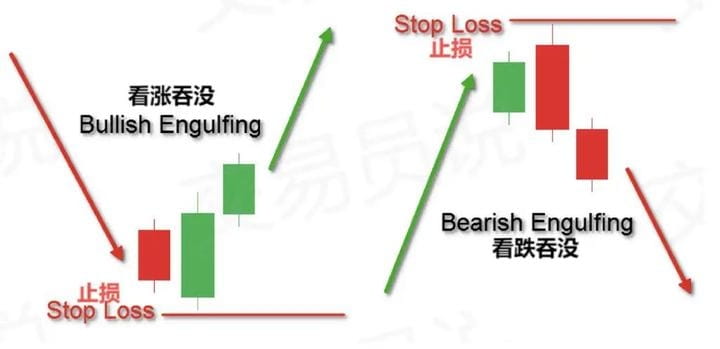
The chart above illustrates how you should set your stop-loss when trading the Bullish and Bearish Engulfing patterns. If the price fails to move in the expected direction and triggers your stop-loss, this will prove your trade hypothesis wrong while minimizing your capital losses.
Setting take-profit for the engulfing pattern
A good rule of thumb is that engulfing trades should be held for at least a price movement equal to the size of the pattern. This means that the minimum take-profit target pursued from an engulfing pattern should be equal to the distance between the upper and lower shadows of the engulfing candlestick.
When the price reaches this distance, you can choose to fully or partially close your position. If you choose to hold a partial position, carefully monitor price action for potential exit opportunities. This includes support/resistance breaks and trend or channel breakouts. Chart and candlestick patterns are also crucial here. If you see a chart or candlestick pattern that contradicts your current trade, you may want to close your position.
Engulfing Pattern and Price Action Strategies
Now let’s illustrate a price action-based trading strategy using the Engulfing pattern. See the chart below:
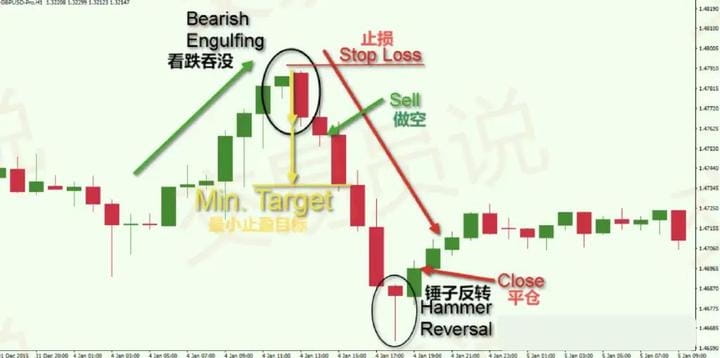
The above chart is an hourly chart of GBP/USD (British Pound/US Dollar) from January 1 to January 5, 2016. The chart depicts a bearish engulfing pattern and its trading rules.
The chart begins with price rising, marked by the green arrow. You'll notice that the price action only forms bullish candlesticks. Suddenly, we see a relatively large bearish candlestick that completely engulfs the previous one. This confirms the presence of a Bearish Engulfing Pattern on the chart.
However, in this case, we need a confirmation candlestick to appear before we can consider opening a position. The next candlestick on the chart is again bearish, closing below the body of the engulfing candlestick. This is the confirmation needed to enter a trade based on the bearish engulfing candlestick pattern. The stop-loss for this trade should be placed above the upper shadow of the engulfing candlestick, as shown in the image above.
The yellow arrow in the image shows the size of the pattern and how the minimum take profit target is applied on the chart. This target is achieved in the next candlestick that appears after the engulfing confirmation.
This trade can be extended to capture further profits. You can use price action rules to determine the final exit signal. You'll notice that the GBP/USD price has formed two more large bearish candlesticks on the chart, which would have doubled the profit on the trade. However, the next candlestick on the chart is a hammer reversal pattern, also known as a pin bar, which has strong bullish potential. The trade should be closed when the hammer pattern is confirmed. As you can see, the next candlestick is bullish and breaks above the upper level of the hammer pattern. This confirms the validity of the hammer reversal pattern and generates an exit signal to close the short position. The bearish engulfing trade should be closed on the close of the bullish candlestick following the hammer pattern, as shown by the second red arrow in the image above.
This example shows how price action rules can help find the most appropriate exit points on a chart.
Engulfing Pattern and Support and Resistance
Another effective way to trade the engulfing pattern with price action is to spot the pattern at key support and resistance levels.
If the price approaches a resistance area and a bearish engulfing pattern appears on the chart, this creates a very strong bearish potential on the chart. Conversely, if the price approaches a support level and a bullish engulfing pattern appears on the chart, this creates a very strong bullish potential on the chart.
These situations offer a high probability of success in trading. Many times, when you enter a trade at the right time based on technical confluence, you can get in early on an emerging trend reversal. Now let's look at how to combine the Engulfing Pattern with support and resistance levels:
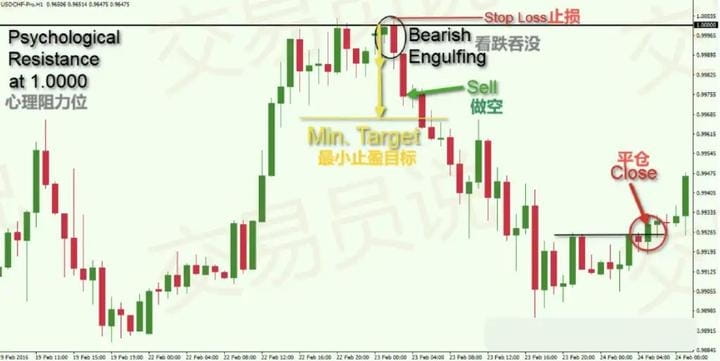
The above chart is an hourly chart of USD/CHF (US Dollar/Swiss Franc) from February 19 to February 24, 2016. The chart shows another bearish engulfing trade, which occurred after price crossed a psychological resistance level.
The black horizontal line in the chart represents the USD/CHF parity of 1.0000, a very strong psychological resistance level. After a strong price increase, USD/CHF encountered this resistance level and subsequently tested it twice. During the third test of this resistance level, the price formed a relatively large bearish candlestick that engulfed the previous bullish candlestick. This formed a bearish engulfing pattern on the chart.
The confirmation of a bearish engulfing candlestick appears with the next candlestick, which turns bearish and breaks below the real body of the engulfing candlestick. The close of the confirming candlestick provides a short entry signal.
The stop loss should be placed above the upper shadow of the engulfing candlestick, just above 1.0000.
After that, the price starts to fall. The minimum take-profit target of the pattern is then reached (indicated by the yellow arrow). You can close part of your position here and keep part open in the hope that the price will fall further.
Notice that USD/CHF continued to form lower highs and lower lows during its decline, lending credence to the downtrend. Suddenly, price action began to move sideways, with the upper limit of the range marked by the thin black horizontal line. The trade should be closed immediately once the price breaks through this resistance level and closes above it. As you can see, this forms a higher top on the chart, signaling a potential interruption to the bearish trend.
Combining support and resistance levels with the engulfing pattern is an excellent price action based trading method.
Let’s look at another example of a bullish engulfing candlestick pattern on EUR/USD: As you can see, a bullish engulfing candlestick pattern exists, indicating a possible buying opportunity.
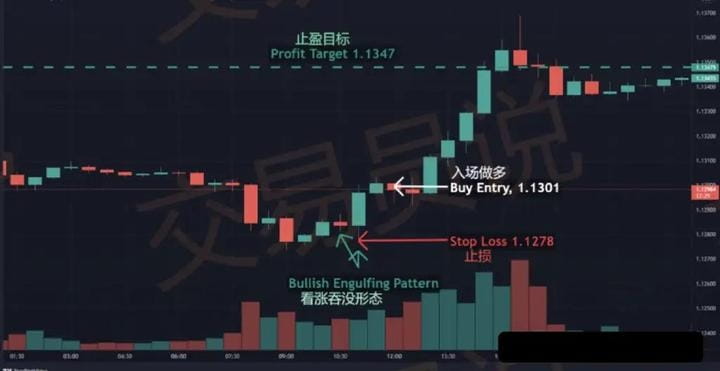
The above transaction is executed through the following steps:
1. A bullish engulfing pattern was confirmed.
2. Confirm the pattern and execute a buy order at 1.1301.
3. Based on a 1:2 risk-reward ratio, the profit target is set at 1.1347.
4. Place the stop loss below the lower shadow of the second bullish candlestick at 1.1278.
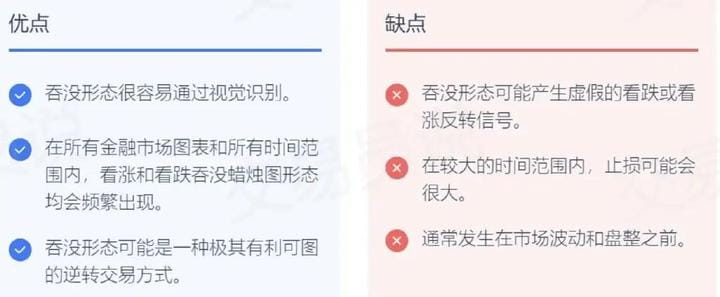
Engulfing candlestick pattern: advantages and disadvantages
The bullish and bearish engulfing candlestick patterns each have their advantages and disadvantages, as shown below:
Summarize
The Engulfing candlestick pattern is a double candlestick pattern. It consists of two candlesticks, with the second candlestick completely engulfing the previous one, including its shadow. Engulfing candlestick patterns have strong reversal potential on charts. We recognize two types of Engulfing candlestick patterns:
Bearish Engulfing: This pattern can be found at the end of an uptrend. It begins with a bullish candlestick followed by a larger bearish candlestick whose body completely engulfs the first candlestick in the pattern. This creates bearish (reversal) potential on the chart.
Bullish Engulfing: This pattern can be found at the end of a downtrend. It begins with a bearish candlestick, followed by a larger bullish candlestick whose body completely engulfs the first candlestick in the pattern. This creates bullish (reversal) potential on the chart.
The confirmation of the engulfing pattern appears on the next candlestick on the chart:
If the engulfing candlestick is bullish, the next candlestick should be bullish and close above the body of the engulfing candlestick.
If the engulfing candlestick is bearish, the next candlestick should be bearish and close below the body of the engulfing candlestick.
Here are three basic engulfing trade rules:
Open a trade when the price closes the confirmation candlestick.
Place a stop-loss order outside the opposite side of the engulfing pattern.
Keep the minimum price move in your trade equal to the size of the engulfing pattern, or use price action rules to extend your trade.
A high probability price action method for trading both bullish and bearish engulfing patterns is to look for the pattern to appear at significant support and resistance levels.
It took me 5 years to grow from 50,000 to over 36 million. After thousands of days and nights of reviewing and drawing over 800 charts, I came up with the following secret to making money in the cryptocurrency world: (Trend Trading)
I will share it with you selflessly today. The method is very simple and practical. Even novices can get started immediately. I suggest you follow it and collect it.
Trend trading involves taking advantage of a strong upward or downward price movement. Different traders may define a trend differently.
For example, a trader who prefers high volatility instruments might not consider the instrument to be in an uptrend until the price rises by 20% or more.
A low volatility trader, on the other hand, may only need small price fluctuations to believe that a trend has formed.
Regardless of the timeframe or strategy, the goal of trend trading is to identify the trend and find ways to join it with minimal risk. To that end, this article will discuss several trend trading strategies and reveal how to identify an uptrend.
First, let’s talk about how to spot trends.
Trend Trading Indicators
When trading, the less subjective your opinion of the market is, the better. Therefore, you can use technical indicators to identify market trends.
Trend lines
Trendlines are a great way to clearly define market trends. While it's still somewhat subjective, as you need to identify where the trendline begins and ends, with some practice you should be able to identify key points of support and resistance, and thus, the trend.
For a bullish trend, you need to connect the lows and highs to form an ascending channel. After all, an uptrend is only confirmed when you have a series of higher lows (HL) and higher highs (HH).
When the market is on an upward trajectory, prices should not fall below the previous lows.
Likewise, for a bearish trend, you simply reverse the lows and highs.
Note that the two charts above are actually of the same stock, just showing opposite day trades. Trends can help you understand the direction of your trade. The beauty of trendlines is that as you draw them over and over, your eye becomes more and more trained to predict the direction of a stock's movement.
This helps in setting targets and reversal points during your trading.
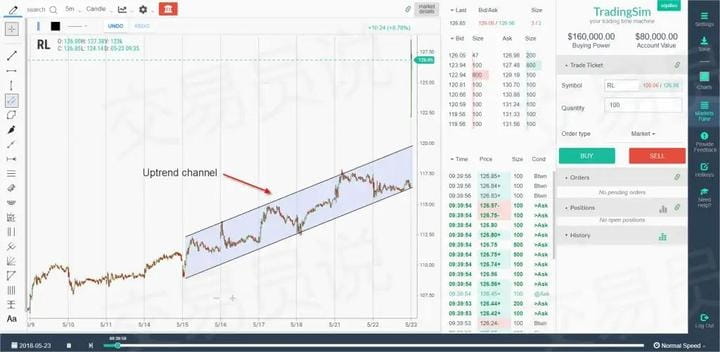
Trend Channel
Going a step further, you can use trend channel drawing tools. These channels create clean parallel lines. However, these channels will not allow you to create wedge or diamond patterns.
Typically, trend channels work best with large-cap stocks: these are companies with larger market capitalizations and greater liquidity.
Slope of the line
Another point to note is that you need to identify the minimum slope of the line, which will trigger the formation of a trend.
Strong trends typically have a slope of 50 degrees or more, creating strong upward momentum.
This is entirely subjective. Nonetheless, if you are trend trading, the move should be strong enough for you to pay attention.
Moving Average
Moving averages are another excellent indicator you can use to gauge trend strength.
On larger time frames, you can take a simple approach by observing whether the price is above or below the 200-day moving average. However, another approach is to look for strong trends in which the moving averages do not cross over during an upward trend. The gaps between the moving averages indicate that the stock is rising strongly across all timeframes (short-term and long-term).
To further illustrate this point, we can filter for stocks that have an overlap of their 20-day, 50-day, and 200-day moving averages on their daily charts. In other words, the 20-day moving average is above the 50-day moving average, which is above the 200-day moving average.
This tells us that the short-term moving average is above the long-term moving average, indicating an uptrend. Of course, the opposite is true for a downtrend.
Uptrend Example
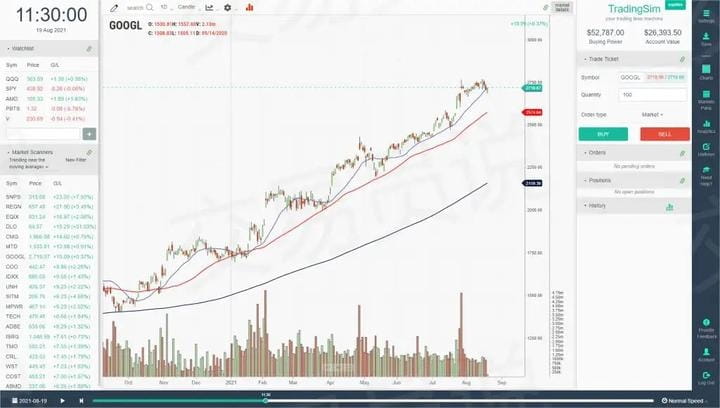
From the chart above, you can see that the purple 20-day moving average is significantly above the red 50-day moving average. Also, below that, the 200-day moving average is also sloping up.
The three moving averages are aligned and are giving a strong signal that the trend is very strong.
Non-trending example
Now that you know what a strong uptrend looks like, notice the difference between the trends in GOOGL and XNCR.
Look, there's a lot of volatility in the market, right?
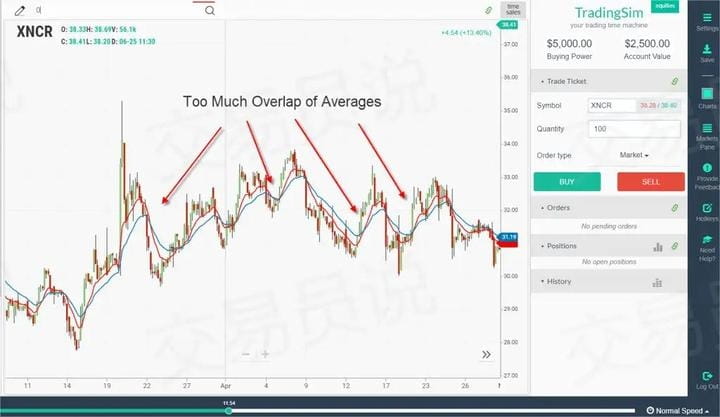
In the above chart, there are two moving averages: the 10-day and 20-day exponential moving averages (EMAs). You can see that the 10-day EMA is backtesting against the 20-day EMA, which clearly indicates that the stock price is not in a strong trend.
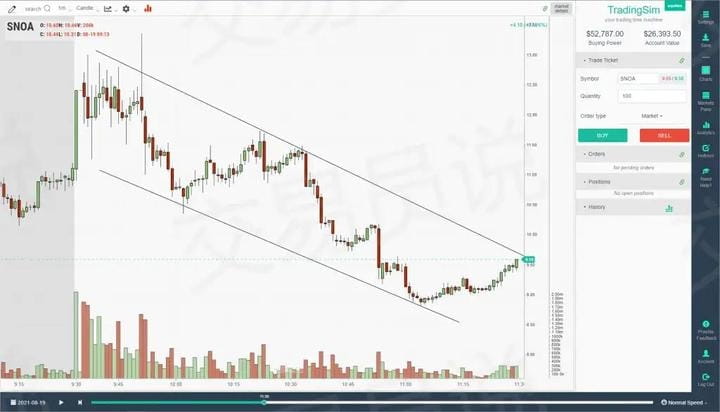
Downtrend Example
ABIO saw a significant sell-off after reaching an extreme high of approximately $18. Since then, the stock price has never recovered.
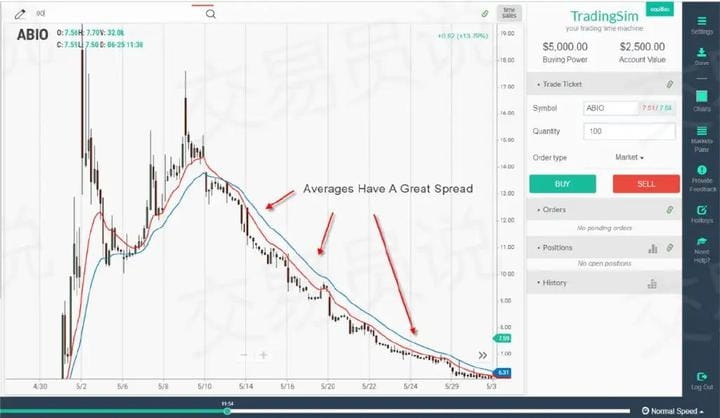
The above chart clearly shows a strong decline in the stock price. Notice how the moving averages didn't cross at all during the decline. To enhance the validity of the trend, the moving averages maintained a wide gap throughout the decline.
It should be noted that such trends are difficult to find. You certainly don't want to be on the wrong side of a trend. Unfortunately, some sell-offs don't result in a pullback, thus preventing low-risk entry opportunities.
Awesome Oscillator
Another indicator you can use to analyze the market is the momentum oscillator. These indicators have no upper or lower limits, allowing the oscillator to fluctuate with stock price movements.
The TRIX indicator (Triple Smoothed Average Exponential) is a momentum oscillator that fluctuates above and below the zero line. In the next chart, we will discuss a stock that is in a strong downtrend.
As this stock continues to decline, notice that TRIX remains almost entirely below the zero line.
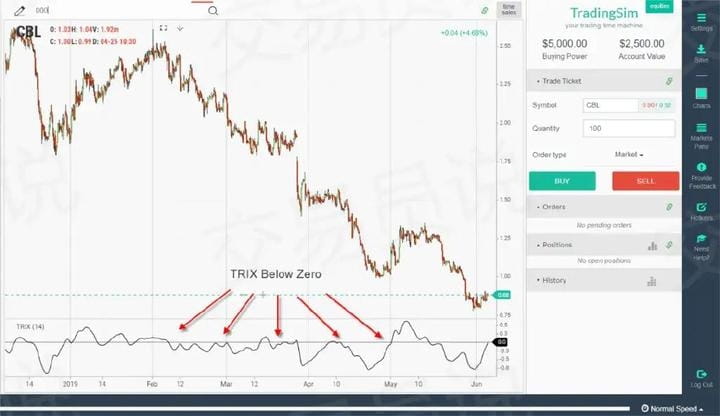
It is worth noting that TRIX does not react quickly because it smooths three exponential moving averages, so it is a good indicator of trend.
Observe how TRIX consistently remains below the zero line as the stock price declines. It is important to remember that this does not mean that TRIX will not occasionally break through the zero line slightly.
Remember, price action in the markets rarely fits perfectly into the framework prescribed by technical analysis books.
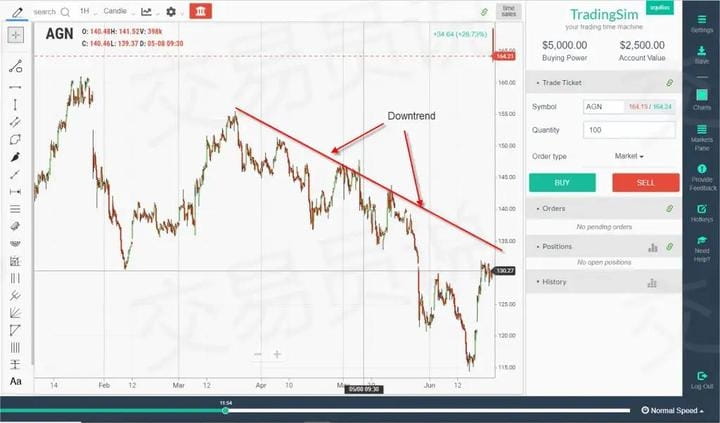
More Trend Trading Examples
In our first example, we see a stock that is clearly in a downtrend. You can see that the stock is forming lower lows and lower highs.
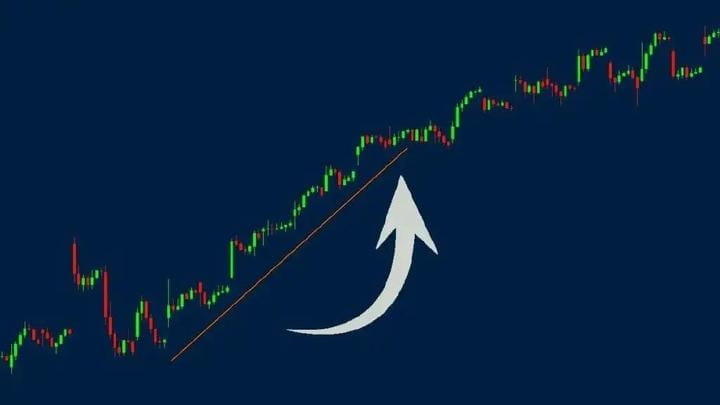
Next, we have a strong bullish uptrend forming higher highs and higher lows.
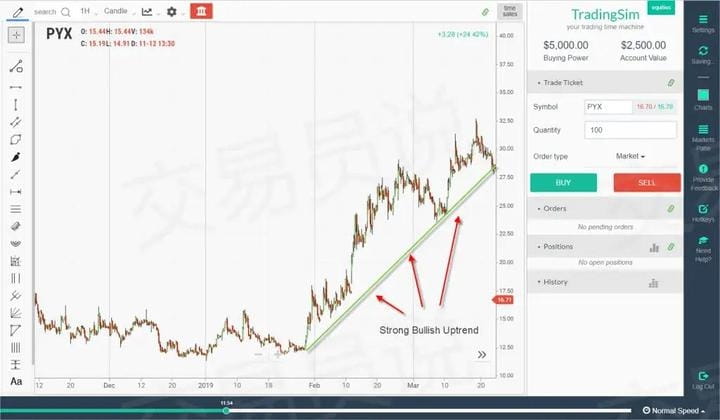
Hopefully these examples help you see the different trends. Here’s one more:
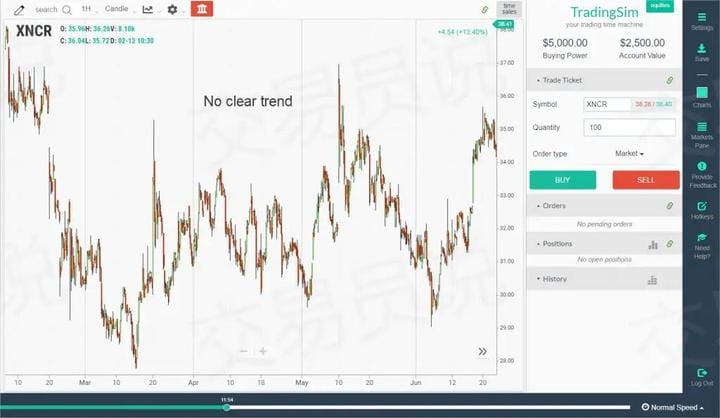
Can you see the lack of any trend in the chart above? This is what we call a range-bound market, or securities that lack a clear trend. Most of these stocks are trading in a range.
Reasons why trend trading fails
Trend trading is like any other strategy in the market. There will never be a 100% success rate. Often, bullish trends fail when the price reaches a peak, breaks out of its channel, or when supply becomes too heavy.
Conversely, the downtrend will end when prices plummet or demand supports it.
The key is to study the trend and find the consistency between volume and price action.
Not adhering to stop-loss
When you trade a trending stock, it feels great. You don't have to do much, and the money keeps pouring into your account. However, if you buy a trending stock at the very moment it reverses, you could get stuck.
This is because a late entry could lead to a horrible reversal, with the stock price ultimately falling back to its original price.
Therefore, you must use stop-loss orders, otherwise the trending market will turn into your worst nightmare.
If you find yourself buying at the top of a strong trend, don't add to your position because you're violating the lows of each decline. This practice is called averaging down and can have devastating consequences.
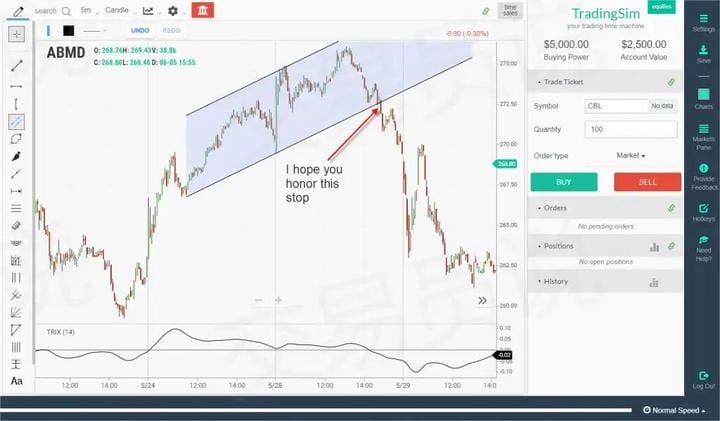
In the above chart example, we pointed out what happens if you buy support in a channel during a strong uptrend and the trend fails.
As you can see, if you don’t place a stop loss just below the low that was tested, things can get really bad really fast.
Strategies for joining the trend
Now that you know what to avoid, let’s look at a few strategies to help you successfully join the trend.
1. Moving Average Pullback
During a strong trend, prices often pull back to important moving averages, such as the 20-day or 50-day moving averages. These pullbacks often provide a good opportunity to join the trend while keeping risk low if prices continue to rise.
Because institutions like to buy at lower prices, prices tend to find support at these levels.
Let’s use the GOOGL example above to see how buying near the 50-day moving average was an excellent decision.
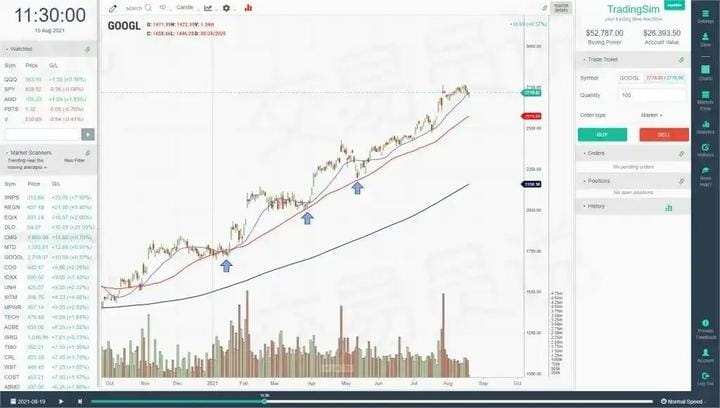
We see three excellent pullback buying opportunities on the GOOGL chart, all near the 50-day moving average, as marked by the arrows. Each of these buying opportunities represents a good profit opportunity.
If the trade does not succeed, you can set the stop loss below each consolidation range to control the risk.
2. Mean Reversion Trend Trading
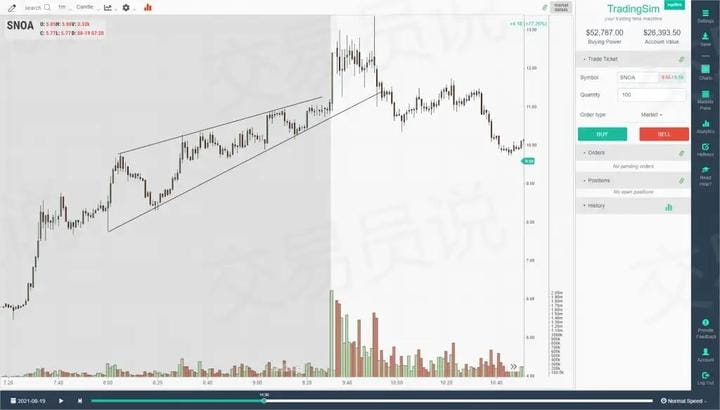
If you don’t like using moving averages, sometimes channels can be more effective. Let’s remove the moving averages from the GOOGL chart and this time add a channel.
Note that the buy point corresponds to the low point of the channel, and the sell point corresponds to the breakout of the high point of the channel.
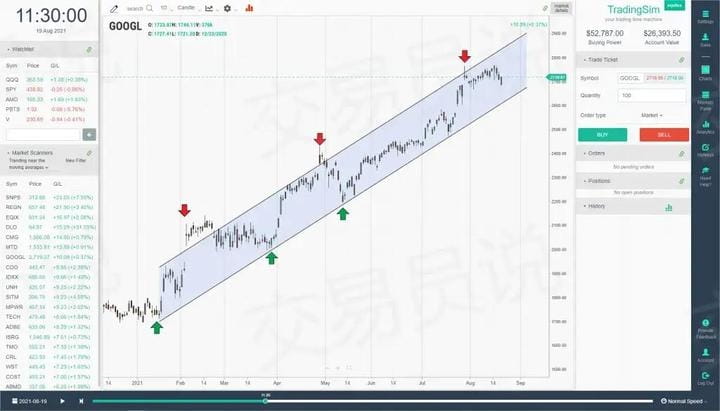
This can be a very simple and effective way to manage a short-term position. Basically, you are buying the pullback at support and selling at the highs.
Trend trading is all about your entry point, stop loss, and chosen trading method. Whether you use moving averages, channels, or oscillators, you need to master each method to develop your edge.
The biggest difficulty in trading is not the fear of losing money!
So how do you overcome your fear of losing money?
The great philosopher Bertrand Russell once said: The fastest way to overcome fear is to do the very thing you fear. Aren't you afraid of losing money? Then deliberately practice losing money.
Step 1: Prepare 100U
Step 2: Lose all the 100U within a week. But this doesn't mean you can do it blindly. You can't open positions blindly, you can't blindly increase leverage, you can't blow up your position, you must strictly set stop-loss, and you must strictly execute according to the opportunities within your trading system.
Aren’t you afraid of losing money? Don’t you trust your trading system?
Come on! The best way to eliminate fear is to face it. So lose as much as you can! This 100U is for you to lose. If 100U isn't enough, add another 100U. When you feel numb to losses, that's when you've achieved success. At that moment, you'll understand what I often say: "Losing money is normal, missing out is also normal. Only when you accept this, can making money become your normal."
Only by experiencing losses again and again, by repeatedly playing games with yourself, can you be reborn and overcome the fear of losses. Then, from now on, whether holding a position or entering the market, you will not hesitate.
I’ll tell you in secret, if you really do what I said above, it is highly likely that you will not lose all your money, and you may even double your capital.
So at that time, you will involuntarily want to increase your capital investment, but when you use 1000U or 10000U to go all in
You will find that your old habit comes back again: What should you do if you are still afraid of losing money?
Question 1: What should I do if I’m still afraid of losing money?
Sizing your positions appropriately
Question 2: What is the right size?
A position that allows you to sleep soundly
Question 3: When can I increase my position?
When you can still sleep well after enlarging
But please note! The deliberate practice method I just taught you requires you to have your own trading system. If you don’t even have a trading system, then you have no right to be afraid of losing money!
Recommendation: Reduce excessive focus on short-term prices and instead track on-chain data and niche sectors, waiting for "non-consensus opportunities." I'm Ah Peng, a veteran of multiple bull and bear cycles and possess extensive market experience across multiple financial sectors. Here, we can penetrate the fog of information and discover the true market. Seize more opportunities to unlock wealth and discover truly valuable opportunities. Don't miss out and regret it!
Ah Peng only does real trading, the team still has positions to speed up #加密市场回调 $BTC$ETH