When opening a cryptocurrency chart for the first time, all the lines, candles, and indicators can seem confusing. But the good news is that you don't need to be a professional trader to understand the basic concepts. With just a few simple steps, you can learn to read a cryptocurrency chart in less than 5 minutes and start making smarter trading decisions.
Step 1: Understand the candles
Most cryptocurrency charts use candlestick charts instead of simple lines.
Green candle (or white): the price rose during that time period.
Red candle (or black): the price fell.
Body of the candle: shows where the price opened and closed.
Wicks (shadows): Show the highest and lowest price reached in that time period.
Example: if the Bitcoin candle opens at $40,000 and closes at $42,000, the candle will be green.
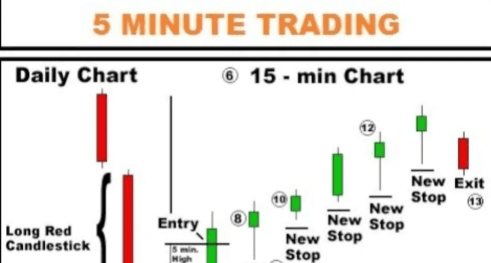
Step 2: Deadlines matter
Charts can be set up for different time periods:
1-minute/5-minute charts: for day traders looking at quick moves.
1-hour/4-hour charts: good for swing trading and short-term analysis.
Daily/weekly charts: ideal for long-term investors.
Pro tip: The longer the time period, the more reliable the trend will be.
Step 3: Detect the trend
Ask yourself: Is the price moving up, down, or sideways?
Bullish trend: higher highs and higher lows (bullish).
Bearish trend: lower highs and lower lows (bearish).
Sideways (consolidation): the price moves within a range without a clear direction.
Remember: “The trend is your friend.” Don’t fight it.
Step 4: Identify key levels (support and resistance)
Support: Price level where buyers step in (floor).
Resistance: A price level where sellers take profits (ceiling).
Example: If $ETH keeps bouncing around $2,500, that's support. If it struggles to break above $3,000, that's resistance.
These levels often decide whether the price bounces or breaks out.
Step 5: Use simple indicators
You don’t need 20 indicators. Start with the basics:
Moving averages (MA): shows the average price over time (helps to detect trends).
Relative Strength Index (RSI): Measures momentum. Above 70 = overbought (the price could fall). Below 30 = oversold (the price could rise).
Volume: Indicates the strength of the movement. High volume means a stronger trend.
Additional tip: Keep it simple
Don’t overload your chart with indicators. Focus on price action, trend, and key levels. With practice, you will quickly identify good entry and exit points.
Final thoughts
Reading cryptocurrency charts is not rocket science. In just 5 minutes, you can understand candles, detect trends, mark supports and resistances, and check basic indicators. The more you practice, the faster you'll learn.
The next time you open a chart, instead of feeling lost, you can say: I see where this market is heading.
#BinanceHODLerOPEN #USNonFarmPayrollReport #MarketPullback $BTC $ETH $XRP