In this article, we will explain one of the strongest and most important technical indicators used by technical analysis experts.
This indicator is considered one of the strongest technical tools in technical analysis, as it is used alongside price movement and trading volume to confirm trends or alert to the possibility of a price reversal.
MACD INDICATOR 📊
First: Let's understand the role of trading volume in confirming trends.
Confirmation of the bullish trend: when prices rise with an increase in trading volume, this confirms the strength of the bullish trend.
Confirmation of the bearish trend: when prices drop with an increase in trading volume, this confirms the strength of the bearish trend.
Signs of trend weakness: If prices rise with decreasing trading volume, this indicates investor doubts and potential trend weakness.
Second: Bullish Signals from MACD
The MACD indicator is capable of providing strong bullish signals through 3 main patterns:
1. Positive Divergence (positive deviation):
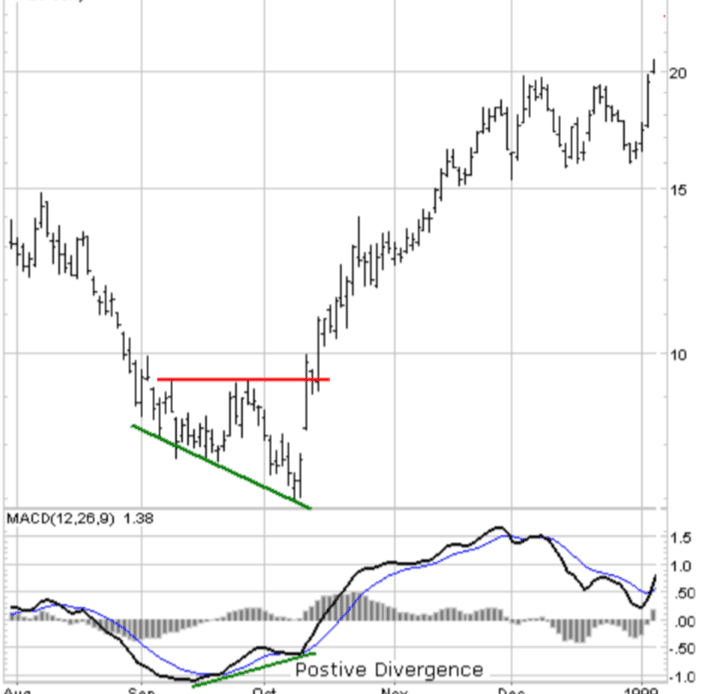
When MACD makes higher lows while the price drops.
A rare but strong signal indicating potential rise.
2. Bullish Moving Average Crossover (crossing with the average line):
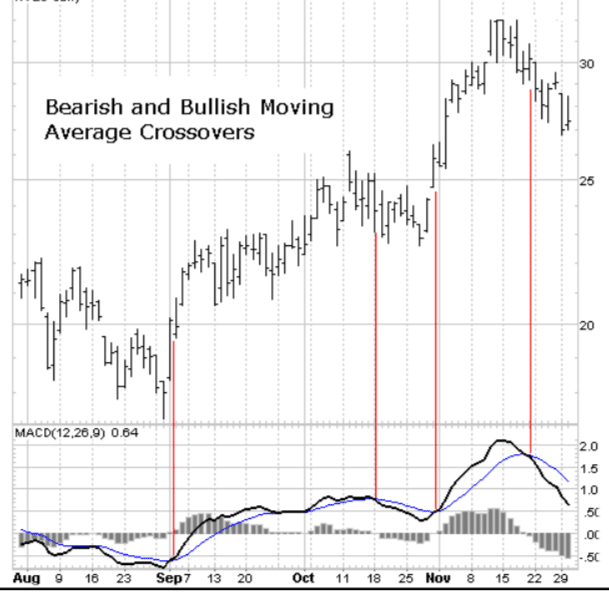
Occurs when MACD breaches the Signal Line upwards.
A common signal but it may give false signals if not accompanied by confirmation from other signals.
3. Bullish Centerline Crossover (breach of the zero line upwards):
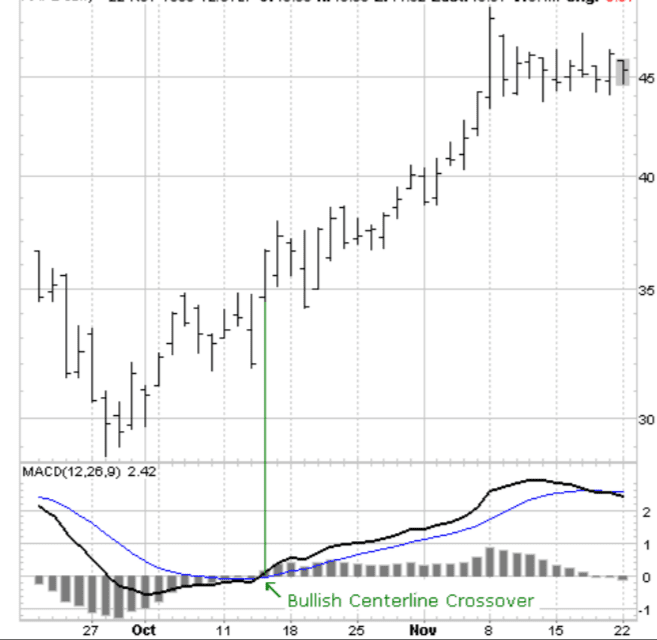
A signal indicating a shift in trading from negative (Bearish) to positive (Bullish).
If it follows the previous two signals, it is considered a strong confirmation.
Third: Bearish Signals from MACD
On the other hand, MACD issues bearish signals when the trend weakens, including:
1. Negative Divergence (negative deviation):
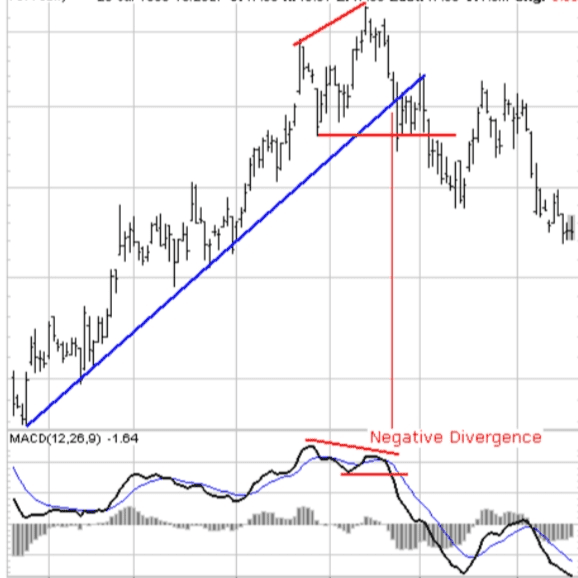
The price makes higher peaks while MACD drops.
A strong signal of an impending drop.
2. Bearish Moving Average Crossover (crossing the average downwards):
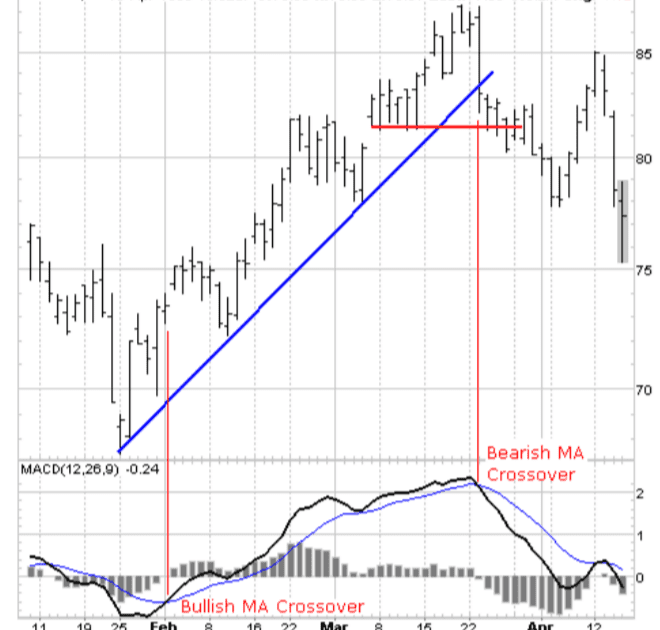
Occurs when MACD breaches the Signal Line downwards.
A common signal but it needs additional confirmation.
3. Bearish Centerline Crossover (breach of the zero line downwards):
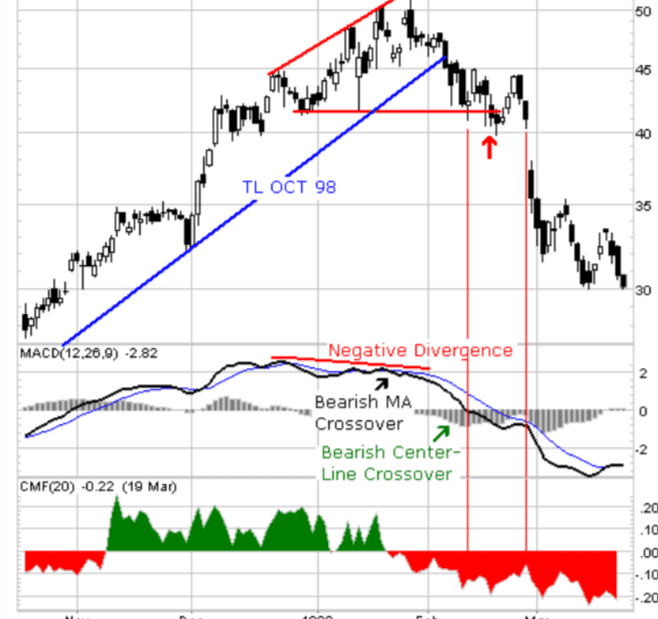
Indicates a shift in trading from positive to negative.
It is preferable to combine it with other signals for confirming the downturn.
Fourth: The role of the Histogram in MACD
Thomas Aspray developed the MACD Histogram indicator in 1986 to illustrate the difference between MACD and the Signal Line.
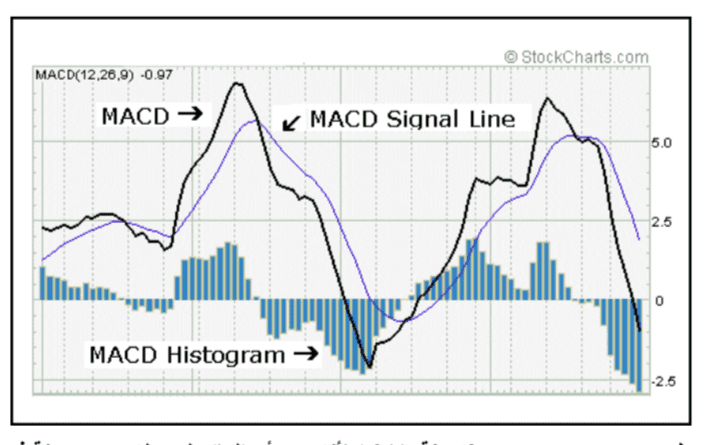
How does the Histogram work?
If MACD is above the Signal Line → the Histogram shows above the zero line (positive).
If MACD is below the Signal Line → the Histogram shows below the zero line (negative).
The greater the difference between MACD and the Signal Line, the more intense the waves appear in the Histogram.
Fifth: The importance of the Histogram in early prediction
The Histogram is considered a predictive tool, as it predicts MACD breaching the Signal Line before it occurs.
Example:
When Positive Divergence appears in the Histogram, this is an early warning of MACD rising and then breaching the average line.
When Negative Divergence appears, this warns of a drop in MACD and then the formation of a Bearish signal.
Sixth: The best ways to use MACD and Histogram
1. Relying on the weekly chart to understand the general trend.
2. Using the daily chart to determine entry and exit points.
3. Ignore weak opposite signals (for example: a bearish weekly trend with a weak daily rise signal).
4. Focus on strong models (deviations + zero line breaches + sharp Histogram waves).
Summary
MACD is used to confirm trends and monitor shifts between rising and falling.
Histogram is a leading tool that helps predict MACD movements and thus price movement.
Combining weekly and daily signals gives a clearer and more comprehensive view.
Accuracy.


