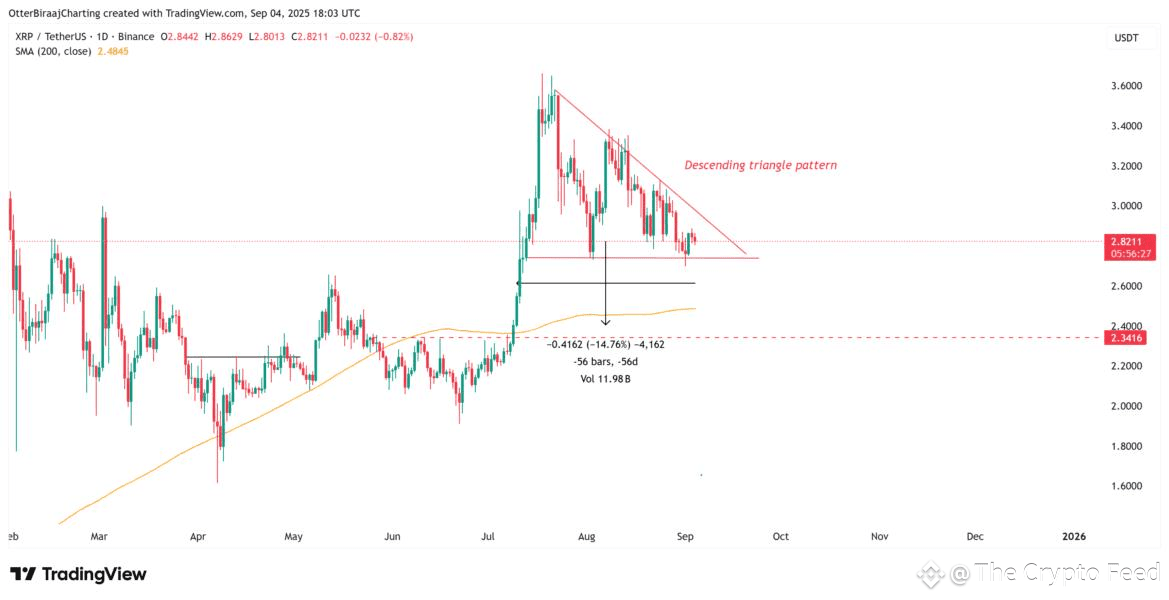
XRP's Recent Price Performance: XRP's price has declined by nearly 20% in the last 45 days. It is currently in a descending triangle pattern, a technical formation that often indicates a continuation of a downtrend. The key support level to watch is near $2.70.
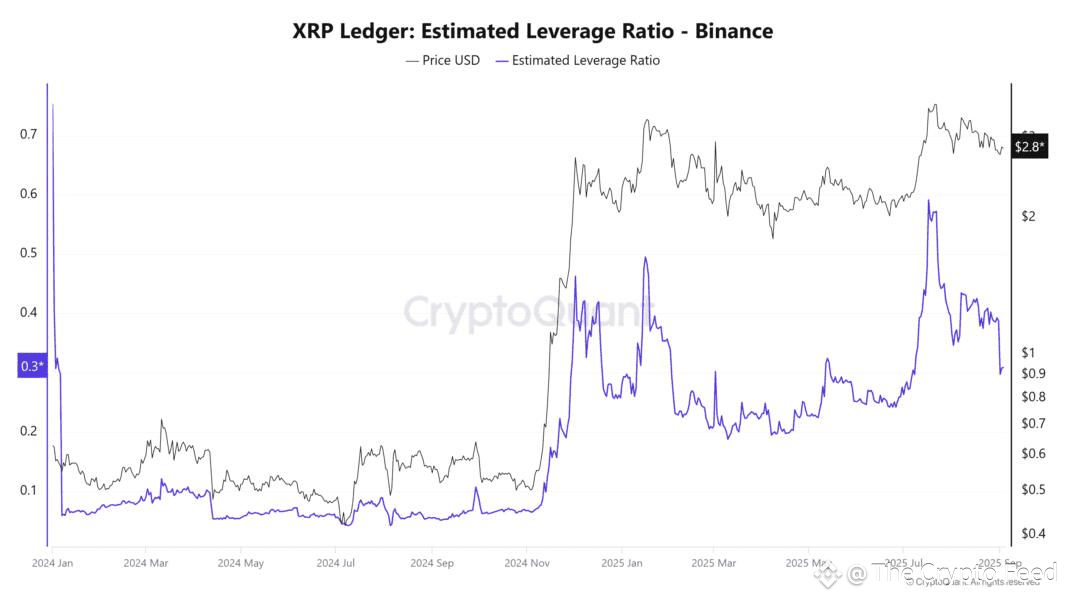
Leverage and Liquidation Risks Reduced: Onchain and futures data suggest that market risks have decreased. The open interest in XRP futures has fallen from $11 billion to $7.5 billion, and the estimated leverage ratio has reset to its yearly average. This indicates that traders are no longer "overextended," which lowers the risk of cascading liquidations that can cause sharp price drops.
Early Signs of Accumulation and Potential Reversal: Onchain indicators show that net taker volume is nearing neutral, and spot cumulative volume delta (CVD) is increasing, suggesting that holders may be in an accumulation phase. Futures data also supports this, with declining aggregated futures CVD and normalized funding rates.
Technical Indicators Point to a Potential Bottom and Rebound:
Fair Value Gap (FVG): A key area to watch is the daily/weekly fair value gap between $2.35 and $2.65. The market may retrace into this zone before finding a bottom.
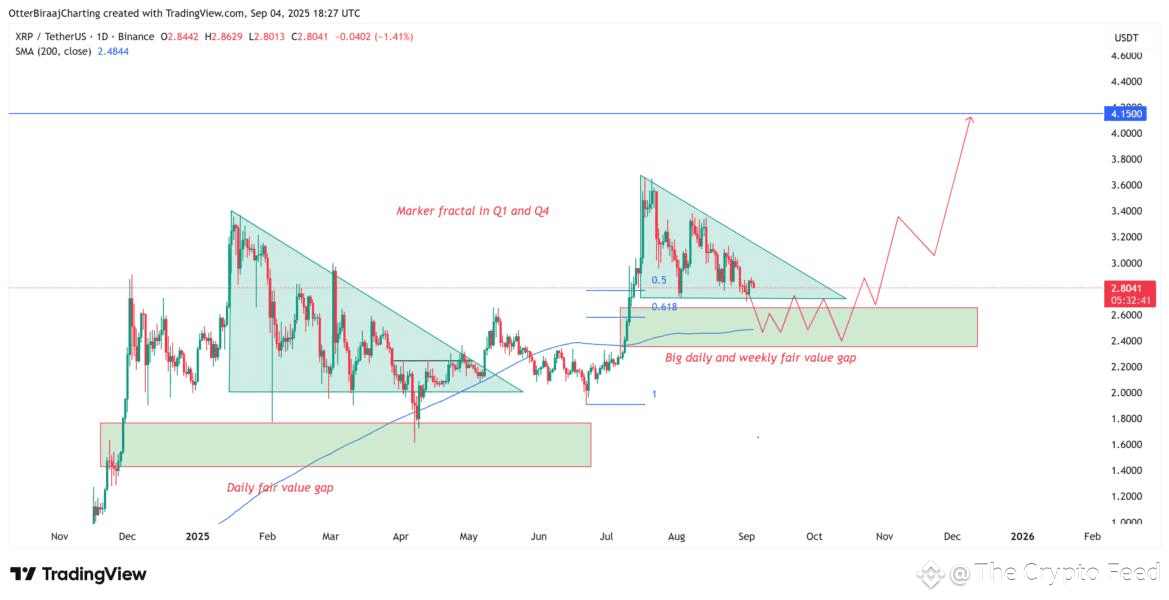
Fibonacci Retracement: The 0.5 to 0.618 Fibonacci retracement levels align with the fair value gap, reinforcing the $2.35 to $2.65 zone as a strong potential area for price stabilization and a rebound.
Fractal Pattern: XRP's current market structure resembles a Q1 fractal pattern that previously led to a significant breakout. If this pattern repeats, XRP could see a rebound of 60% to 85% in Q4.
Bullish Price Target: Crypto trader Javon Marks believes that as long as XRP holds the key support level of $2.47, its price could be "prepping for another +66% upside," with a target of $4.80.
Technical and Onchain Analysis of XRP's Recent Price Action and Future Outlook.
Disclaimer: Includes third-party opinions. No financial advice. May include sponsored content. See T&Cs.

XRP
3.0567
+2.09%