Hello Binance traders! 🚀
Get ready for a fiery technical analysis of the DOT/USDT pair on the daily timeframe, an analysis you won't find anywhere else! We will dive deep into the chart and extract the most important signals using the MACD and RSI indicators, in addition to identifying crucial support and resistance points. Get ready for the hype and noise! 🔥
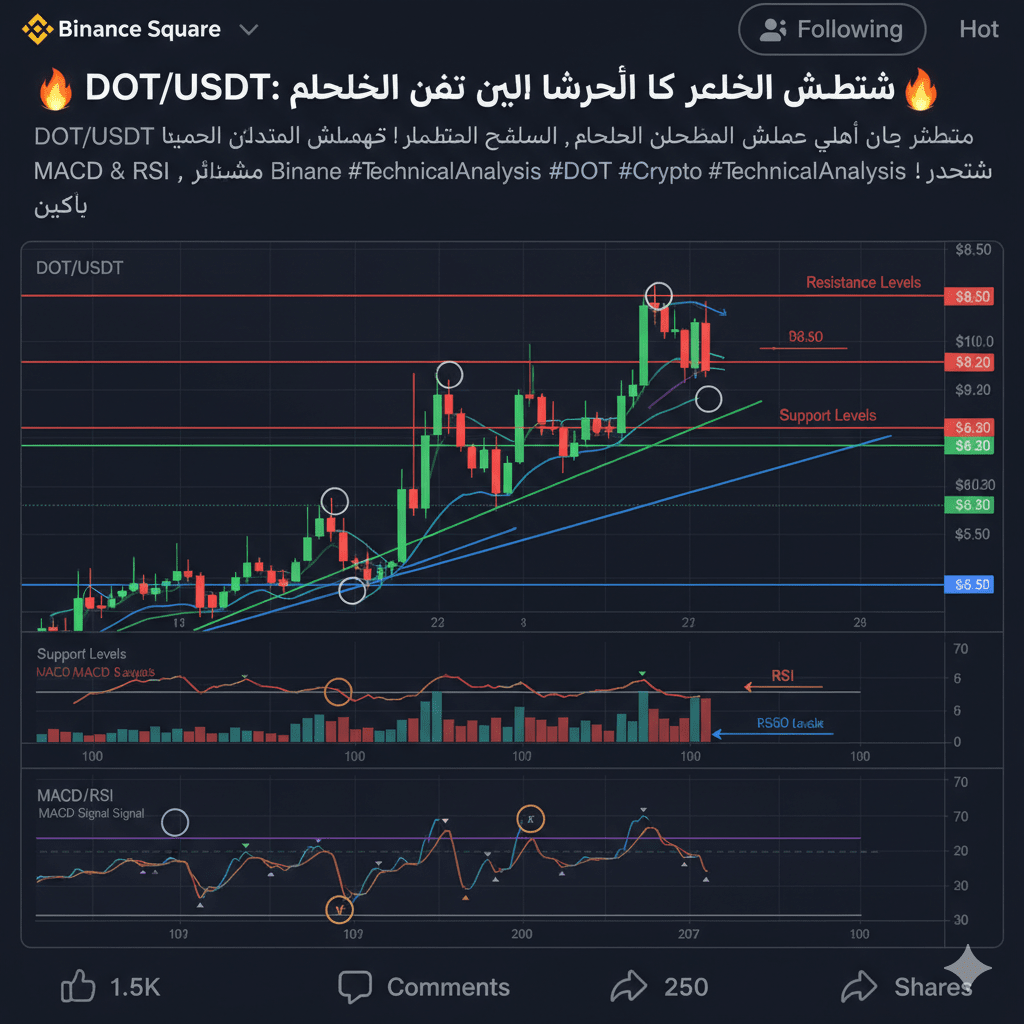
DOT/USDT: Comprehensive Technical Analysis on the Daily Frame
Price Overview:
We see that DOT has witnessed significant upward momentum in the past period, attempting to break through strong resistance levels. But can it maintain this momentum? Let's see.
MACD Indicator (Moving Average Convergence Divergence):
What does it tell us? The MACD line is still above the signal line, indicating latent upward momentum. However, the MACD line has begun to curve downwards, which may indicate weakening momentum or the possibility of an imminent correction.
Decision: Monitor the MACD crossover with the signal line very carefully. If the crossover occurs downwards, it could signal the beginning of a short-term downtrend.
RSI Indicator (Relative Strength Index):
What does it tell us? The RSI is currently trading in the over mid-range (50), but it has started to retreat from overbought areas (above 70). This means that buyers may have lost some strength, and we might witness some price correction.
Decision: If the RSI continues to decline and breaks below 50, it may confirm the sellers' control in the short term.
Key support and resistance points:
Resistance Levels:
Immediate resistance: around $7.80 - $8.00. This is a strong area that the price has tried to break through multiple times.
Strong resistance: at $8.50. Successfully breaking this level with high liquidity will open the door for further gains.
Support Levels:
Immediate support: at $7.00 - $7.20. This level is crucial to maintain the current bullish structure.
Strong support: at $6.30 - $6.50. If the immediate support is broken, this level will be crucial to prevent further declines.
Support trend line: We have a clear upward trend line (marked in green in the image) extending from the lower levels. Breaking this line is considered a strong negative signal.
Summary and Recommendations:
Bullish Scenario: If DOT manages to break the resistance level of $7.80 - $8.00 and then $8.50 firmly with high trading volume, while the MACD and RSI indicators stabilize, we may witness a continuation of the rise towards higher levels.
Bearish Scenario: If DOT fails to maintain support at $7.00 - $7.20, especially with a negative MACD crossover and RSI dropping below 50, we may witness a correction towards strong support at $6.30 - $6.50 or even break the upward trend line.
Golden advice: Risk management is the key to success! Don't trade based on emotions, and always do your own research. Markets are volatile, and technical analysis is just a tool.
What do you think of this analysis? Are you ready to ride the next DOT wave? Share your thoughts and predictions in the comments! 👇
#DOT #USDT #Binance ance #TechnicalAnalysis nalysis #CryptoNewss pto #Trading #MANTA CD #RSI #Polkadot $DOT

