
Today, Bitcoin closed the weekly and monthly charts, further analysis will be conducted.
Weekly
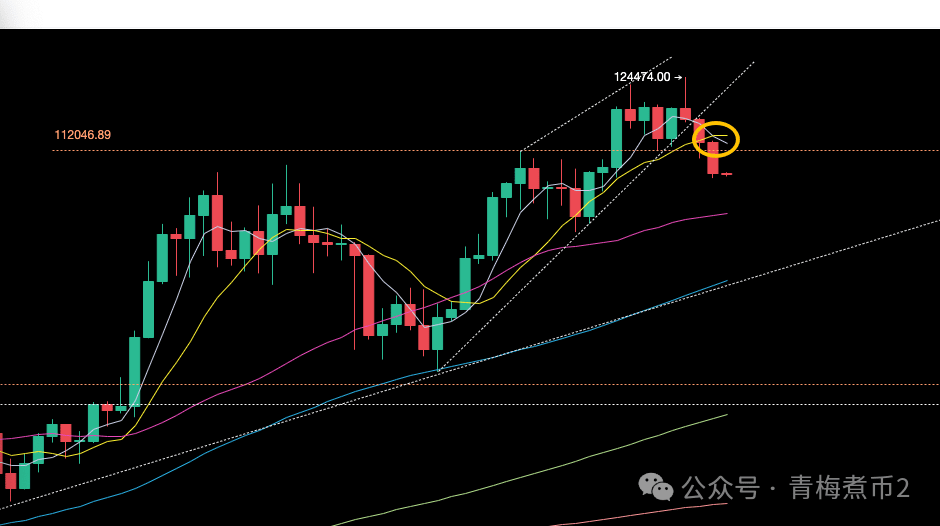
Bitcoin has closed with three consecutive weeks of declines, the weekly moving average has formed a death cross, and after the death cross on the weekly chart, it is likely to see a spike before a rebound.
Monthly
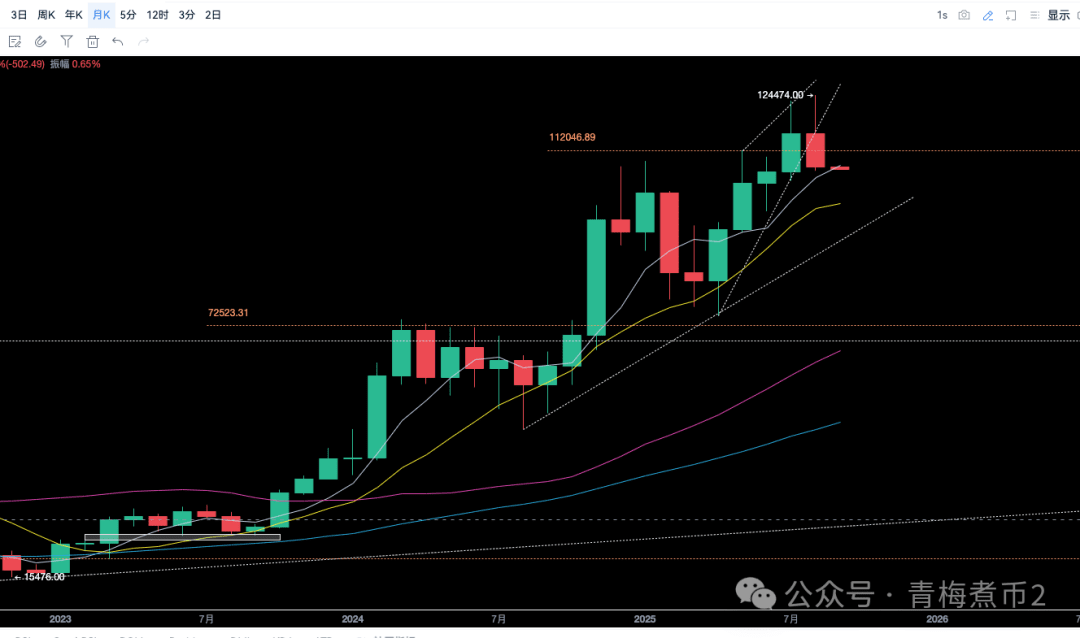
The monthly chart of Bitcoin shows a bearish cloud cover candlestick pattern, accompanied by a relatively long upper shadow. (For an introduction to candlestick patterns, see the 1.9 edition of 'The Ordinary Person's Cryptocurrency Trading Manual')
Speculation on the direction of Bitcoin
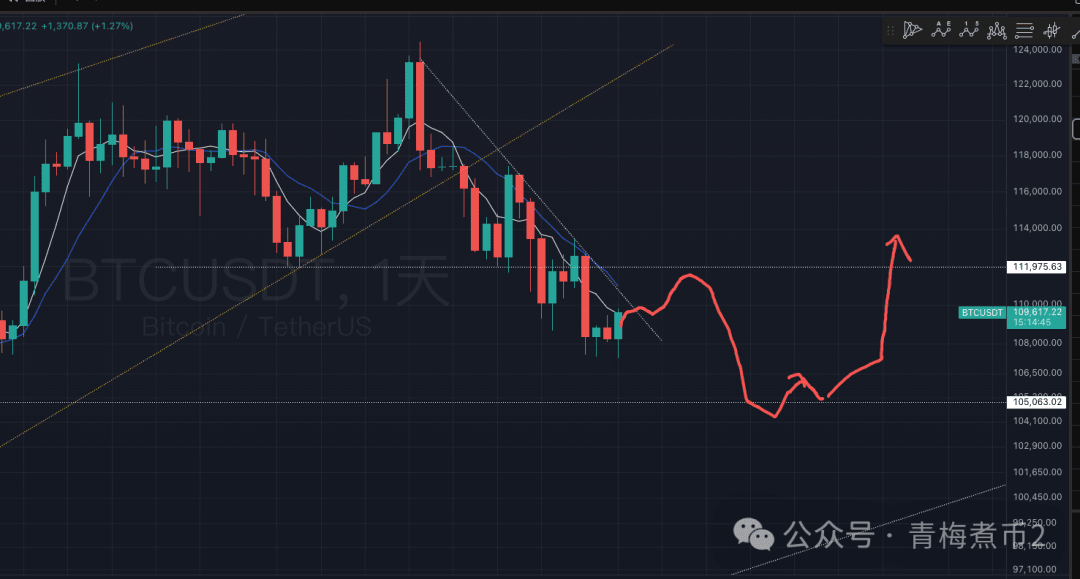
Speculation on the direction of Bitcoin: refer to my sketch, which suggests that Bitcoin's price may first rebound to test the resistance level around $112,000, with a low probability of breaking through directly. It is expected to crash down to create a new low, although the exact position of the new low is uncertain, followed by a V-shaped recovery, quickly returning to $112,000.
In summary,
Based on the poor performance of Bitcoin's monthly and weekly closes, the probability of Bitcoin reaching a peak is relatively high. Therefore, medium- to short-term operations should focus on fluctuations, and regardless of any rebounds that may occur later, one should look for exit positions.
---------------------------------

