Bitcoin’s multi‑timeframe picture remains bearish within descending channels, with RSI locked in a bearish range and EMAs acting as dynamic resistance; expect lower highs and continuation unless there’s a range‑shift with RSI holding above 50–60 and price reclaiming the upper channel/EMA band.
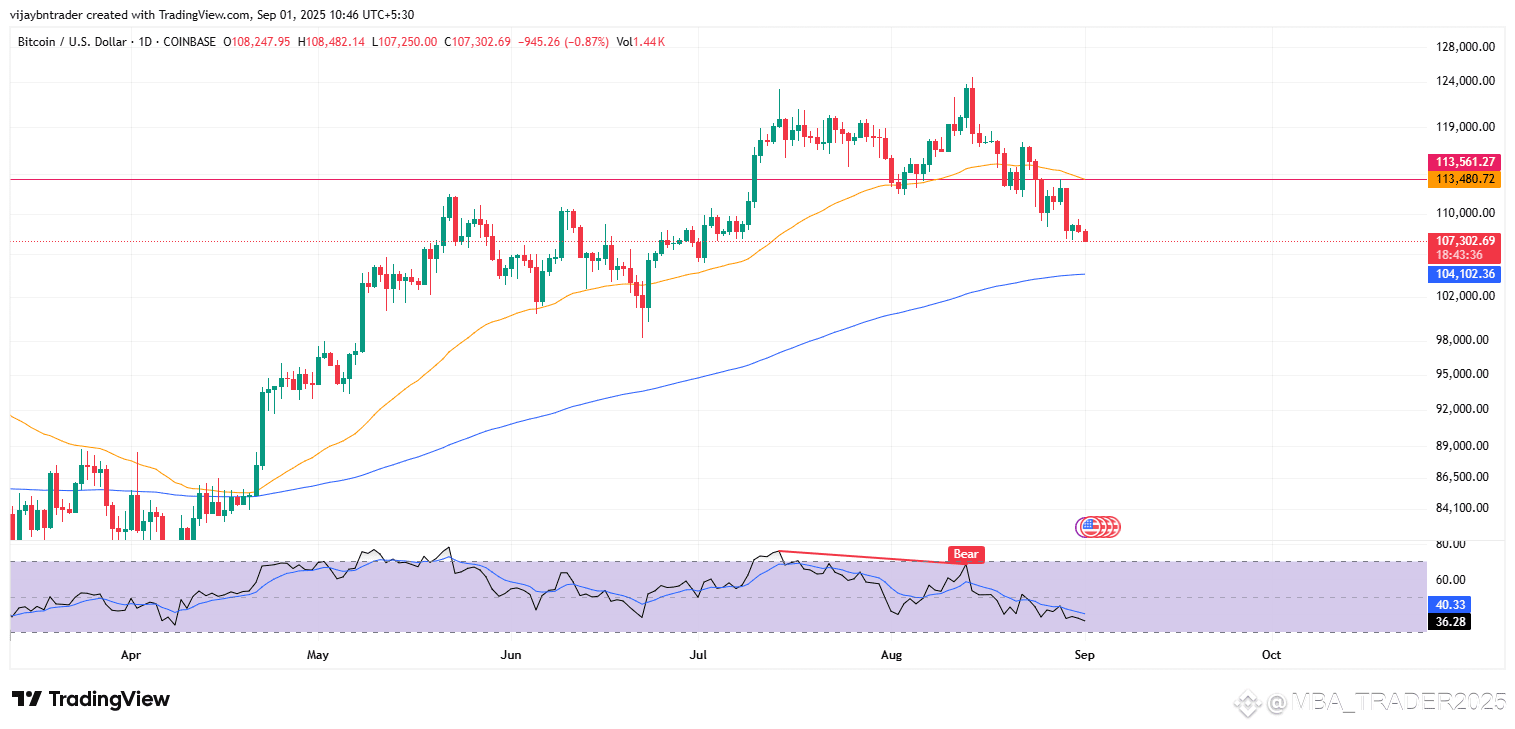
Daily
Price sits below the 50‑day EMA and well under the prior resistance band, shifting posture from buy‑the‑dip to sell‑the‑rip until the 50‑EMA is reclaimed on closing basis.
RSI is in the low‑40s and trending down; in bearish regimes RSI often caps beneath 60 and finds resistance near 50–60, implying bounces are likely to fade without a range‑shift back above the midline.
A constructive turn needs daily RSI back above 50 and a close back over the 50‑EMA; otherwise the bias favors retests of support toward the rising 200‑EMA on the larger trend.
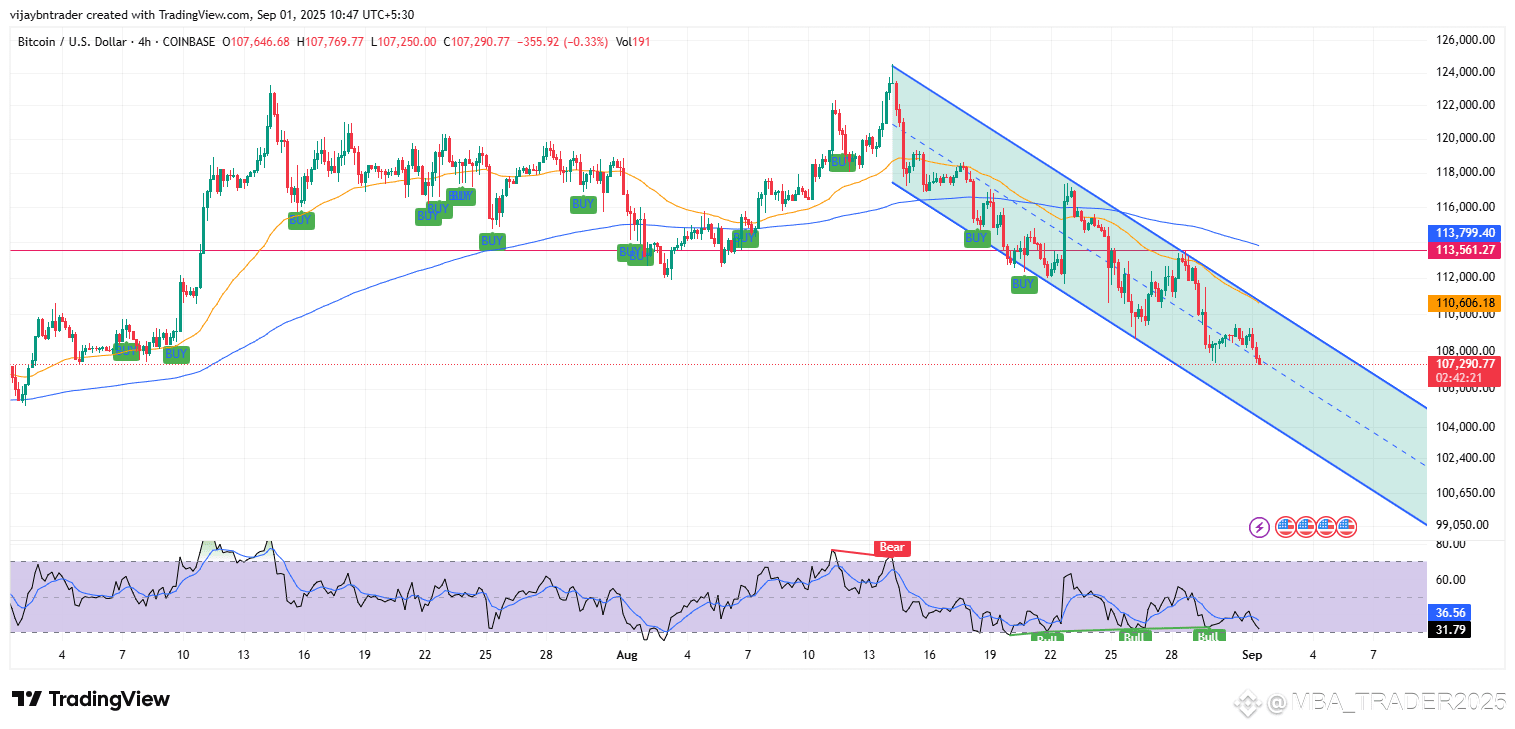
4‑hour
A clear descending channel governs price, and candles ride under the falling 50/200‑EMA stack—classic downtrend behavior where the EMA cluster is a high‑probability sell zone.
RSI oscillates between ~30–50, the bearish range that typically caps rallies below 60; this suggests limited follow‑through on bounces unless a bullish divergence forms at channel support.
High‑quality reversal signal would be: bullish RSI divergence at the lower channel plus a breakout and close above the upper channel and 50‑EMA, confirming a regime shift.
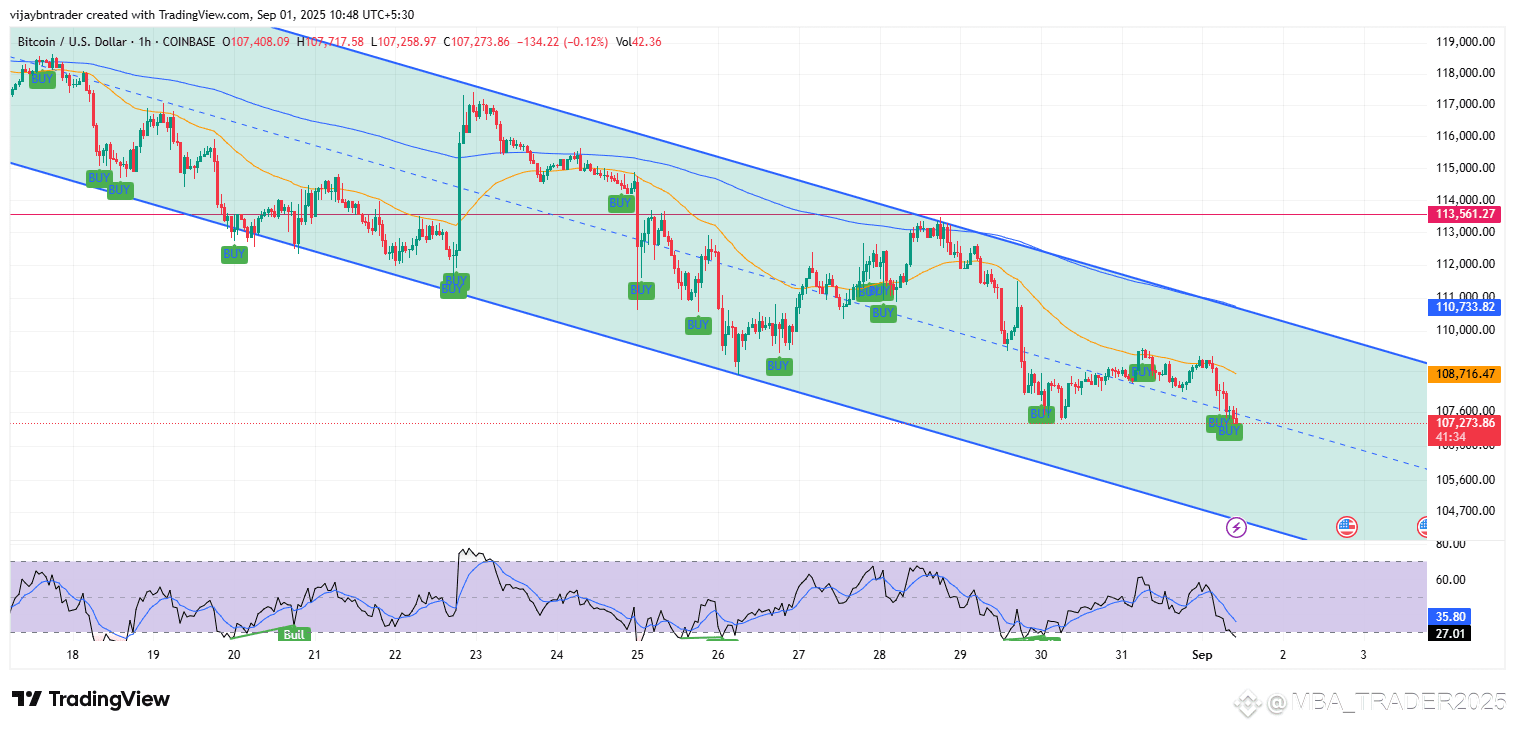
1‑hour
Price continues to respect a smaller descending channel with repeated rejections at the 50/200‑EMAs, reinforcing a sell‑rallies approach while below the upper boundary.
RSI recently slipped from the mid‑50s back toward 40, consistent with bearish range behavior where 60 acts as resistance and breakdowns often resume after midline failures.
For tactical trades, look to fade pushes into the upper channel/EMA band unless RSI can reclaim and hold above 50–60; otherwise continuation toward the lower channel is favored.
15‑minute
Intraday structure is also a descending channel, with quick rebounds failing at the 200‑EMA—typical of short‑covering within a broader downtrend.
RSI printed brief oversold bounces but stays mostly below 50; in downtrends, sub‑50 RSI and lower highs usually precede further drift toward the channel floor.
Scalping plan: Prefer shorts near the upper channel when RSI stalls under 60; consider only tactical longs at the lower boundary when RSI shows a bullish divergence and reclaims 50.
What would change the bias?
Multi‑timeframe range‑shift: RSI holding above 50–60 on 15m/1h/4h plus closes back above the respective 50‑EMAs, ideally with an upside break of the 4h channel—this combination often signals a trend transition.
Otherwise, continue to respect the descending channels: sell rallies into EMA resistance/upper boundaries; target midline/lower‑bound, manage risk above prior lower highs.
