The price of Ethereum has significantly dropped from the $4,950 range and is currently stabilizing around $4,430. Previously, ETH faced strong resistance in the major supply range between $4,900 and $5,000, which halted the recent upward momentum. Despite the pullback, ETH remains above the support level of the upward trend line, providing buyers with an opportunity to regroup and push higher again.
What has changed in the price of Ethereum?
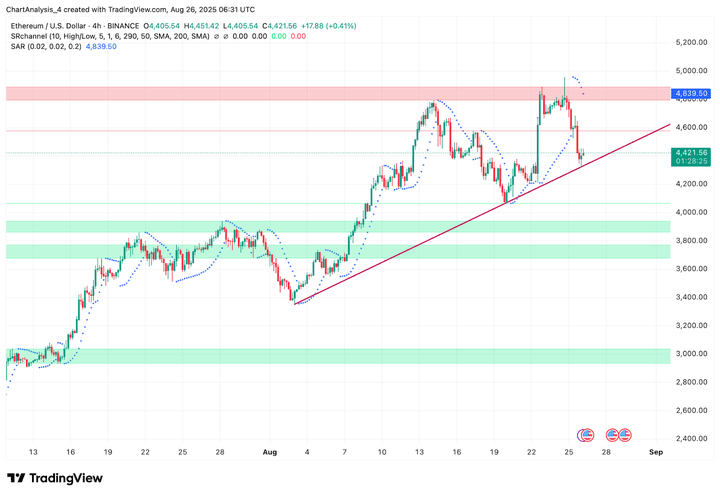
Ethereum has been in a long-term upward trend for most of August, rising from below $3,800 to nearly $5,000. On the 4-hour chart, ETH is still in an upward trend, with lows continuing to rise. The level of $4,400 is now a key turning point where the trend line intersects local support. The Parabolic SAR points remain above the price, indicating short-term bearish pressure, but the overall structure remains intact.
Why did the price of Ethereum drop today?
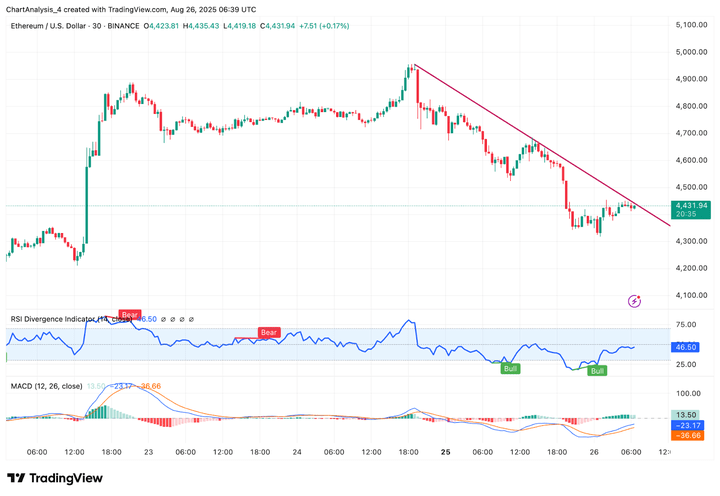
The current pullback in Ethereum's price is mainly driven by an oversupply near $5,000 and weakened intraday momentum. The 30-minute chart shows that the ETH price is constrained by a downtrend line, with the RSI at 46, reflecting that demand is cooling. The MACD line remains in the negative region, but its histogram shows early signs of flattening, indicating that bearish pressure may be weakening.
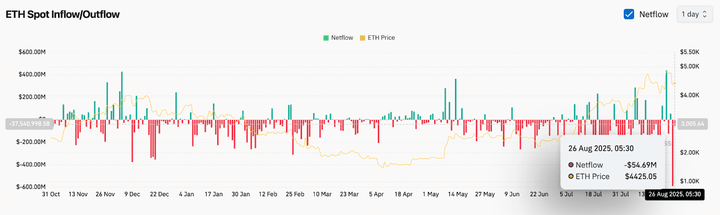
Spot inflow has also turned negative, with Coinglass data showing a net outflow of $54.7 million on August 26. This indicates a mild profit-taking after a strong rally earlier this month. While outflows usually reflect capital accumulation, the timing combined with technical pullbacks suggests traders are adopting a cautious stance.
Bollinger Bands, Super Trend, and Money Flow Index signals paused
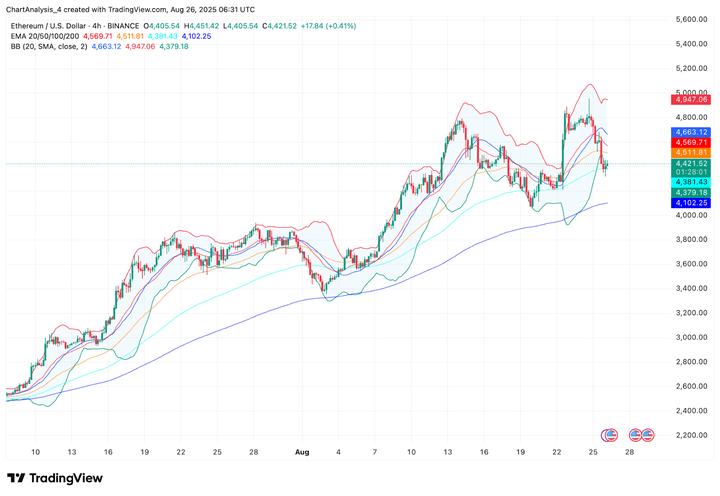
The Bollinger Bands on the 4-hour chart show that after the price retreated from the upper band at $4,947, it is testing the midline around $4,510. A closing price above this level would alleviate downside risks, but if it is blocked again, it could trigger new fluctuations. The 200-day moving average around $4,100 provides deeper support, while the 20-day and 50-day moving averages around $4,510 and $4,380 form the immediate decision-making range for traders.
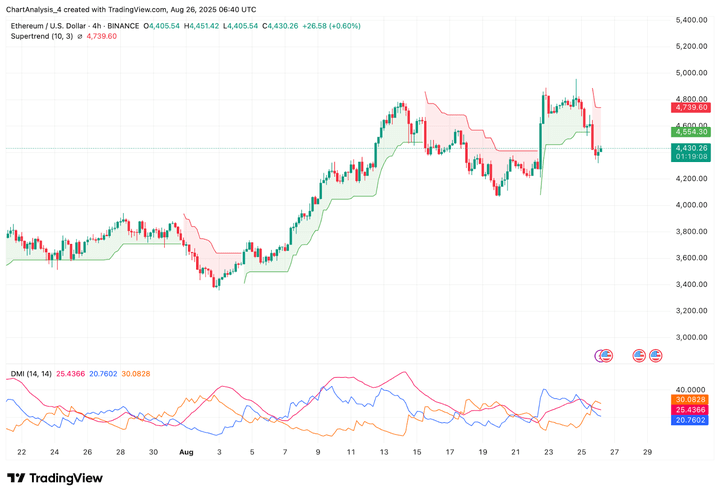
The Super Trend indicator remains bearish below $4,740, confirming the rejection area. Meanwhile, the DMI shows +DI and -DI are close to balance, with ADX flattening around 25, indicating a weak trend.
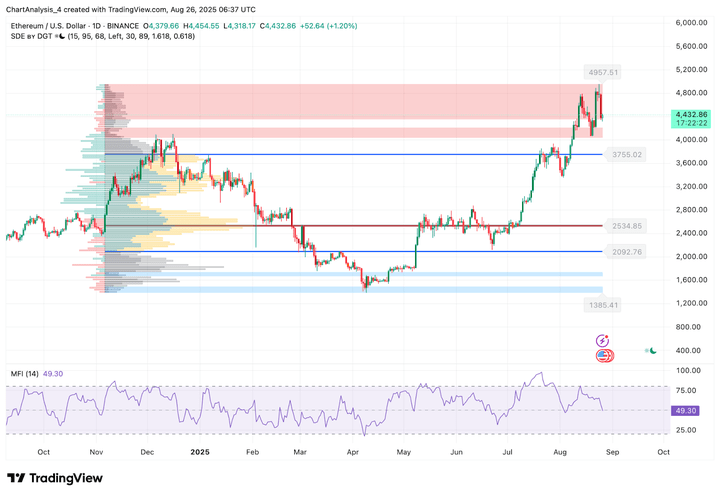
The Money Flow Index (MFI) on the daily chart is at 49, indicating that liquidity is neutral after a strong rise. This suggests neither strong inflows nor large outflows, consistent with the current consolidation trend.
Ethereum Price Prediction: Short-Term Outlook (24 hours)
If the price of Ethereum stays in the $4,400 to $4,380 range today, bulls may attempt to rebound to $4,600 and then retest $4,750. A breakthrough of $4,840 will reopen the door to $5,000, at which point liquidity remains abundant.
On the downside, if $4,380 is not held, it may drop towards $4,100, where the 200-day moving average will provide structural support. If the drop extends further, it may return to the highlighted $3,750 demand area on the daily chart.
Given the stabilization of the RSI, flattening momentum of the MACD, and mixed inflow data, ETH may consolidate in the $4,380 to $4,600 range before making the next decisive move. Traders should closely monitor the pivot point at $4,400 to determine whether the next wave of volatility favors buyers or sellers.
Ethereum Price Prediction Table: August 27, 2025
Indicator/Area
Level/Signal
Ethereum's price today
$4,430
Resistance 1
$4,600
Resistance 2
$4,840–$5,000
Support 1
$4,380
Support 2
$4,100
RSI (30 minutes)
46.5 (Neutral Bearish)
MACD (30 minutes)
Bearish, flattening
Parabolic SAR (4H)
Bearish, points above price
Bollinger Bands (4H)
Midline price at $4,510, slightly neutral
Super Trend (4H)
Bearish below $4,740
Money Flow Index (1D)
49 (Neutral)
Direct Investment (4H)
Flat, ADX close to 25
