ETH's current price is about $4,715, having quickly dropped from the $4,900 area. Earlier this week, ETH surged significantly, breaking above a bullish channel and briefly testing new highs above $4,950. However, momentum has weakened, and sellers are attempting to further test important support levels. Over the next 24 hours, whether Ethereum's price retraces or drops to the $4,500 to $4,550 range will be crucial.
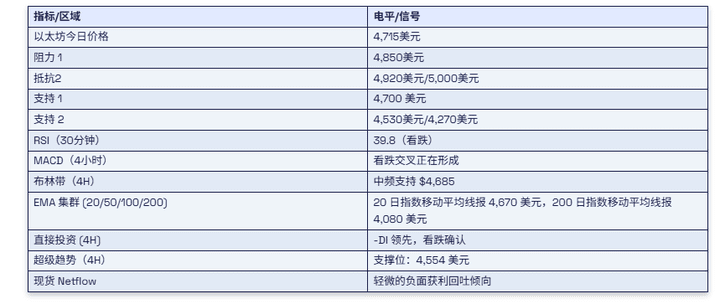
Ethereum Price Prediction Table: August 26, 2025
What changes have occurred in Ethereum's price?
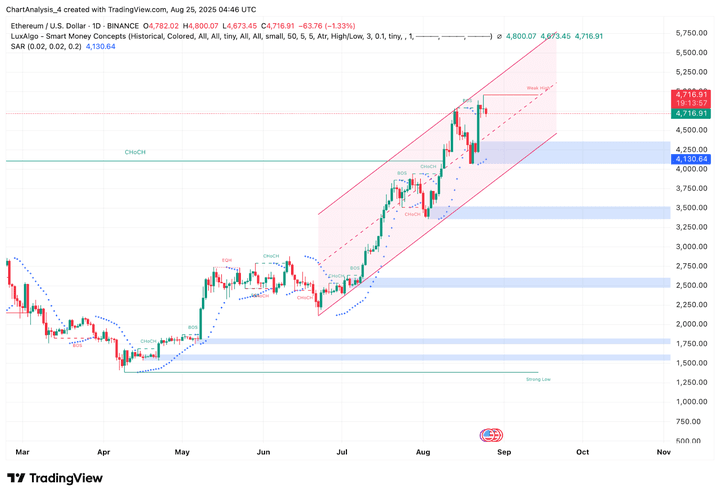
Since mid-July, Ethereum's price has been rising in a steep channel, climbing from $3,500 to last week's high of about $4,950. The daily chart still shows this structure, but the recent pullback indicates that the price may weaken in the short term. The top of the channel (around $4,900) was a resistance level, while the midline of the channel (near $4,700) is currently a support level.
The smart money concept level indicates that the recent Break of Structure (BOS) is near $4,950. The current price is retracing, testing the liquidity cluster between $4,680 and $4,720. The Parabolic SAR indicator has also broken the price, supporting a corrective tone.
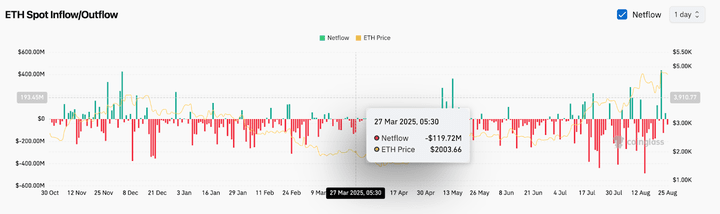
Coinglass's tracked spot inflow has also slightly turned negative, indicating a moderate profit-taking following the recent rally, which typically suggests a decline in buyer confidence and a potential pause in upward momentum.
Why did Ethereum's price drop today?
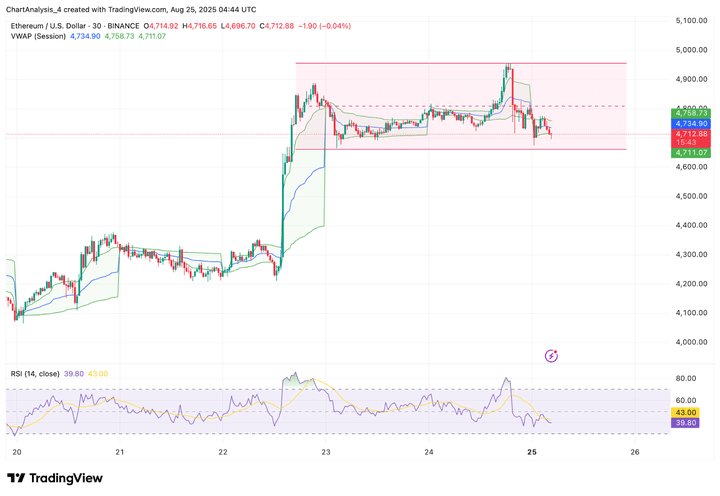
The reason for Ethereum's price drop today lies in the weak technicals and reduced capital inflows. On the 30-minute chart, ETH dropped below the volume-weighted average price (VWAP) and consolidated below $4,750, indicating weakening buying pressure. The RSI has dropped to 39.8, reflecting bearish momentum following the overbought surge earlier this week.
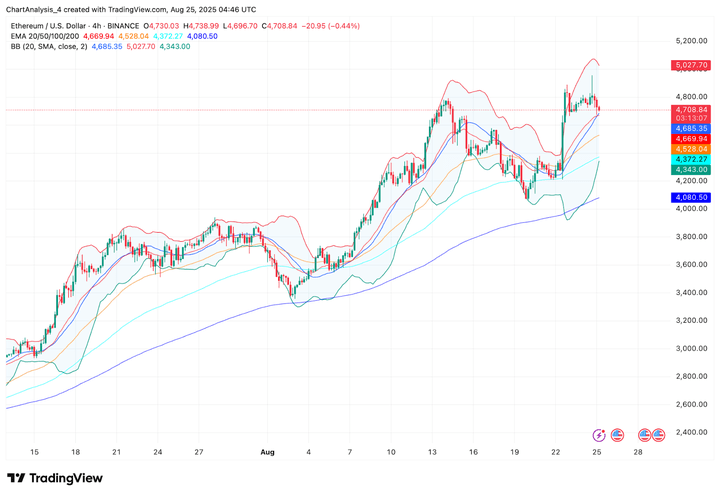
The 4-hour EMA cluster shows mixed movements. ETH remains above the 20-day EMA ($4,670) and the 50-day EMA ($4,528), but momentum is flattening. A drop below the convergence point of the 20/50 EMA could trigger a price acceleration up to the $4,350-$4,400 range. In the 4-hour timeframe, the Bollinger Bands show the price broke above the upper band near $5,027 and retraced to the mid-band at $4,685.
Indicators show momentum cooling
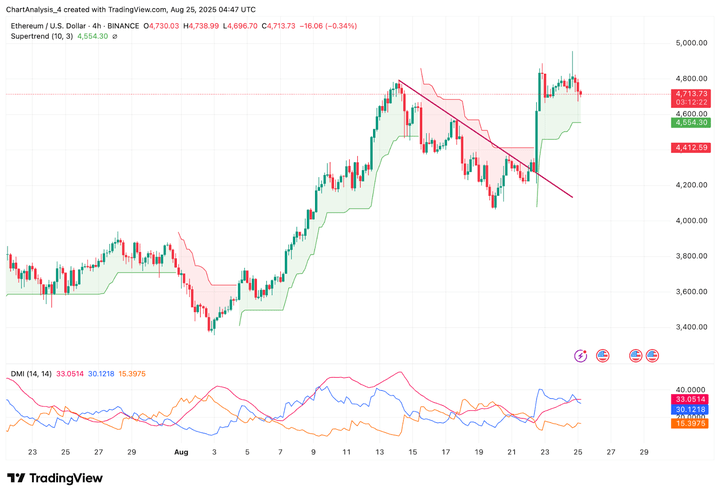
The Super Trend support level is around $4,554, so bulls must hold this level. A close below this level could trigger further declines. Meanwhile, the Directional Movement Index (DMI) shows that -DI has crossed above +DI, confirming recent bearish pressure.
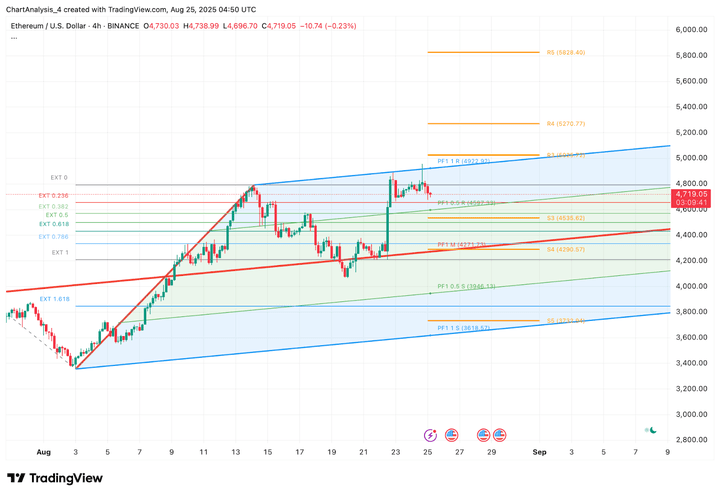
Fibonacci retracement levels highlight key downward resistance at $4,530 (0.382) and $4,270 (0.5); if the current price breaks below these levels, they could become critical downward resistance. Despite the pullback, the weekly chart still shows Ethereum maintaining a healthy uptrend above $4,100. As long as the ascending channel remains stable, the macro trend remains bullish, and once consolidation ends, $5,200 and $5,500 will still provide effective support.
ETH Price Prediction: Short-Term Outlook (24 Hours)
In the short term, Ethereum's price volatility may continue to rise. If it holds above $4,700, ETH may retest $4,850 and $4,920, reopening the path towards $5,000. However, if it drops below $4,700, bears may extend the correction to $4,530 or even $4,270.
Derivatives data continues to show an increase in open interest, indicating that leveraged traders remain active. This increases the likelihood of significant market volatility, especially if ETH breaks below support and volume increases.
Currently, bulls must reclaim $4,750 to regain momentum, while a loss of $4,680 would lean towards a deeper retracement.

