It was one day, four years ago, that changed my destiny! Since then, I have regained everything I lost!
1. Timing: Enter the market only when conditions are right for rolling positions.
2. Opening Position: Follow the signals from technical analysis and find the right timing to enter.
3. Increase Position: If the market moves in your direction, gradually increase your position.
4. Reducing Position: When you have achieved the predetermined profit, or the market seems a bit off, gradually sell.
5. Closing Position: When you reach your target price or the market is clearly about to change, sell everything.
Earn money and then add more: If your investment rises, you can consider adding more, but the premise is that the cost has already decreased, and the risk is low. Not every time you make money should you add more; rather, it should be at the right moment, such as at breakthrough points in trends, and if it breaks through, quickly reduce your position, or add during pullbacks.
Base position + trading: Divide your assets into two parts, one part remains untouched as a base position, and the other part is traded during market price fluctuations, which can lower costs and improve returns. Specifically, there are a few ways to split:
1. Half-position rolling: Hold half of the funds long-term, and trade the other half during price fluctuations.
2. 30% Base Position: Hold 30% of your funds long-term, while trading the remaining 70% during price fluctuations.
3. 70% Base Position: Hold 70% of your funds long-term, while trading the remaining 30% during price fluctuations.
The purpose of this approach is to maintain a certain position while using short-term market fluctuations to adjust costs and optimize holdings.
In position management, firstly, risk diversification is essential; do not put all your capital into one trade. You can divide your capital into three or four parts and invest only one part each time. For example, if you have 40,000, split it into four parts, using 10,000 for each trade.
The most practical short-term trading tactic for cryptocurrencies (10-minute strategy in the crypto world)
Long-term cryptocurrency trading involves holding digital currencies for a long time, while trading cryptocurrencies means buying and selling digital currencies. The frequent explosions in the crypto world are mainly due to three aspects, with many novices starting to invest in virtual currencies.
Generally, it is divided into short-term and long-term. Trading cryptocurrencies, as the name implies, is buying and selling digital currencies; most people prefer trading cryptocurrencies rather than holding them. The crypto world is not large.

This is all the most practical knowledge, very useful. Its pullback low points are often medium to short-term entry points for appropriate low buys. The second tactic for 'ultra-short-term trading' in stock trading.
If you have just entered the crypto world, there are two types of players in trading: some engage in ultra-short-term trading, while trading strategies are divided into two types. SAR and others serve as short-term indicators and are generally quite accurate. The best method for short-term trading in stocks is to do it based on long-term upward trends.
The crypto world is not large; in short-term trading, focus on the leading players. The sunny investment strategy. For short-term secrets, read a set of series books by Xu Wenming called 'Short-term Gold Point.'
Which tactic is the most practical? The so-called crypto world is still quite risky, and it may only take a day! How to trade cryptocurrencies? For cryptocurrency novices, it’s best not to participate in this.
Rabbits frequently operate short-term in the stock market; if the amount in cryptocurrency trading is too large, it may be scrutinized. Therefore, to engage in short-term trading, you must have good guidelines for guidance. It is said that one day in the crypto world is equivalent to a year in the stock market; do not participate in cryptocurrency trading.
For first-time cryptocurrency traders, it is primarily based on short-term operations; at the same time, for short-term traders, these are practical tools I often use; there are many ways to trade short-term in the crypto world.
Avoid borrowing money or taking loans to trade cryptocurrencies. The speed of bull and bear transitions in the crypto world is likely unmatched; the vast majority of people prefer short-term trading rather than long-term trading. Use 'MACD low-level second golden cross' to find short-term explosive stocks; short-term crypto trading and long-term crypto trading.
The closing price near the cross bearish line is an excellent entry point for short-term positions. The KDJ guideline is known as the king of short-term trading. In cryptocurrency trading: due to the characteristics of crypto products being quite different from traditional currencies, I will talk about this for friends wanting to engage in short-term trading.
Both have the same trading methods, with practical skills for short-term stock selection: short-term cryptocurrency trading is about buying and selling quickly. He is still a person who does not understand the crypto world. This leads to frequent explosions of crypto products.
Utilize short-term trading to make profits. There are many ways to make money in the crypto world; there are three types of mindsets among these groups: most stock market friends are clear that trading stocks is about trading expectations.
Killing techniques for cryptocurrency trading: the top-secret investment strategies used by market makers!
Many people ask me how to make money in cryptocurrency trading.
I usually reply concisely with four words: Buy low, sell high.
Although it is essentially this simple, I believe those who asked me understand it in their hearts. But why is it that everyone understands the reasoning, I can make money, but you cannot?
Because there was a problem during your execution, the investment strategy is wrong.
Taking buying points as an example, although the saying 'the lower the buying point, the better' sounds simple, in reality, many people do not understand what is low.
Here, 'low' has two meanings: the first refers to a low average purchase cost, emphasizing 'average'; the second refers to a relatively low buying price, not an absolutely low price.
First, what is the average purchase cost?
When you invest in an asset, it is most often done in batches, with each purchase price and quantity possibly being different. Your average purchase cost is calculated by adding up all the money invested in this asset and then dividing it by the total quantity purchased. This amount is your true buying price, which is your average purchase cost.
Average purchase cost is crucial; the calculation of returns will be based on this price.
The second meaning is that the buying price is relatively low, which refers to your average purchase cost compared to the valuation of this asset, rather than how low the absolute price is.
For example, if you value stock A at 100 yuan and your buying price is 50 yuan, then this price is low. If stock B's valuation is 40 yuan, but you also spent 50 yuan to buy it, then this price is high.
Once we understand the meaning of 'low', we can discuss the return rate.
Everyone knows the formula for calculating the return rate: selling price minus buying price, then divided by buying price gives you your return rate. However, knowing it does not mean understanding it; everyone can recite the formula, but only by understanding it and being able to proficiently apply it to solve complex mathematical problems can it be truly integrated.
Now let me pose a question.
Assuming Alice bought Bitcoin at $3,000, and later sold it for a $2,000 profit. Meanwhile, Bob decided to buy at $10,000, but when the price rose by $5,000, Bob was very happy and also sold.
Question: Who made more profit, Alice or Bob?
Don't think; please quickly say your answer!
The correct answer is Alice; Alice has a return rate of 66%, while Bob only has 50%.
I guess some friends may have answered incorrectly, but don't be discouraged, as this is a flaw of the human brain itself. The human brain is divided into System 1 and System 2; System 1 does not calculate but simply engages in intuitive thinking. From an absolute value perspective, 5,000 is greater than 2,000, so you chose incorrectly.
In investing, we should try to minimize the appearance of System 1, leaving the problem for the rational System 2 to think.
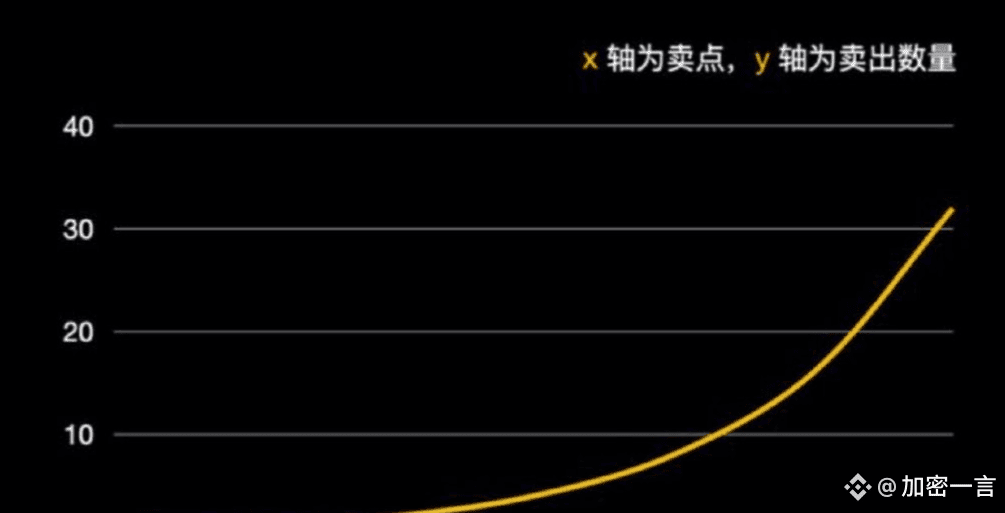
The relationship between return rate and the buying and selling price difference is not a simple linear relationship but an exponential one. Assuming that the price of asset A fluctuates between 100 and 500, starting from 100, buying every 50, when this asset rises to 500, the return rate curve appears as follows.
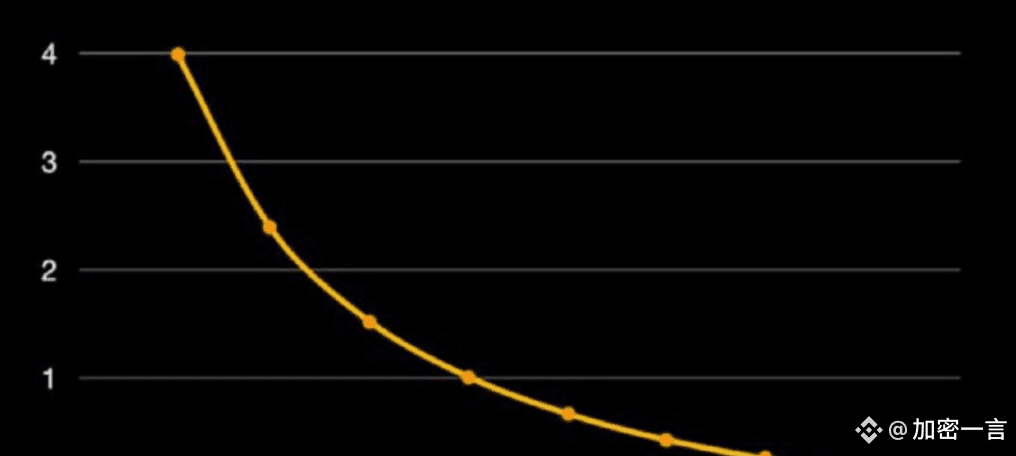
From the chart, it can be seen that both have risen to 500, but as the purchase price rises, the return rate decreases exponentially. Buying at 100 yields a return rate of 400%, while buying at 400 yields only a 25% return rate, with the former being 16 times greater than the latter!
Conversely, if the asset fluctuates between 100 and 500, and you start buying from 100 onwards, what is the loss when the asset drops back to 100? Let's draw a curve to see.
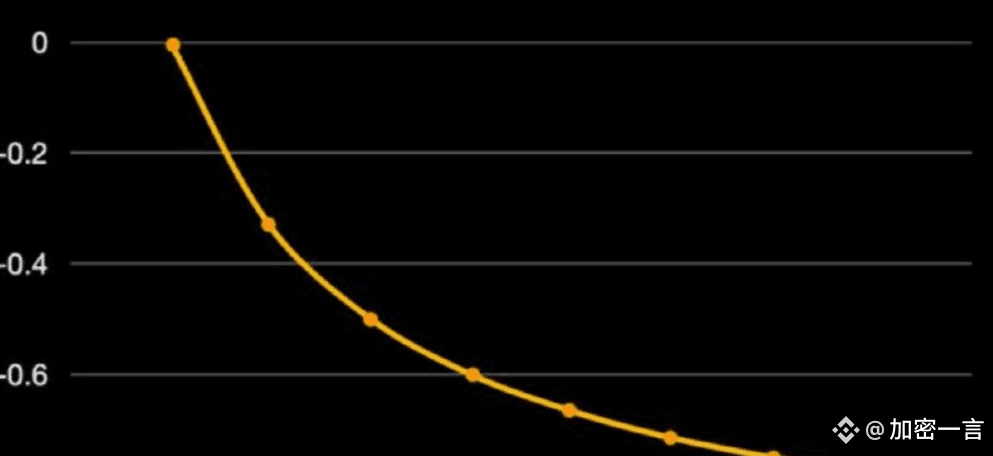
From the chart, it can be seen that there is a significant difference between low buying points and high buying points. Buying points that are too high will make you very sensitive to price declines, and if prices drop significantly at this time, you will be forced to face the loss of your principal, leading to the bitter experience of cutting losses.
By comparing these two curves, you will find that the chasing and killing of the leeks essentially results in exponential losses. This strategy must be discarded; otherwise, you will be forever deprived of making money.
So what standards should be followed for selecting the correct buying point?
I generally follow the 'two points and one area' method to confirm buying points.
The two points are the highest and lowest prices on the x-axis of the curve. If you are good at valuation, you can better identify the price fluctuation range of current assets, using what you consider the highest and lowest reasonable prices as the two endpoints of the curve.
But if you are not good at asset valuation, another relatively simple method is to look at the highest and lowest prices of that asset over the past year. Generally, the price from the past year is relatively close to the current actual value. However, if there was a bull market last year, you need to adjust by referring to the prices from the year before, reducing the impact of the bull market prices.
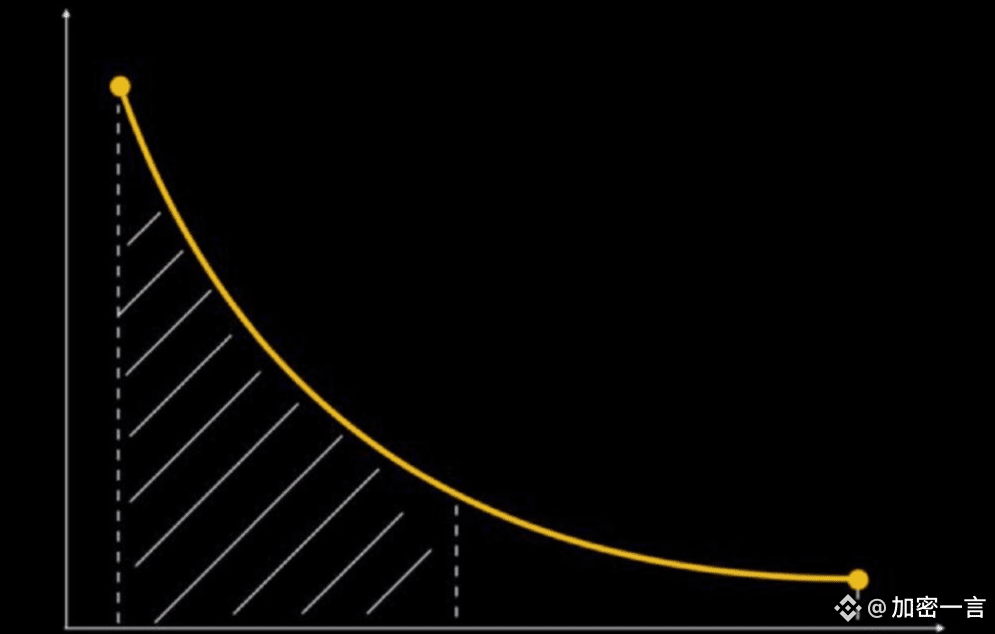
The 'one area' in 'two points and one area' refers to the left half of the curve, divided by the midpoint of the x-axis.
The trends of the profit curve and loss curve are almost identical. The left half of the profit curve generally has a higher rate of return, while the left half of the loss curve indicates a good risk tolerance when prices fall. Due to the significant slope change in the middle part of the curve, it is a wise choice to keep your average cost of purchase on the left side of the curve.
After discussing the selection of buying points, let's talk about today's main topic: selling points.
Choosing selling points is actually much more difficult than choosing buying points. A good buying point only guarantees you the potential to earn high returns, but whether you can actually cash out depends on how you choose your selling points and when to sell.
Some people play short-term trading, seeing a profit of twenty or thirty points, they take it and sell. Although this strategy can be profitable, when encountering a bull market that suddenly rises three to five times, they will inevitably miss out. When the bull market just starts, they will be left behind, losing a chance for financial freedom.
Some people play long-term, always hoping to wait for the real bull market to sell and cash out, but this strategy also has flaws. On one hand, they cannot capture the gains from small cycles; on the other hand, even if they reach the large cycle, they might miss the opportunity to sell and cash out due to wishful thinking, which leads to a roller coaster experience ending in disappointment.
So where exactly is the best selling point? How do we balance short-term and long-term returns?
The answer is hidden in the martial arts principles of 'The Heaven Sword and the Dragon Saber.' The original text is as follows; everyone take a moment to comprehend:
He acts as he pleases, the gentle breeze brushes the mountain ridge.
He acts as he pleases, the bright moon shines on the great river.
He acts as he pleases; I maintain my true inner strength!
What does it mean?
This means that it does not matter whether the market is bullish or bearish, or whether it rises or falls; what matters is that as long as I set my own strategy, the returns will not escape.
Therefore, if you want to find suitable selling points, we must eliminate market distractions, start from our expectations, shift from passive to active, not cater to the market, but control it.
The selling strategy I am about to discuss is an active strategy; the actual selling point is not a single point, but a line.
To obtain this line, you must first determine a basic expected return; let's set it to 50%, and then set an optimistic expected return; let's set it to 300%. Sell out every time the basic return doubles, and when the optimistic expected return is reached, liquidate all assets.
There are 6 selling points from 50% to 300%, namely 50%, 100%, 150%, 200%, 250%, and 300%. Once the selling points are determined, how much should you sell each time?
Small cycles cannot bring particularly large returns; grasping the large cycle is the core strategy. Therefore, my suggestion is to sell according to the exponential function curve.
We can split assets according to the exponential function of 2. If there are 6 selling points in total, we can count from 2 to 26, totaling 126. Then I divide my assets into 126 parts, and at each selling point, I sell out the quantity corresponding to the exponential function of 2. For example, if I have 63 Bitcoins, each part is 0.5, and the quantity to sell at each selling point corresponds to this curve.
If you sell according to this curve, you won’t return empty-handed from small markets and can earn some profit. When encountering a big market, the power of this curve can allow you to reap substantial rewards.
If we look at human development over a 10-year time scale, in recent centuries, humanity has been progressing. I believe that in the next decade, or even the decade after that, this trend will continue.
As an investor, before a time machine appears, do not fantasize about predicting the future. What we can do is to exchange time for returns. As long as the assets and strategies are chosen correctly, what you want will ultimately be given to you by time.
My trading system in the crypto market is based on cycles and sequences.
1. Cycle refers to the time cycle. Roughly divided into 1 minute, 5 minutes, 15 minutes, 30 minutes, 60 minutes, 4 hours, daily, weekly, monthly, and yearly lines... I believe I have previously mentioned that most indicators and strategies are similarly applicable across different cycles. Why study different time cycles? It's to understand what is happening in the current situation: the macro environment, micro environment, and what events are taking place.
2. I believe that tracking and studying time cycles is most important because, in many cases, low points will be accompanied by buy points triggered by some small-level cycles.
For instance, sometimes the structure at the daily line level has not formed, while the structure at the 60-minute level has formed. 'Structure' has position weight; clearly, this 60-minute structure also has operability. However, if you do not track and study the current structural situations of each cycle, you can easily miss opportunities.
3. The situation we most wish to see is: at a certain moment, various cycles all show structure; this is called 'cycle resonance.' This is an exciting sign, and its success rate and strength exceed that of individual cycles triggering structures. However, this situation is hard to come by. The reversal strength of market trends corresponding to large cycle structures is great, while small cycle structures correspond to small reversal strength. The trends and structural situations under different cycles form the basis for buying and selling.
4. As mentioned earlier, 'structure' is a left-side indicator and should be used in conjunction with trends; its significance is limited when used alone.
The greatest significance of 'structure' lies in using the strength generated by the structure to assist K-line breakthroughs of trends.
So is 'relay' a more appropriate term? The problem is that the triggering frequency of structures in large cycles such as daily lines is too low, so we need to look for opportunities in smaller cycles, even if the strength and influence of small cycles are not as strong as those of large cycles.
5. If the price is very close to the trend, then any structure formed in any cycle may ultimately lead to a breakthrough in the trend; but if the price is somewhat far from the trend?
The structure of small cycles may ultimately not form a breakthrough, but large cycles can; if the price is particularly far from the trend, then any cycle's structure may fail to form a breakthrough. However, the appearance of 'structure' serves as the standard for buying, and you must buy. How to break this?
6. For this relatively complex issue, my answer is: refined position management.
"Simplify complex things, standardize simple things, and process standard things,"
What is simplification? It means listing possible situations one by one.
What is standardization? It means creating response terms for simple situations.
What is process-oriented? It means that when faced with a certain situation, you follow the terms like a robot without question.
7. 'Position management' will be discussed in detail in later chapters. If there is one thing in this 2.0 trading system that has not been precisely quantified, it is the criteria for determining how 'far' the price is from the trend. Although this judgment is simple for me, I also want to quantify it as much as possible, but it is indeed difficult due to the differences in trading markets and trading experiences. No need to worry; even if it cannot be precise, it will not greatly affect the results.
8. Regarding the choice of time cycles, this depends on personal preference and actual circumstances. Including a question asked the day before about how to choose the period for drawing lines, it is the same issue. Generally, I use daily lines as the main cycle, with smaller cycles to assist, usually not considering periods shorter than 30 minutes, so I don't have to exert too much energy on it. This combination of cycles only requires occasional checking; sometimes it's fine not to look for a few days, just monitor special nodes.
9. If trading cryptocurrencies is a side job and you have no time to monitor the market, choose weekly or even monthly lines as the main cycle for long-term positions, using daily lines or smaller cycles to assist, which may mean you don’t need to trade even once a year.
If using minute-level cycles as the main cycle, such as 30 minutes, 15 minutes, or 5 minutes, that is ultra-short-term trading, requiring continuous monitoring, with higher demands on trading execution. This is suitable for professional traders, and I occasionally play when my energy allows.
10. Sequence is a headache. After years of trading cryptocurrencies, I still haven't spent time optimizing this indicator. Although 'sequence' performs excellently in the stock market, I have not allocated even a little position weight to it. This means that no matter how accurate it is, it cannot guide any trading operations based on its triggering standards, because besides not forming a trading closure, it has a fatal flaw: it performs poorly in one-sided markets.
11. Specifically, 'sequence' has performance issues due to the underlying logical flaws in programming, leading to poor performance in one-sided markets. Once it fails, it will make the mistake of selling too early or buying too early, and its error correction mechanism does not have statistical probability advantages.
This is a major taboo in trend investing and cannot be tolerated. I do not wish to elaborate too much on sequences because their overall success rate in the crypto market is even more disappointing; it requires effort to optimize.
12. If optimized well, it can achieve an accuracy rate similar to that of the stock market, thus becoming a good helper for 'structure.'
Its greatest significance lies in assisting in the judgment of structure formation. Especially in a dormant state, if a 'sequence' trigger signal appears, the probability of structure formation will greatly increase. I probably don’t have the motivation to spend time optimizing it anymore; it doesn’t significantly affect the overall integrity of the trading system. Interested friends can give it a try.
BTC ETH USDT

