Today, I speak sincerely, every word is true! I have been trading coins for 10 years; in the first three years, I continuously lost, reducing my 300 yuan principal to 30,000 yuan! It was truly painful! My wife and family did not support or understand! Later, I quit my job and devoted all my energy to it! Every day I was busy exploring and summarizing! Now I can finally achieve stable compound interest, and my account has regained over 40 million yuan!
In addition to solid techniques, I would like to share nine super trading rules with everyone, hoping to inspire newcomers in the coin circle and help them avoid detours! Grow by standing on the shoulders of giants! If you learn this, you can achieve doubling your investment!
1. Avoid revenge trading.
When a trade is closed, whether it is profitable or losing, it is necessary to firmly adhere to the rules. After executing a stop-loss, try not to check it within 24 hours. This can effectively prevent revenge trading, as opening a position with a vengeful mindset is likely to expand losses. Some believe that you should rise from where you fell, but it is more important to calmly observe before new entry conditions are triggered. Since traders view charts for several hours daily, after a stop-loss, it is difficult to resist the temptation to open a new position to salvage the situation. This especially applies when using leverage for swing trading, where a revenge mentality must be avoided.
2. Try not to participate in trading on weekends.
Every weekend, the volatility of cryptocurrency prices increases, and trading volume is small. This makes it difficult to predict short-term price trends. The reason is simple: weekend buy and sell orders are usually small, and market liquidity is low, making it easier for whales to manipulate short-term prices, which makes the disadvantages of retail traders more pronounced. Additionally, since the cryptocurrency market operates 24/7, the intensity of trading is much higher than in the stock market, while weekends are a good time to relax and rest, as life is greater than trading.
3. Maintain trading at specific times.
As mentioned earlier, the cryptocurrency market operates 24/7 and never stops. Even full-time traders cannot keep an eye on the market all the time. To maintain a clear mind, you can set fixed trading times for yourself. After opening an order during trading time, set stop-loss and take-profit levels, then you can go do other things. This eliminates the impulse to constantly check your phone or study K-lines, allowing trading to not affect your normal life.
4. Do not develop feelings for a particular asset.
If you become emotionally attached to an asset you are trading, it can easily lead to poor decision-making. Excellent traders leverage efficiency and rules to earn money, giving themselves an advantage, as most people's trading behavior in the market is driven by emotions. 'Be a trading machine without emotions' can ensure decisiveness and adherence to principles in trading. Many traders suffer significant losses primarily because they easily become emotionally attached to certain altcoins, teams, or projects. This may be acceptable for medium to long-term investors, but it poses a potential disaster for short-term traders.
5. Maintain simple trading rules.
Traders usually combine multiple indicators, news, and K-line patterns to try to find suitable convergence points for trading. This in itself is not a problem, but be careful to avoid over-analysis, which complicates issues. In fact, when a K-line pattern suitable for one's own system appears on the chart, trading can begin. At the same time, it is crucial to set stop-loss levels and control positions.
6. Only trade with the correct mindset.
When you feel angry, tired, or stressed about something, do not trade; your mindset will affect your judgment. The key to maintaining a good mindset is to have other daily activities outside of trading. For example, fitness, reading, spending time with family and friends, all of which help cultivate the correct trading philosophy.
7. Keep a trading diary.
Reviewing trading diaries can be tedious, but it is actually very meaningful because it helps you avoid making the same mistakes. There are specific reasons behind each profitable and losing order; recording trading details is a way of learning and can help you grow rapidly.
8. Do not attempt to catch flying knives with bare hands.
The term 'catching flying knives with bare hands' refers to traders attempting to buy the dip of assets during a crash. The motivation for buying the dip is usually to lower the cost price and compensate for losses incurred due to a significant drop. Attempting to precisely catch the bottom during a crash is unwise. Waiting for stabilization and rebound, when resistance turns into support, is a more prudent approach.
9. Do not ignore extreme market conditions.
While referring to technical analysis indicators, do not neglect black swan events or other extreme market conditions. After all, the market is driven by supply and demand, and sometimes the market is extremely unbalanced.
Trading is a long-term practice. If you want to make a living from trading, you must follow the rules and build your own trading system!
So how to do well in trading coins? Once a person enters the financial market, it's hard to turn back. If you are currently losing but still confused and plan to treat trading coins as a second career in the future, you must understand the 'simplest MACD strategy.' Understanding it can save you a lot of detours. These are personal experiences and feelings, it is recommended to collect and ponder repeatedly!
The MACD indicator is the most classic technical indicator among all technical indicators. When this indicator is used correctly, by combining K-lines (daily K-line, weekly K-line), individual stock trends, volume, overall market trends, and news of both positive and negative impact, one can basically achieve good buying and selling results. Below, I will share the most comprehensive usage of the MACD indicator; only those who truly understand can be considered experts, and I will only share this once!
The general judgment standards for the MACD indicator mainly revolve around the conditions and shapes of the fast and slow moving averages (DIF and DEA lines) and the red and green bars (MACD bars). General analytical methods mainly include the position of DIF and DEA and their crossover situations, the contraction of red bars, and the shape of the MACD graph, which can be analyzed in four major aspects.

1. MACD is the most commonly used indicator by experts.
The role of the MACD indicator in technical analysis is extremely special. It can be said to be an indispensable part of learning technical analysis. Its importance includes at least the following points:
The MACD indicator is the most effective technical indicator tested by historical trends and is also the most widely used indicator.
The MACD indicator is derived from the moving average indicator EMA and has a very good application effect in capturing trending markets. Trend investors generally refer to this indicator in practice.
The top and bottom divergence of the MACD indicator is recognized as the best method for 'buying low and selling high.' This method is an important tool for the concretization of trend theory and wave theory.
Many veterans have had this experience: when they first entered the field, they started learning the MACD indicator, then gradually discarded it, and after a long time of study and comparison, especially after practical tests, they eventually returned to the MACD indicator. This shows the uniqueness of this indicator.
The application of the MACD indicator in quantitative trading is also extremely widespread.
It is precisely because of these advantages that the MACD indicator has become the most commonly used technical indicator among professional traders.
Second, the concept and calculation of the MACD indicator.
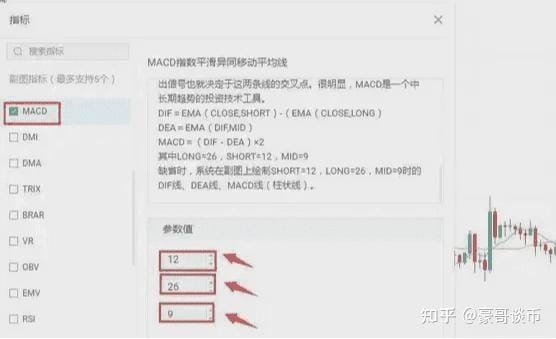
The MACD indicator, also known as the Exponential Moving Average Convergence Divergence indicator, was created by Gerald Appel to track price trends and analyze buying and selling timing in K-lines. This indicator is a common indicator in market software and is known as the 'king of indicators.' As shown in [Figure 1].
The MACD indicator in the cryptocurrency market consists of the DIF fast line, the DEA slow line, the MACD bar line, and the zero axis, referred to as 'three lines and one axis.' Investors analyze price trends through the crossovers, divergences, breakthroughs, support, and resistance of these 'three lines and one axis.' The MACD indicator has become...
Many market software list it as a preferred indicator, indicating its wide application. This also indirectly shows that this indicator is one of the most effective and practical indicators tested by history.
Three, the golden cross and death cross of MACD.
The 'golden cross' shape and the 'death cross' shape are extremely important shapes in technical indicator analysis.
The golden cross shape, also known as the golden crossover, refers to the situation where the shorter-period indicator line crosses upward and surpasses the longer-period indicator line (of the same type), often indicating the emergence of short-term buying opportunities. If the golden cross appears...
①. After a short-term rapid decline during the downward trend;
②. After a pullback during the upward trend;
③. After a consolidation trend during the upward trend;
Thus, when the golden cross shape appears at a stage low point, it is a more reliable buy signal.
The death cross shape, also known as the death crossover, refers to the situation where the shorter-period indicator line crosses downward and surpasses the longer-period indicator line (of the same type), often indicating the emergence of short-term sell opportunities. If the death cross shape appears...
①. After a consolidation trend during the downward trend;
②. After a rebound during the upward trend;
③. After a short-term rapid rise during the upward trend,
Thus, when the death cross appears at a stage high point, it is a more reliable sell signal.
After understanding the golden cross and death cross shapes, we can specifically look at the golden cross and death cross shapes of the MACD indicator lines. The golden cross and death cross appearing at different positions will reflect different market meanings.
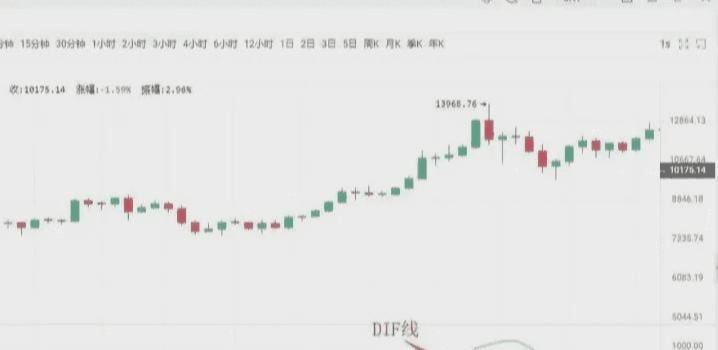
Situation one: Buy point of low-level golden cross. The position of the DIFF line and DEA line golden cross, if it occurs below the zero axis and far away from the zero axis, is called a low-level golden cross. Investors can regard this golden cross at this time merely as a short-term rebound in price. Whether the K-line can form a true reversal still needs to be observed and confirmed in conjunction with other indicators.
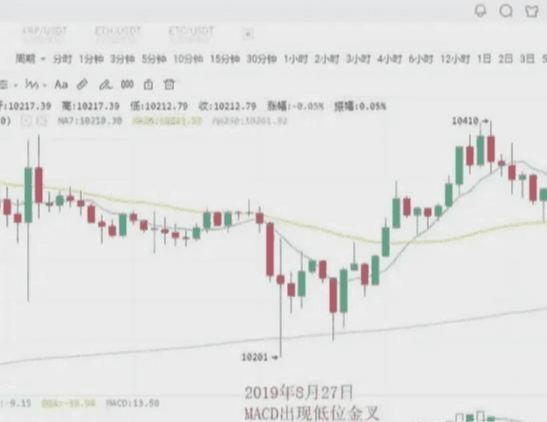
As shown in the figure above: On August 27, 2019, in the BTC 10-minute K-line chart, with the price pullback, a low-level golden cross appeared, followed by a rebound of $200. Short-term investors can seize the opportunity to enter the market.
Situation two: Buy point of golden cross near the zero axis.
If an upward trend has formed and the golden cross of DIFF and DEA lines occurs near the zero axis, it is often an excellent time for investors to buy.
This is because, once an upward trend has formed, a golden cross near the zero axis indicates that the adjustment has completely ended, and a new wave of upward movement has begun. If this is accompanied by a golden cross of volume lines, it indicates that the price rise is supported by trading volume, making the buying signal even more reliable. When this buying point appears, investors should definitely not miss it; otherwise, they will miss out on significant upward movements.
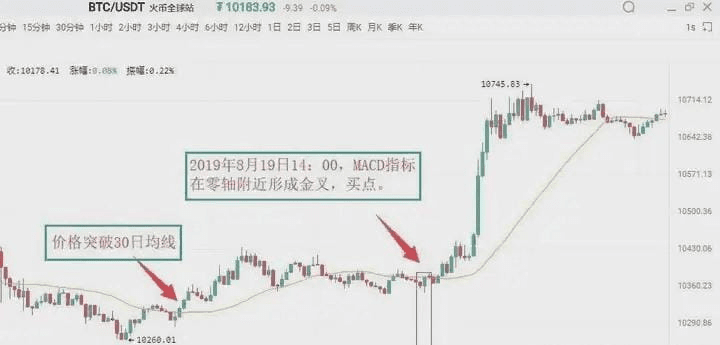
As shown in the figure above: On August 19, 2019, at 09:30, in the BTC 5-minute K-line chart, Bitcoin broke through the 30-day moving average, indicating that an upward trend has initially formed. For a period afterward, the price almost always operated above the 30-day moving average. At 14:00 on August 19, 2019, the MACD indicator formed a golden cross near the zero axis, indicating that the market is about to experience a significant upward trend. Investors can decisively buy.
Situation three: Buy point of high-level golden cross.
If the DIFF line and DEA line's golden cross occurs above the zero axis and is located far from the zero axis, this golden cross is referred to as a high-level golden cross. High-level golden crosses generally appear in...
In the upward process of the K-line, during the consolidation, it indicates that the consolidation has ended, and the K-line is about to continue the previous upward trend. Therefore, once a high-level golden cross appears, it is a good signal to increase positions. In practice, once an upward trend forms, if the K-line slowly rises and maintains for a long time, once the MACD indicator forms a high-level golden cross, it is often a sign that the K-line is about to accelerate upward. For this reason, a high-level golden cross can also be used for swing trading. Investors can use the MACD indicator to continuously hunt for upward waves during an upward trend.
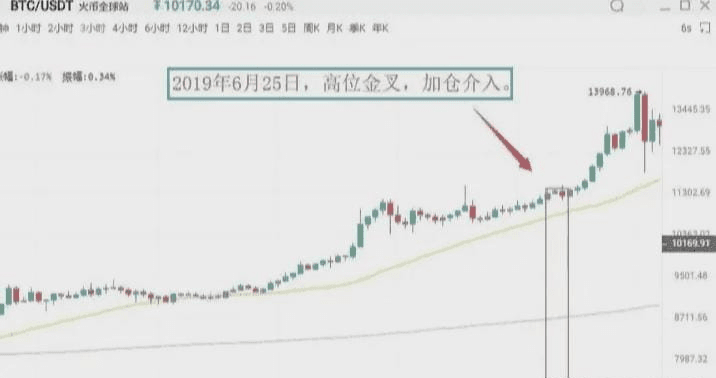
As shown in the above figure: On June 25, 2019, in the BTC 3-hour K-line chart, the price of Bitcoin is in an upward trend, after consolidation, it rises again, while the MACD indicator shows a high-level golden cross. This indicates that the pullback has ended, and the price will continue the previous upward trend. Investors need to pay attention to seizing this opportunity to increase their positions.
Situation four: Sell point of low position death cross.
The low-level death cross refers to a death cross that occurs far below the zero axis. This low-level death cross often appears when a downward trend is about to end after a rebound, thus indicating a sell signal at the end of the rebound. At this time, retail investors without a market presence should be cautious and observe. Retail investors who are deeply trapped with positions should consider selling first, and then buy back after the price drops to reduce costs.
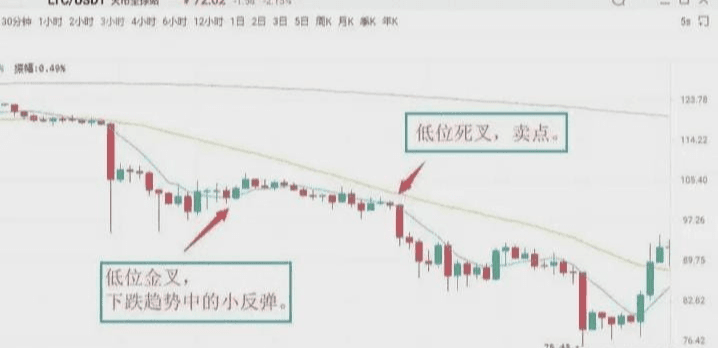
As shown in the figure above: On July 14, 2019, in the LTC 3-hour K-line chart, the MACD indicator of Litecoin showed a low-level golden cross, and the price experienced a small rebound. After that, it quickly went down, and then the MACD indicator appeared a death cross below the zero axis, leading to a new round of downward movement in the K-line. Spot investors can sell their positions at the death cross position and then buy back to reduce their holding costs.
Situation five: Sell point of death cross near the zero axis. If the previous market direction has always been a downward trend, then the intersection formed by the DIFF line breaking the DEA line near the zero axis is called a death cross near the zero axis, indicating that the market has accumulated considerable downward momentum near the zero axis. The appearance of the death cross suggests that the downward momentum of the market begins to release, and the K-line will continue the original downward trend, signaling a sell.
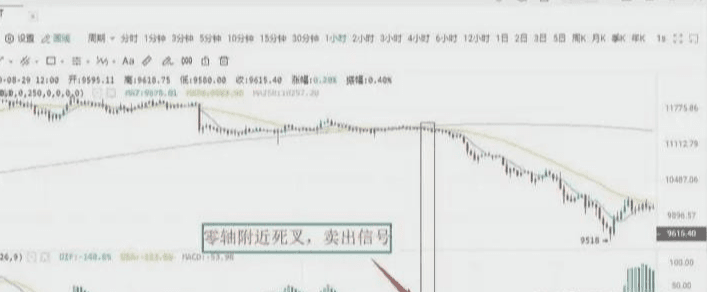
As shown in the figure above: On August 12, 2019, in the BTC 1-hour K-line chart, the DIFF line of Bitcoin broke through the DEA line above the zero axis, forming a death cross. This indicates that the market's downward momentum begins to release, signaling a sell. Investors must decisively sell their positions, or they will be deeply trapped.
Situation six: Sell point of high-level death cross.
The DIFF line breaking down the DEA line far above the zero axis creates an intersection called a high-level death cross. This type of death cross is sometimes accompanied by the top divergence of MACD. The manifestation is as follows: the price's trend continues to reach new highs during the sustained attack, but the MACD indicator's DIF line and DEA line no longer continue to rise or attack but diverge from the price's trend, gradually moving downward.
Above the zero axis, when the DIF line crosses down through the DEA line, forming a downward cross trend shape, it constitutes a death cross, which is a relatively reliable sell signal.
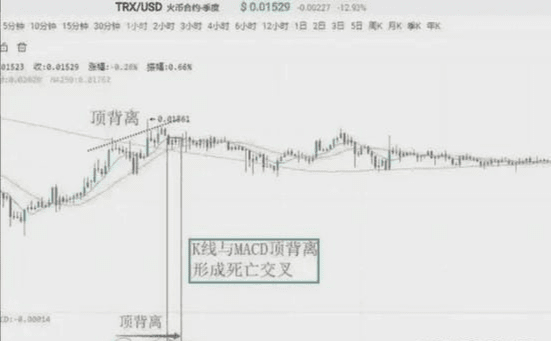
As shown in the figure above: On August 23, 2019, in the TRX 1-hour K-line chart, after the TRON coin rose for a segment, the price continued to reach new highs, but the DIF line and DEA line no longer continued to rise, forming a death cross, signaling a sell.
Fourth, the divergence between MACD and K line.
Divergence is a term used in physics to describe kinetic energy. In technical analysis, it is a widely used analysis method with a high success rate. In a downward trend, when the price hits a new low, but the indicator line does not hit a new low, it is called bottom divergence, indicating that upward momentum is accumulating.
It is a buy signal. In an upward trend, when the price hits a new high, but the indicator line does not hit a new high, it is called top divergence, indicating that downward momentum is accumulating, signaling a sell.
I. Bottom divergence.
MACD bar line and DIFF line's bottom divergence.
The bottom divergence between the DIFF line and price refers to the situation in a downward trend when the price hits a new low, but the DIFF line does not hit a new low. It indicates that during the price's decline, the DIFF line's decline is less than the price's decline, and upward momentum is accumulating.
The MACD bar line is the MACD bar line hidden behind the DIFF line, divided into red and green. Its divergence with the price is an important application of the MACD indicator, widely applied in practice. The bottom divergence between the MACD bar line and price indicates that when the price is consistently hitting new lows, the MACD bar line does not reach a new low. This means that upward momentum is accumulating, and the price is about to stop declining, with a high probability of rising in the near future.
When the bottom divergence occurs, investors can grasp specific buying points through two methods.
Specific buying timing.
The divergence between the DIFF line, MACD bar line, and price is not a specific point in time but a shape that appears over a period. However, for investors, the specific buying point is a specific moment, indicating that the price is about to stop declining. Therefore, to grasp the specific buying timing, when the DIFF line, MACD bar line, and K-line show bottom divergence, investors must combine the bottom divergence with other technical analysis tools to specify the buying point.
First: The bar line changes color or the MACD golden cross.
The changing color of the bar line indicates that the market's upward momentum has begun to dominate. It generally appears after the 'bar line shortens.' Although it may be delayed, it is more reliable. When a bottom divergence occurs, the bar line smoothly changes color or forms a golden cross, allowing investors to buy.
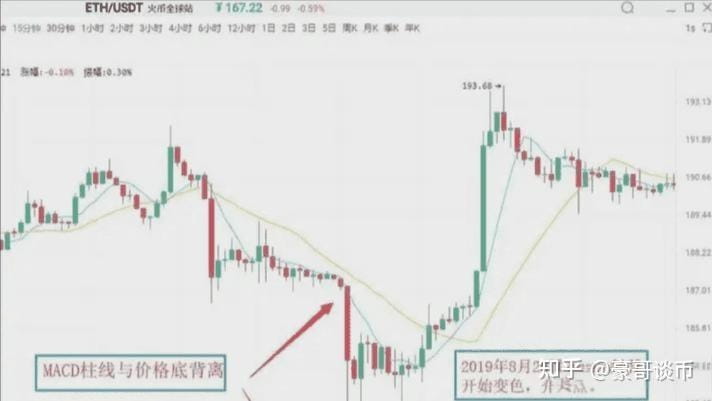
As shown in the figure above: On August 26, 2019, in the Ethereum (ETH) 15-minute K-line chart, the price of Ethereum created a new low during a decline, but the MACD bar line did not create a new low, forming a bottom divergence shape between the bar line and the price. This indicates that upward momentum in the market is beginning to accumulate, and there is a high possibility of a subsequent upward trend. Soon after, the bar line changed color, and these two sequential buy signals combined further increased the reliability of the upward significance. Investors can enter when the bar line changes color.
Second: Combine with other technical analysis tools and K-line reversal shapes, such as the combination of 'single needle probing bottom' and 'bottom red three soldiers.' This is the specific application of the 'multi-indicator combination' principle.
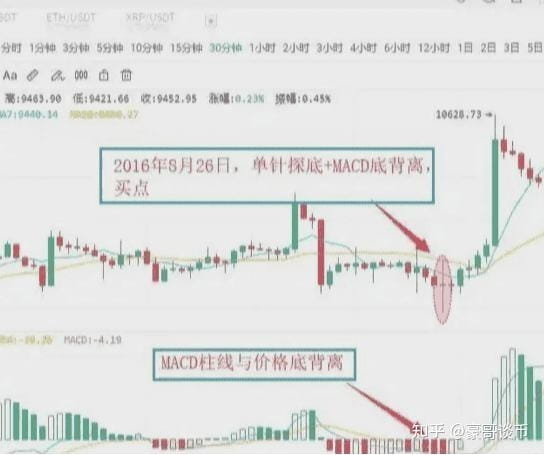
As shown in the figure above: On August 26, 2016, in the BTC 30-minute K-line chart, Bitcoin price created a new low, but the MACD bar line did not create a new low, forming a bottom divergence shape between the bar line and the price, indicating that market upward momentum is continuously increasing. Accompanied by the price's decline stopping, forming the 'MACD bar line and price bottom divergence + K-line single needle probing bottom' buy signal. Subsequently, the price experienced an upward trend.
II. Top divergence.
The top divergence of the MACD bar line and DIFF line.
The top divergence between the MACD bar line and K-line refers to the situation in an upward trend when the price hits a new high, but the MACD bar line does not reach a new high. It indicates that downward momentum is accumulating in the market, and the price may drop at any time.
The top divergence between the DIFF line and K-line refers to the situation in an upward trend when the price hits a new high, but the DIFF line does not reach a new high. This indicates that downward momentum is continuously accumulating in the market, and there is a high probability that the price will experience a downward trend next. The specific selling timing is similar to bottom divergence, and in practice, investors can combine the following methods to make sell signals more specific.
First: The bar line changes color or the MACD death cross.
After the MACD bar line and K-line form a top divergence, if the bar line suddenly shortens significantly, it indicates that the market's downward momentum begins to release. Investors should pay attention to timely selling. The changing color of the MACD bar line indicates that the market's downward momentum has gained the upper hand. It generally appears after the bar line continues to shorten. If the bar line and K-line top divergence occurs, followed by a change in the bar color or the MACD death cross trend, investors should pay attention to exiting in a timely manner.
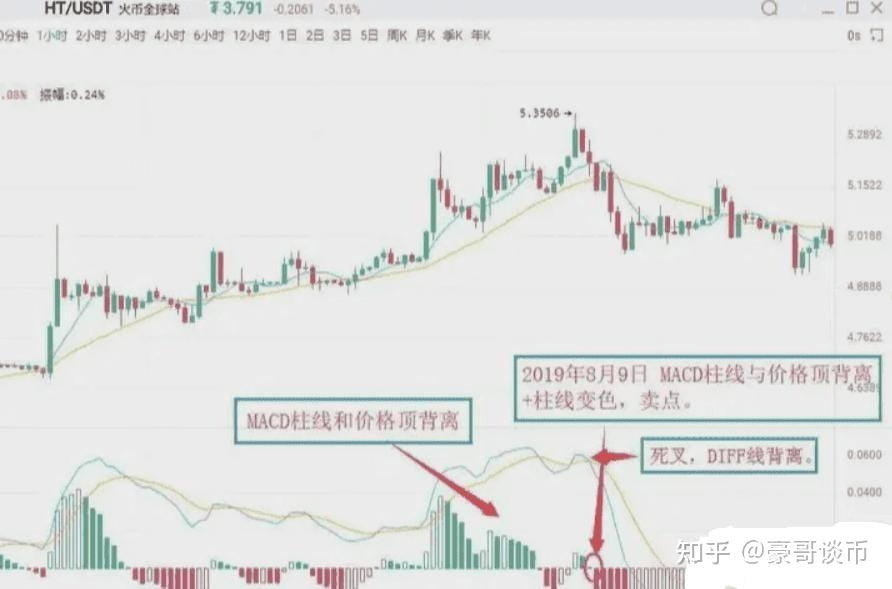
As shown in the figure above: On August 9, 2019, in the HT 1-hour K-line chart, the Huobi price reached a new high, but the MACD bar line did not reach a new high, forming a top divergence shape between the bar line and the price. This indicates that the market's downward momentum is continuously accumulating, and the price may experience a downward trend at any moment. Subsequently, the MACD bar line changed from red to green, issuing a 'bar line and price top divergence + bar line color change' sell signal. Investors should pay attention to exit in a timely manner.
Second: Combine with other technical analysis tools and K-line reversal shapes. After the MACD bar line and price top divergence occurs, if other technical analysis tools also simultaneously show sell signals, the reliability of the market's sell signal will greatly increase. Investors should pay attention to decisively exit at this time. Common sell signals of this type include 'bar line and price top divergence + K-line reversal shape.'
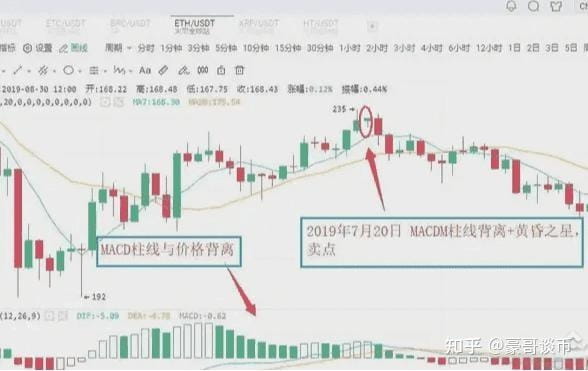
As shown in the figure above: On July 20, 2019, in the ETH 3-hour K-line chart, Ethereum's price reached a new high, but the MACD bar line did not reach a new high, forming a top divergence shape between the bar line and the price. This indicates that the market's downward momentum is continuously increasing, and the price may experience a downward trend. Subsequently, the MACD bar line gradually shortened, while the K-line formed a bearish pattern of the evening star. Investors should pay attention to exiting in a timely manner, as the K-line experienced a significant downward trend afterward.
Five, modification of MACD parameters.
The delayed response to price changes sometimes makes the buy and sell prices less than ideal, which is a flaw of the MACD indicator. One way to change this situation is to adjust the indicator parameters to make the MACD indicator's response to price movements more sensitive, thus allowing the buy and sell prices to be more ideal. In commonly used market software, the default parameters for the MACD indicator are 12/26/9. Under this parameter setting, the MACD indicator often exhibits a noticeable lag in response to price changes. The lag in the MACD indicator can be resolved by adjusting parameters. Common parameter combinations include 5/34/5, 5/10/30, etc. Investors can also experiment and explore more in practice.
Evening Star: During the rising process of the K-line, a longer bullish candle appears first, followed by a shorter entity K-line (either bullish or bearish), which people compare to a star. This is the main part of the K-line combination. The third K-line is a longer bearish line, which has penetrated deeply into the first K-line's body. The evening star is a signal for the price to peak and fall back, with some predicting an accuracy rate of over 80%.
Finally, those who have been through the rain always want to hold an umbrella for others. Having experienced days of isolation, seeing others suffer losses makes them empathize. They want to lend a helping hand, wanting to compensate for the regret of wanting to be pulled up back then, like holding an umbrella for their past selves who were drenched in the rain.
In the coin circle, achieving financial freedom and a leap in class, I summarized ten trading tips. Understanding one of them can lead to stable profits, which is worth it.
Repeated learning:
1. Two-way trading: Suitable for bull and bear markets. Two-way trading is currently the most common trading method on the GGtrade platform, which can be based on...
Investing in cryptocurrency market trends can buy up or down, and as the year-end approaches, the GGtrade platform has also launched...
A series of favorable benefits, such as a 20% increase in investment return rates, is indeed a significant boon for a wide range of investors.
2. Coin accumulation method: Suitable for bull and bear markets. The coin accumulation method is the simplest yet also the most challenging way to play. It's simple because it involves buying a certain coin...
Or after a few coins, hold on for more than half a year or a year without operating. Basically, the yield is at least ten times. However, beginners can easily get distracted.
When the profits are high, or when the coin price is halved, planning to switch vehicles or exit becomes difficult for many people to stick to not operating for a month, so there's no need to say...
It's been a year. So this is actually the most difficult part.
3. Bull market chasing the dip method: Only suitable for bull markets. Use a portion of spare money, preferably not exceeding one-fifth of the capital. This method is suitable for playing coins with a market value of...
Coins priced between 20 and 100 are at least not likely to be trapped for too long. For example, if you bought the first altcoin and it rose by 50% or more, then...
It can be switched to the next coin that will experience a sharp drop, thus cycling. If your first altcoin is trapped, just keep waiting; the bull market will definitely relieve the situation.
Under the premise that the coin cannot be too pitiful, this method is actually difficult to control, and newcomers need to be cautious.
4. Hourglass vehicle-switching method: Suitable for bull markets. In a bull market, basically, any coin you buy will rise. The funds are like a giant hourglass slowly seeping into each...
Starting from major coins. There is a clear rule about coin prices rising; leading coins rise first, such as BTC, ETH, DASH, ETC.
First wait for a rise, then mainstream coins start to rise, such as LTC, XMR, EOS, NEO, QTUM, etc. Then, various small coins will rise.
Rise, such as RDN, XRP, ZEC, etc., then various small coins will rise one after another. But if Bitcoin rises, you will choose the next one...
At levels where coins have not yet risen, begin to build positions.
5. Pyramid bottom buying method: Suitable for predicting major crashes. The bottom buying method: separately place orders to buy one-tenth of the total position for the coin price of 80%.
At positions, place an order to buy 20% of the position at 70% of the coin price, and place an order to buy 30% of the position at 60% of the coin price.
Buy 40% of the position at 50% of the price.
6. Moving average method: Understand some basics of K-lines. Set the indicator parameters to MA5, MA10, MA20, MA30, MA60, and select a daily line level.
If the current price is above the MA5 and MA10 lines, hold steadily. If MA5 drops below MA10, sell the coin. If MA5 rises above MA10...
Buy to build positions.
7. Violent coin accumulation method: Do what you are familiar with, only suitable for long-term quality coins. If you have liquid funds and a certain coin is priced at $8, then place an order to buy...
Place an order to buy at $7, and when the purchase is successfully executed, place an order to sell at $8.8. Profit to accumulate coins. Withdraw liquid funds and continue to wait for the next opportunity.
Opportunities. Adjust dynamically based on the current price. If there are three such opportunities in a month, you can accumulate a lot of coins. The formula is the construction price...
The sell price equals the current price multiplied by 110%!
8. ICO violent compound interest method: Continue to participate in ICOs, when the new coin rises by 3-5 times, take back the principal and invest in the next ICO.
Continue to hold it and cycle repeatedly.
9. Cyclical wave method: Find coins like ETC that are considered as 'black vehicles', add positions when the coin price keeps falling, continue to add positions as it falls, then wait...
Profit and continue to sell, cycling continuously.
10. Small coin violent play: If you have 10,000 yuan, divide it into ten parts, buying ten different types of small coins at a price of 3 yuan each.
Within the best range, after buying, do not care. Don't sell until it triples or quintuples; don't sell if trapped. Just hold onto it long-term. If a certain coin triples...
Three times afterwards, take away the principal of 1000 yuan, and then invest in another small coin. Then the compound interest returns are quite impressive!
Looking out at the darkening sky, I turned off the computer. Ten years in the coin circle taught me not only how to make money but more importantly how to remain calm in the madness.
Maintain rationality in the market. This market is never short of opportunities; what's lacking is those who can survive to the next bull market.

The ultimate realization of a trading veteran.
1. About trading psychology.
Personal enlightenment requires careful thinking, strict constraints, a strong inner self, the cost of making mistakes, and experiencing life's trials. Youth requires a price to pay, but fortunately, youth is the greatest capital, allowing one to exchange time for space and tuition for experience. However, there are many excellent students who cannot afford the high tuition, so every trading opportunity should be cherished, as this is the foundation for increasing one's cultivation and improving one's realm.
Confidence and patience are essential psychological qualities that successful traders must possess. However, if the initial position is too heavy, one or two mistakes can lead to huge losses, severely impacting the trader's confidence. The eagerness to recover losses causes traders to lose patience, leading to chaotic trading, ultimately resulting in elimination. Don’t always expect to make big money with one trade; traders must allow themselves to make mistakes and leave room and time to correct them. 90% of the time should involve lightly participating in the market, aiming to improve one's ability to analyze market trends through constant learning and practice.
Continuously practice with small amounts, honing your mindset in real gains and losses, improving your technical perception of the market's pulse. Only in this way can you continue to progress. Psychological experiments show that when gaining, the public becomes risk-averse, and when losing, they become risk-seeking. This is reflected in the trend, with investors who profit during upward trends frequently trading, while those trapped during declines rarely accept defeat. Thus, to drive out the investing public, the market will gradually exhibit slow rises and sharp declines in bull markets, and slow declines and sharp rises in bear markets.
In trading to the end, apart from firmly believing in your philosophy, it's about repeatedly executing familiar patterns, day after day, year after year. The appreciation in the account may not even interest you but rather provide a simple sense of satisfaction that meets your judgment. After experiencing several twists and turns, you finally walk the right path for yourself. On this journey, you don’t need companions, just unwavering forward movement. The super winners in the market often appear to be dull individuals; they exchange their stubborn persistence for remarkable success. This is the power of focus. Beginners are often restless, but with age and experience accumulation, along with self-cultivation improvement, the restless mindset can be eradicated; otherwise, the market will invite you to make a fortune elsewhere.
I desire high profits, but the lover of high profits is high losses, so I must restrain my desires. Not seeking high profits, as long as I have a smooth upward capital curve, I can frequently enjoy compound interest. Making trading profits is certainly the ultimate goal, but the process is also very important. A significant fluctuation in the capital curve indicates that the capital will bear great risks in the future, and it is also not easy to board the compound interest express train.
The eyes of the market are sharp and will ultimately reward those who are patient. The market takes money from those who make reckless moves and gives it to those who are good at waiting with empty positions.
Second. About trading methods.
What makes trading truly useful are the rules, and the rules are built on your operational experience and winning habits. They are the operational philosophy derived from countless winning and losing operations, avoiding incorrect actions while retaining correct actions. According to game theory, trading is a real game, and the characteristic of real games is that as long as you make fewer mistakes than others and keep the losses caused by mistakes under control, you will eventually become a successful trader.
From a causal perspective, every profit and loss in the trading process has its reasons, even if the reason for profit or loss is due to misjudgment, random actions, or luck, it is still a reason. After a phase of trading, the profit or loss has its reason. For profitable results, one should understand the reasons and reinforce them; for losses, one should investigate the reasons and find ways to alleviate, isolate, or cleverly compromise with them. Traders often cannot suppress curiosity and excitement, leading to impulsive actions, especially new traders with limited funds should not act impulsively, as more actions will lead to more mistakes.
Act like a crocodile, don't strike easily, but once you do, ensure you reap rewards. A crocodile's ability to catch prey is closely related to its previous lurking, so traders must prepare everything before taking action to minimize unnecessary losses due to operational errors. One characteristic of trading is that once you intervene in a position, all your previous analysis and judgments will have no effect on the trend. The trend is determined by the market, not by you. The only thing you can do is decide when to exit. Of course, if you are one of those super large funds with market-leading power, that's a different story. For technical aspects, I place more importance on capital management and trend patterns.
Truly understanding that losses are part of trading means not fearing losses. Controllable losses must be faced courageously; only when the loss exceeds the preset limit will you feel real pressure. Keeping losses within a reasonable range is a symbol of trading ability. Over time, the confidence of traders will be strengthened, and those who have self-discipline and actively control risks will ultimately be rewarded by the market a hundredfold.
Seriously execute your trading system, and you will have consistency in operations, which is a basic principle for coping with the chaotic changes in the market. With this principle, you can maintain calm in major events and act with basis. With long-term persistence, you may gradually transform into an excellent trader without realizing it. Among the few traders who profit in the market long-term, most are experts and professionals. An intriguing question is that there is a widely recognized phenomenon in both futures and stock markets, which is that ordinary traders’ judgment of the market is no better than that of experts and professionals, thus forming a paradox of trading. This shows that effort is outside of the poetry.
It is not necessarily technical analysis that determines trading profits and losses; at least the core determining factor is not technical analysis. Full position trading is equivalent to fighting a battle with no retreat; even if it is in the trend, it is equivalent to going against it because they cannot withstand the slightest turmoil. Even the slightest fluctuation at any time unit can be a disaster for them.

I am Xiaoyan, having experienced multiple rounds of bull and bear markets in the coin industry. I entered the field three years ago, mastered it five years later, and dominated it for ten years. I have rich trading experience in many areas of the cryptocurrency field. Follow Xiaoyan to clear the fog of information and see the real cryptocurrency market. Seize more opportunities for wealth growth and discover truly potential coins. Don’t miss good opportunities again!
