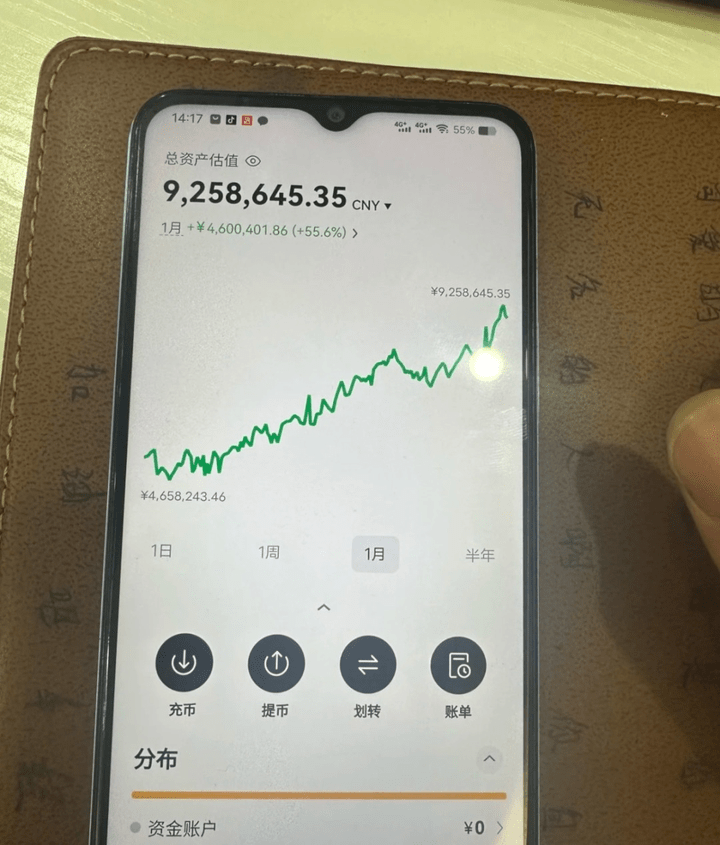
In the field of cryptocurrency, I have been deeply involved for 10 years. Eight years ago, I decisively left my job and devoted myself fully to this wave of digital finance. From being broke to achieving financial freedom, my life trajectory was completely rewritten one night five years ago. That night, a senior's heartfelt words were like a morning bell, enlightening me on my positioning and deeply understanding the eight stages that cryptocurrency investors must go through. I used these stages as a mirror to constantly reflect on myself and finally regained everything I once lost!
Perhaps in the eyes of the public, retail investors are always the weaker party, like fish on a chopping board.
If you are hesitating at the gates of the cryptocurrency world, I sincerely hope my sharing can light a lamp for you. I believe I have the ability to summarize and express myself, and I hope my experiences and insights can provide you with valuable references. Let's get back on track and dive into the main topic!
In the journey of cryptocurrency trading, when you face a moment of difficult decision-making about selling, ask yourself: if your analysis is accurate, why does the market go against it? The answer is simple—your judgment has gone awry because the market is always right and never makes mistakes!
So how can one do well in cryptocurrency trading? Once a person enters the financial market, it's hard to turn back. If you are currently at a loss but still confused, and plan to treat cryptocurrency trading as a second career in the future, you must understand the 'KDJ indicator strategy.' Understanding it will help you avoid many detours. These are personal experiences and feelings; I suggest you save and ponder them repeatedly!
KDJ, also known as the stochastic indicator, combines the advantages of the Williams index (WMSR) and moving averages (MA), focusing on analyzing the changes in closing prices relative to recent highs and lows, making it highly sensitive, especially suitable for judging short-term trends, thus being hailed as the 'king of short-term indicators.'
The intrinsic logic of the KDJ indicator is based on the following market phenomena:
1. In an upward trend, the stock's closing price often approaches recent highs.
2. In a downward trend, the closing price of the stock often approaches the recent lowest price.
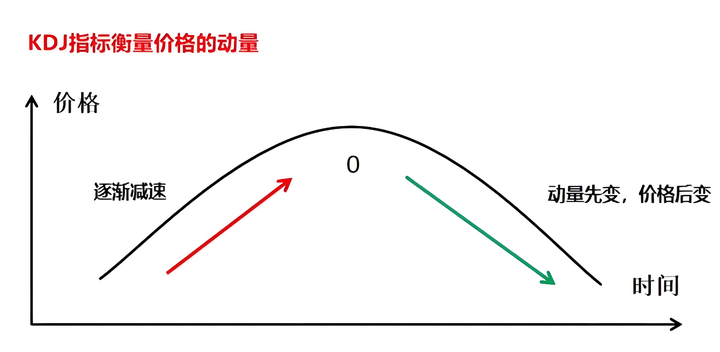
When the closing price falls back from a high position or rebounds from a low position, it indicates that the price's upward or downward momentum may be slowing, signaling a potential reversal in the trend.
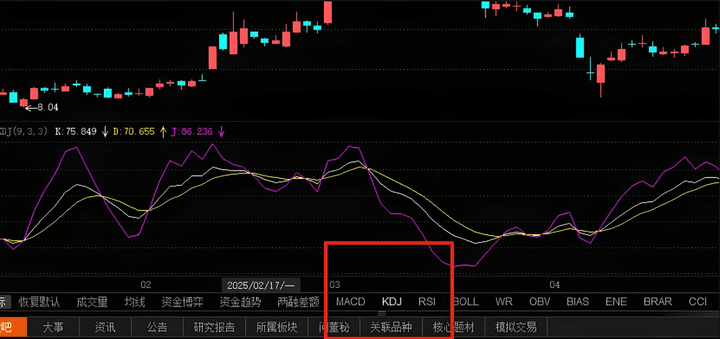
KDJ represents three lines: K line, D line, and J line.
1. The differences and meanings of the three lines:
The K line is a fast line that responds quickly.
The D line is a slow line and responds relatively slowly.
The J line reacts the fastest and is mainly used to assist in decision-making.
2. The range of K and D values:
The range of the K and D values is 0 to 100, while the J value can exceed 100 or be below 0.
By analyzing the relationships between the K, D, and J lines, one can determine market overbought and oversold conditions, divergence trends, and the phenomena of line crossovers, thus helping to predict the trend of stock prices.
Generally, you can directly select the indicators you want to view in software without needing to calculate them yourself~
1. Judging overbought and oversold.
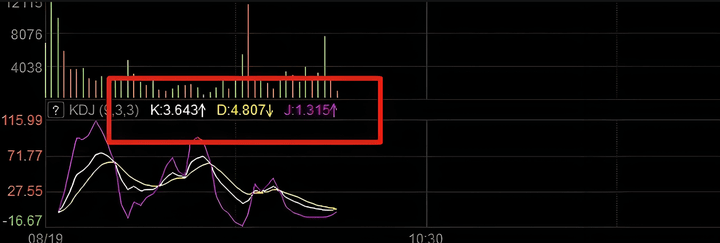
When the K value, D value, and J value are all below 20, it is an oversold area, indicating that the stock has been excessively sold by the market, presenting a good opportunity to buy on dips.
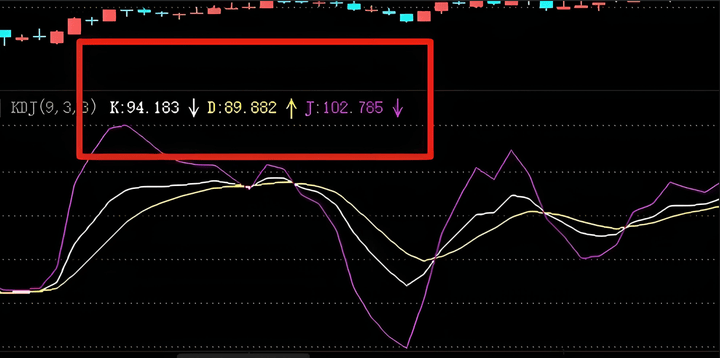
When the K value, D value, and J value are all above 80, it is an overbought area, indicating that the stock has been excessively bought by the market, presenting a higher risk and a good opportunity to sell on highs.
When the K value, D value, and J value are all between 20-80, it is a hovering zone; at this time, it is advisable to observe changes.
Note:
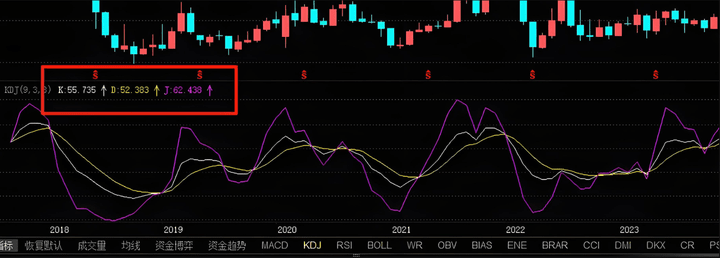
Generally speaking, when the K, D, and J values are around 50, it indicates a balance of power between bulls and bears;
When all three values of K, D, and J are greater than 50, it indicates that the bulls have the upper hand.
When all three values of K, D, and J are less than 50, it indicates that the bears have the upper hand.
2. KDJ Patterns: Golden Cross & Death Cross
When the K line crosses above the D line near the low of 20, it is called a 'golden cross' and is a buy signal.
When the K line crosses below the D line near the high of 80, it is called a 'death cross' and is a sell signal.
The J line reacts the fastest to price movements and often leads the K and D lines, serving to enhance the golden cross and death cross signals.
If the J line stays at a low position close to 0 or a high position close to 100 for an extended period (e.g., more than 5 days), it indicates a higher probability that the stock price has reached a short-term bottom or top, making the golden cross or death cross signals more reliable.
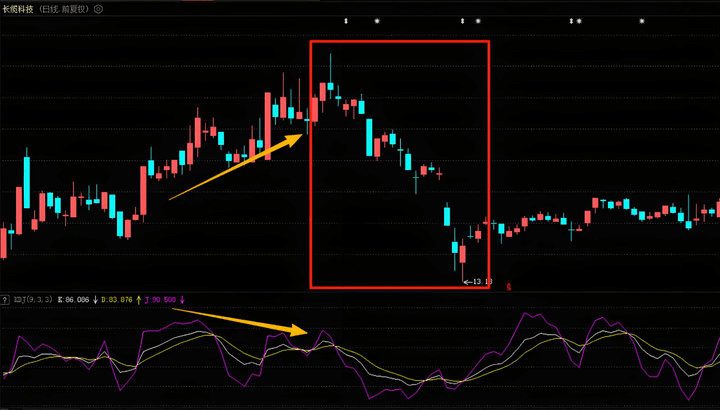
3. KDJ Patterns: Top Divergence
When the stock price continuously hits new lows, while the KDJ indicator shows higher peaks at low levels, this is a bottom divergence, usually signaling a reversal from the low position, indicating that the stock price is about to rise, which is a buy signal.
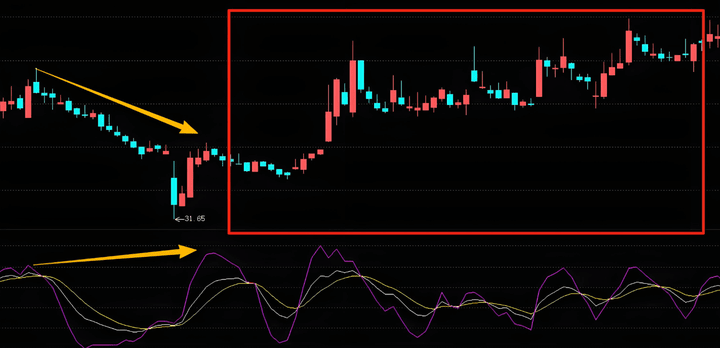
4. KDJ Patterns: Bottom Divergence.
When the stock price continuously hits new lows, while the KDJ indicator shows higher peaks at low levels, this is a bottom divergence, usually signaling a reversal from the low position, indicating that the stock price is about to rise, which is a buy signal.
5. The 'dulling' of KDJ.
In a strong upward trend, the stock price may continue to strengthen, with very small short-term pullbacks.
In this case, the K and D lines may stay at a high position above 80 for a long time and repeatedly cross, losing their signaling function, known as the 'dulling' phenomenon.
The KDJ indicator is mainly used to judge market reversals. When dullness occurs, both golden cross and death cross signals become unreliable. Investors should consider other indicators comprehensively, such as the MACD indicator and the divergence of the KDJ indicator, to determine the market trend.
In response to the dulling phenomenon of the KDJ indicator, if the trend remains strong, go with the trend. The core strategy is to buy and hold.
Before a trend is broken, there are often signs, such as divergences appearing in both the MACD and KDJ indicators. In this case, when the KDJ indicator shows a death cross at a high position, it likely signals that the trend will shift from rising to falling, and investors should consider selling decisively.
6. The dynamic signals of KDJ.
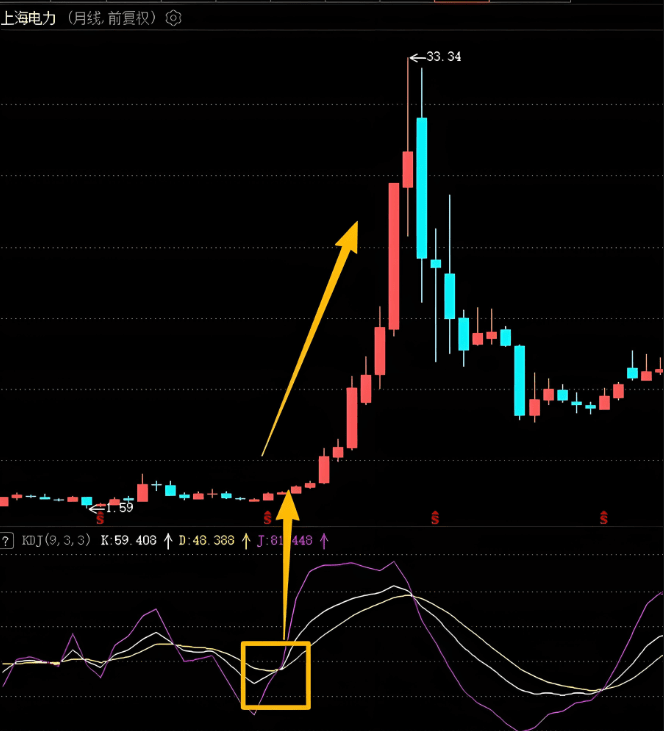
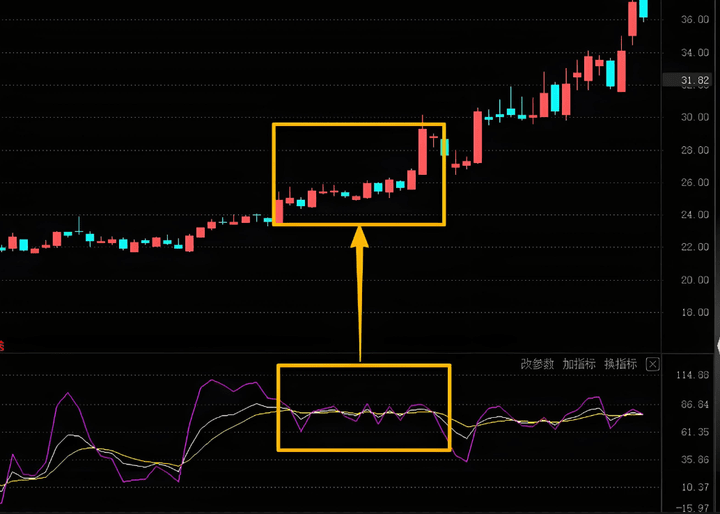
1. When the J line breaks above the K line at the bottom (below 50), it indicates that the weak consolidation pattern of the stock price may be broken, and it will likely move upwards in the short term.
2. When the J line breaks above the K line and quickly surpasses the D line, it indicates the beginning of a medium to long-term upward trend.
3. When the K, D, and J lines escape the narrow consolidation range and simultaneously rise quickly, it indicates entry into a strong short-term upward trend, and one should resolutely hold for gains.
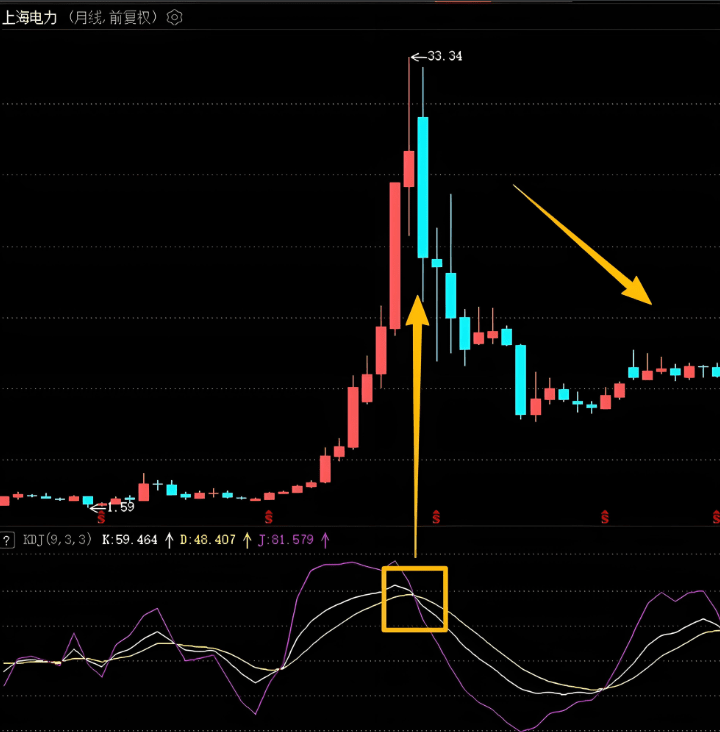
4. When the J line turns downward at a high position (above 80), it indicates that the short-term upward movement has been too fast and short-term adjustments will begin.
5. When the D line turns downward at a high position, it indicates that the short-term upward trend may end.
6. When the K line turns downward at a high position, it indicates that the medium to short-term upward trend has ended.
7. When the K, D, and J lines simultaneously move downward from a high position, it indicates that a downward trend is forming.
It is important to note that the KDJ indicator has strong guidance in short-term operations. However, when applying the KDJ indicator, it should be combined with fundamental analysis and other technical indicators for a comprehensive assessment.
At the same time, be wary of manipulators controlling the closing price, as well as the recent highest and lowest prices.
Finally, here's a summary of cryptocurrency trading secrets:
1. Continuous small rises indicate real gains, while continuous large rises signal to exit.
A small rise that is sneaky is actually the main force trying not to attract too much market attention, preventing too many follow-on trades from disrupting their original operation rhythm and layout, while a blatant large rise is intentionally trying to attract market attention to pull in more retail investors.
2. Don't sell on highs or panic sell; don't buy during sideways movement or trade.
This is the most basic and simple principle of short-term trading. However, many people always find it hard to resist trading at any time.
3. Rapid increases signal a peak, while rapid drops signal to sell; slow rises suggest to sell gradually.
This means that if the stock price continuously accelerates upward, it is at the peak phase, and a peak should be expected shortly. The accumulated risks are also increasing, so we need to exit as soon as possible, selling at the peak of our lives.
4. Large volume upward candles or liquidation.
If a stock price forms a huge upward candle at a high position, it's time to leave immediately without hesitation. Generally, the next day, there is a high probability of a gap up followed by a rapid decline, or it may directly gap down, wiping out your profits from the previous day. After the main funds pull the price to a small high, most will unload their positions or reduce their holdings on the day of the big candle.
5. Shrinking volume at new lows indicates a bottom; increase in volume requires entry.
When the trading volume is at a low and the stock price falls to a sufficiently low position, those who want to sell have sold, and those who don't want to sell are also unwilling to do so. Dead pigs don't fear boiling water. Everyone lies flat, and trading volume will naturally decrease. After seeing low volume, when trading volume starts to slightly increase, the stock price can easily rebound, indicating that new funds are beginning to enter the market. We should decisively choose to enter at this time.
6. Don't hold onto hot stocks for too long; expectations should be lowered.
Holding onto a stock until it reaches a peak is just short-term trading, which relies on hot spots and market emotions. The main funds are just riding the wave of hot topics. When the hot topic reaches its peak or starts to recede, funds will withdraw. Take the recent wave of tech stocks as an example; the market was buzzing about them, with various finance bloggers digging for future multi-bagger stocks, while the main funds had quietly exited. By the time everyone wakes up, they find themselves left holding the bag.
7. Only trade stocks in an upward trend.
Trends are like continuous mountains, more like rivers rushing to the sea. Once a trend is formed, it is likely to continue. Therefore, only trade stocks in an upward trend to maintain a high win rate. Follow me to learn the truths behind the market.
The above are trading insights from 10 years of cryptocurrency experience. Having gone through many ups and downs, these are heartfelt words of enlightenment that I hope will be useful to everyone. Yanyan's products are assuredly high quality. There are beautiful people in the cryptocurrency circle, unique and independent, with a soulful path and a method to manage coins!
Trading cryptocurrencies is a journey of cultivation, and the pain and suffering along the way are hard for ordinary people to understand. However, if we have the right direction, no matter how far, moving forward will gradually bring us closer to the destination. The fear in life lies in not knowing where one is or whether they can reach their goal. Follow me, and I am willing to be the beacon in the cryptocurrency world to guide you!