Entering the circle from 50,000 to 100,000, then to 302,000. In the third year, it reached 590,000, and in August of the fourth year, it reached 3.78 million, and in November, it reached more than 7 million.
Until a few years ago, I could easily withdraw 30 million from the currency circle.
During this period, I fell to the bottom. At that time, I reached about 400,000. At that moment, I thought I could be considered a big shot in the currency circle. I resolutely quit my job and focused on炒币, even borrowed money to炒币. However, reality gave me a heavy slap in the face. The financial crisis made me not only give back all my profits, but also owe a lot of debt. In the end, I had to sell my house, and my wife almost left me.
That time was my darkest moment. In just a few months, I experienced a fall from the peak to the bottom. But this also made me realize that my previous success was not without luck.
So, I feel that if I really want to continue on the path of trading, I still need to study hard. In addition to understanding the basic knowledge, analyzing the news, I should also study technical indicators. If I don't conduct in-depth research and plan my money bag reasonably, the funds will be exhausted. Finally, as a retail investor without any foundation, I will only enter the market happily and leave sadly.
After 3 years of cutting off contact with all classmates and friends, staying at home, and reviewing the market day and night, I finally achieved financial freedom through炒币.
Without further ado, let's get straight to the point!
Today's article is written for novices, or for friends who are interested in Price Action (naked K-line trading).
I will explain the basic logic of Price Action in the most concise and clear form, and prove to you that Price Action is a very concise and practical concept, and it is the greatest guarantee for us as retail investors to survive in the market!
After you have mastered it proficiently, it can become your market advantage, allowing you to flexibly customize different response methods and trading plans in various market conditions, without having to struggle.
Of course, I am not a god, Taoist priest, or Buddha. It doesn't mean that you will be invincible after learning Price Action.
Can only ensure that you will react faster to the market during the trading process, the timing of entry will be more accurate, and the probability of your success will be increased.#BitDigital转型
If this is your first time meeting me, welcome! Here, you will learn everything about trading. Students who are interested in making money techniques, remember to follow me so you don't miss out. Let's start now!
What is Price Action?
1, What is PriceAction?
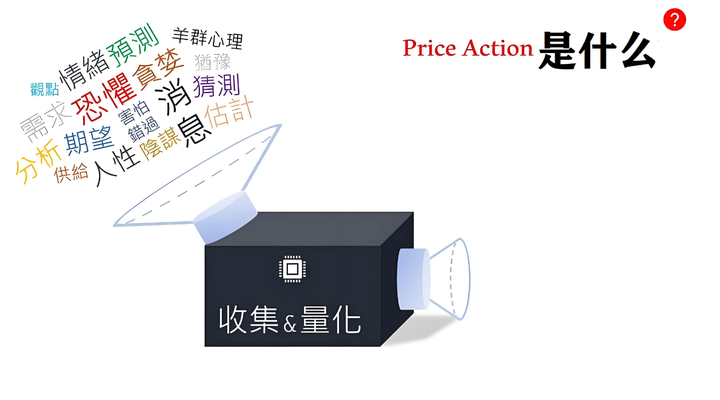
We know that whether it is the foreign exchange market, the stock market, the futures market, or the currency circle.
are filled with many things that cannot be quantified, such as emotions, fear, greed, human nature, conspiracy, expectations, predictions, opinions, news, etc.#中国加密新规
Then can we pack all these things into a huge processor and convert them into a quantified value? Of course, we can!
This value is the K-line.
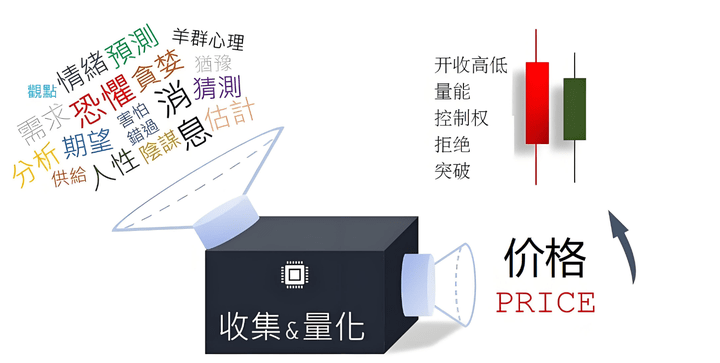
The value of the K-line itself is already very large. We can actually obtain a lot of information just from the K-line.
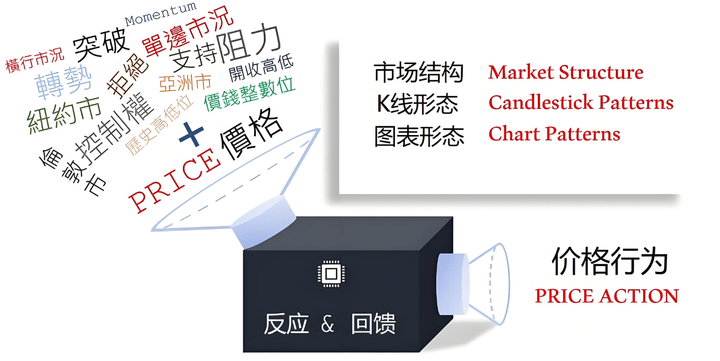
If we take a knife to dissect the K-line, we will find that at different times, different locations, and different markets, we will see different feedback from buyers and sellers.#俄乌冲突即将结束?
And these feedbacks are Price Action (price behavior), simply put.
PriceAction (price behavior) includes three parts.
Market structure, K-line pattern, chart pattern
These three parts have different uses and logic.
Price Action translated into Chinese is: Price Behavior.
What is behavior?
We humans have logic and reasons behind everything we do at any time, and the market is the same. Because behind the K-line is the collision of human nature.
Next.
We will disassemble the above three parts to talk about them. If you feel that you have gained a lot after reading them.
Welcome to follow me, because in the near future, I will explain the logic behind each pattern and the most ideal usage for each part of Price Action.
Market structure.
2, Market structure
Generally, when we look at charts, whether it is stocks or digital currencies, we are often disturbed by different news, emotions, guesses, or various news, which distracts us and makes us ignore the real structure of the market.
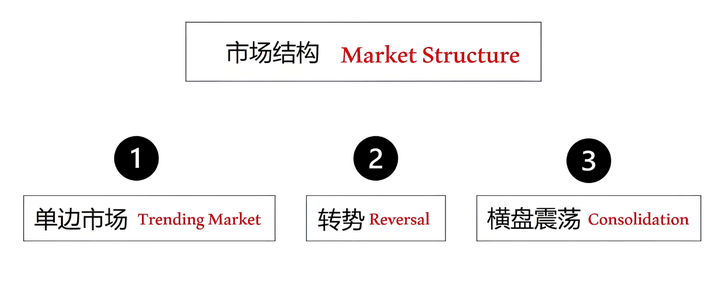
And the structure of the market is nothing more than 3 possibilities: one-way market, trend reversal, and sideways fluctuation.
[One-way Market]
As the name suggests, the market is currently moving in a certain direction. At this time, its supply and demand are out of balance. There are two methods that can help us distinguish whether the market is a one-way market.
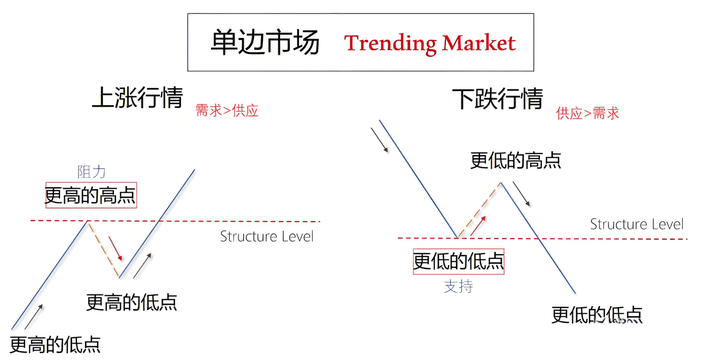
The first method:
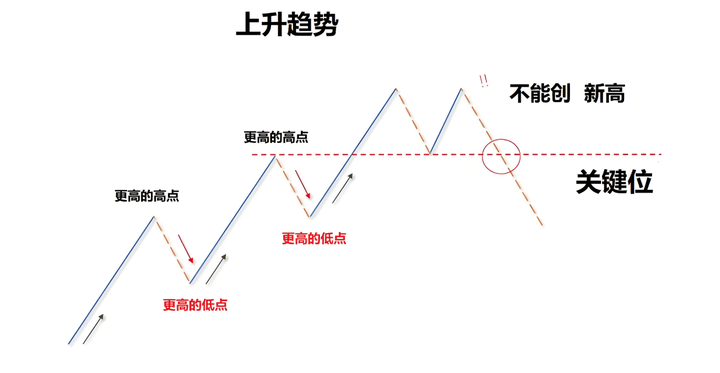
Prices are rising.
will constantly create higher highs, higher lows, and higher highs (i.e., constantly reaching new highs). In a downtrend,
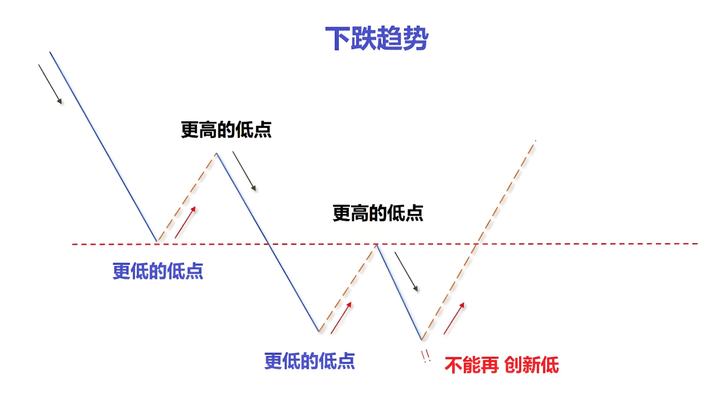
will constantly form lower lows, lower highs, and lower lows (i.e., constantly reaching new lows). When the market is in a one-way market, every time the price creates a new high or low.
Will invisibly form new support and resistance levels. The most common situation is that every time a new high or low is broken, it will retrace back to the previous high or low.
This is why we often see on the market that yesterday's resistance becomes today's support, and yesterday's support becomes today's resistance.
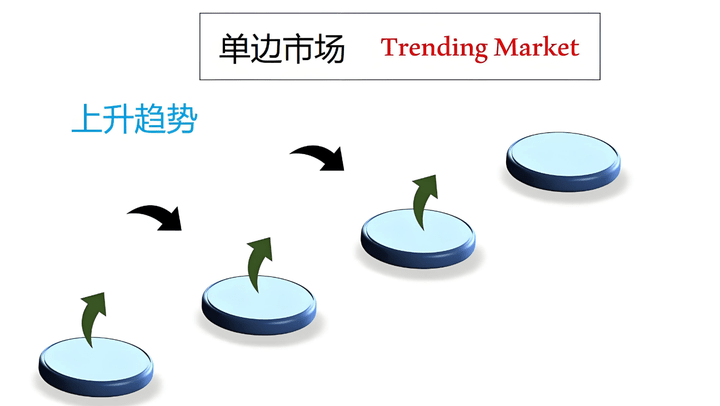
It's like the high jump, going up level by level. Each time you jump to the next new high point, you fall back due to the earth's gravity, and then jump higher with the help of reaction force, repeating and jumping higher and higher.
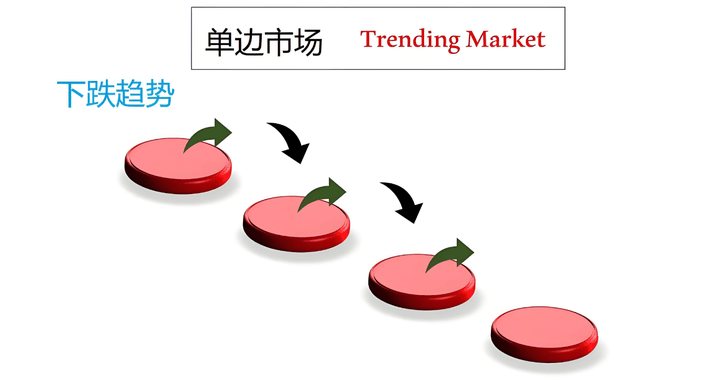
The downtrend is the same, jumping down level by level, jumping lower and lower.
The second method:
But many times, the market does not strictly follow the situation described in the book. What we see more often is a chaotic market.
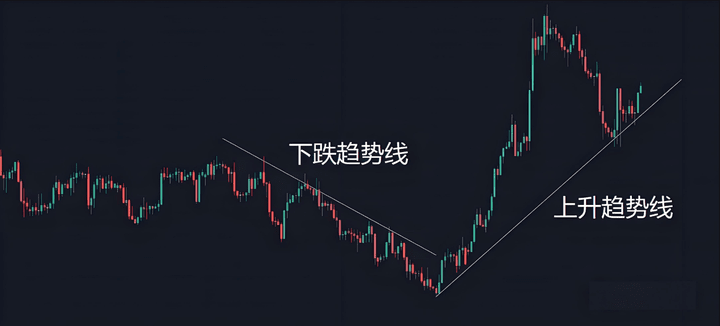
At this time, we can use trend lines to help us judge the market trend.
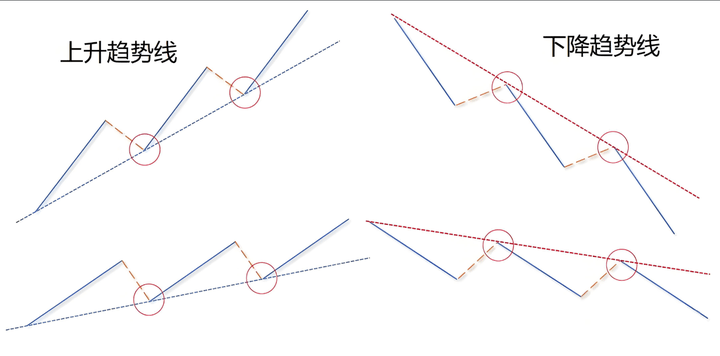
Generally speaking, as long as there are 2 points, a line can be connected, and its strength can be judged by its slope.
The more sloped it is, the stronger the trend is. Conversely, the flatter the trend line is, the weaker the trend is. In a sense, the trend line itself is the support and resistance level.
In an upward trend.
The market has been following this trend line.
It rises every time it touches this support level.
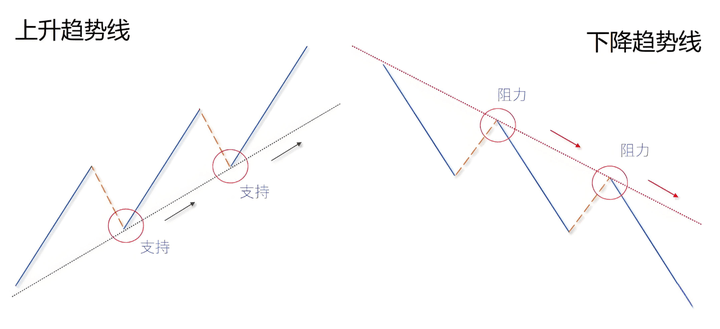
In a downtrend, it gradually declines step by step, following this trend line. Every time it touches this resistance level, it will fall. In our daily trading, if we apply the trend line and combine it with the concept of key levels, it will greatly increase the probability of winning the trade.
The above two methods.
is the most common method to use Price Action to judge market trends.
[Trend Reversal]
Generally speaking, in an upward trend, we don't act like idiots and go against the market to sell. Conversely, in a downtrend.
We don't want to buy, we don't know how long a trend can last, and we shouldn't just guess the top.
So, sell at the top or buy at the bottom purely based on intuition that the price is too low.
Usually, I only make counter-trend trades in the following two situations.
They are:
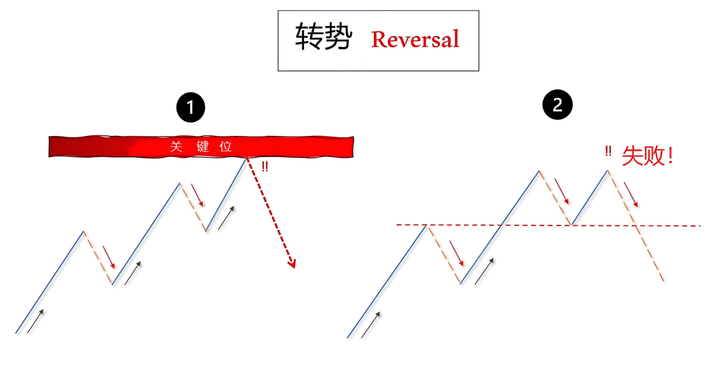
The price has reached a strong and critical support/resistance level that cannot be broken; or the one-way market trend has failed.
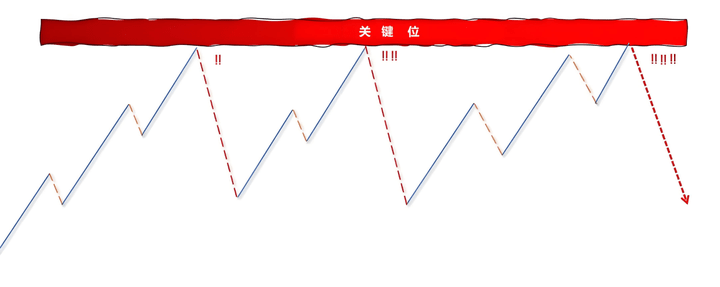
The first situation.
You need to pay attention to the reaction when the price encounters major support/resistance levels. Generally, we call these support/resistance levels "key levels." Compared to general support/resistance levels, key levels are more effective and more accurate. How to identify them specifically.
I won't explain it here. Friends who are interested in learning more can take a look at the following article. I believe you will definitely be enlightened.
Click to view immediately: (5 steps to teach you how to accurately find support and resistance levels! There is an easter egg at the end!)
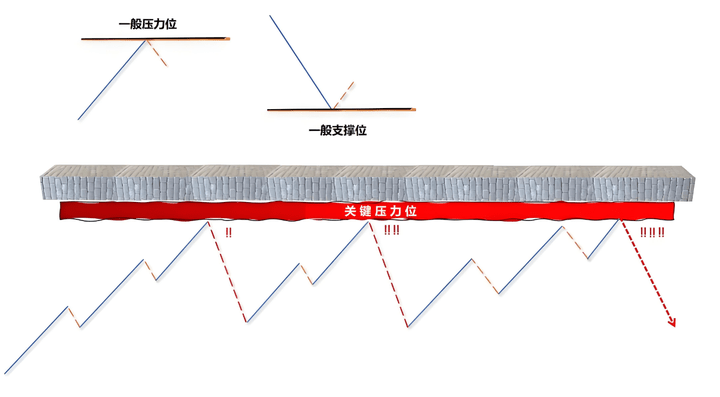
Simply put, you can compare general support and resistance levels to a relatively thin wooden board. Although it has a certain degree of hardness, there is still a chance to break it by hand. A key level is a brick. Although the price will smash it hard, it cannot break through this strong and powerful position. These types of positions are often places where long-term institutional investors deploy to enter or exit the market. Therefore, there are often false breakthroughs, sharp rises, or sharp falls. After you have learned the concept of key levels.
You will understand:
Why is my order going smoothly and in a profitable state, but suddenly there is a sharp drop or a sharp rise, or why does it often sweep my stop loss and then continue to move in the direction I predicted correctly? Similar situations can be greatly reduced in the future.
The second method.
is to use fundamentals to judge whether the market trend has changed. When the upward trend can no longer create new highs, and the price breaks down this key support level, we will regard it as a trend starting to reverse and decline.
In a downtrend, when the downward momentum is no longer sufficient to push the price to new lows, and the price is pulled up by the force in the opposite direction, breaking through the key resistance level, we will regard it as preparing to start a new uptrend.
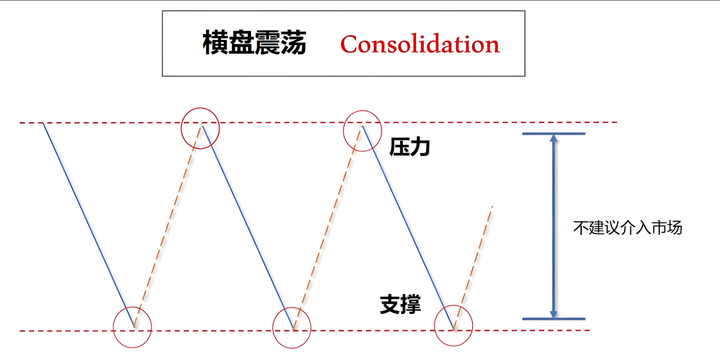
[Sideways Fluctuation]
The third situation: Sideways fluctuation, which is a situation we often encounter in the market. Except for very extreme situations, no market will always rise or always fall.
As long as there are relatively high positions in the market, someone will take profits and leave.
Of course, some people will choose to wait and see, and there will be relatively low positions. Some people will think it is worth buying and start to bottom out.
Plus different news, different opinions, different analyses.
So that the market temporarily forms a balance, without a clear direction, until one of them breaks this balance at a certain moment and then evolves into a one-way market.
Buffett said: Only gods can stably profit from wave trading. So here, my advice to you is to try not to intervene in a transaction in the middle of a sideways fluctuation.
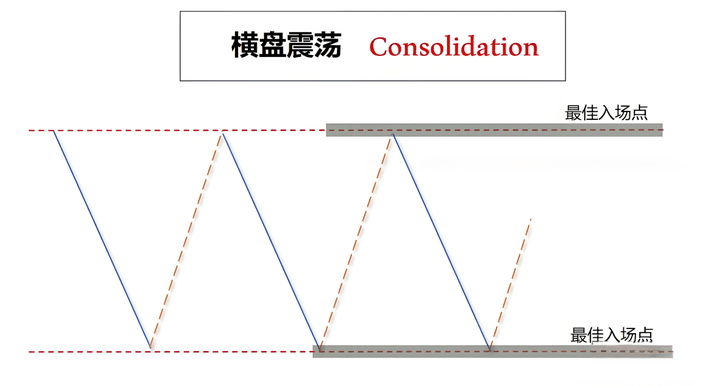
Otherwise, you will be manipulated by the market, and everything you buy will be wrong. If you must trade in a volatile market, please follow the following two points, otherwise you will lose even your pants.
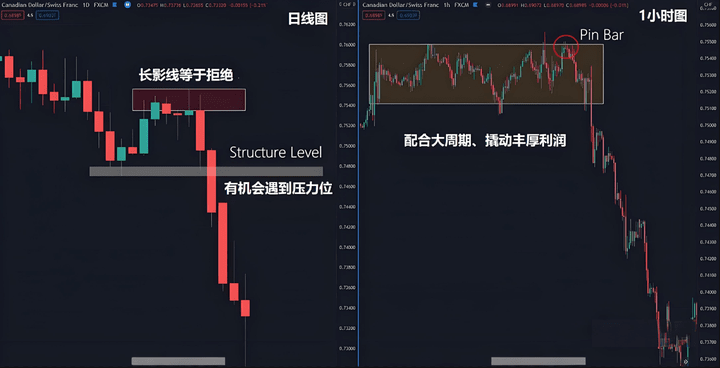
First: Cooperate with large cycles.
Taking this example, I saw on the daily chart that the price is in a downtrend.
Currently, it is making an upward retracement, and the K-line a day or two ago has a long shadow line. This sign seems to prove that the current market retracement may be almost over.
Preparing to continue to fall, and at this time we look at the small cycle 1-hour chart, at the top of the shock market, a Pinbar K-line pattern appears.
is a typical bearish K-line pattern.
So.
When the small timeframe and the large timeframe are well coordinated, the success rate of this trade will be high.
Second: Make sure your profit-loss ratio is no less than 1:1.
I don't think this sentence needs to be explained. If your profit-loss ratio is less than 1:1 for each trade, your position will slowly decrease in the long run. Being willing to lose but not willing to win is a big taboo in trading. Don't do trades with more losses than gains.
Otherwise, your capital curve will be very unhealthy. Speaking of this, the core of Price Action - market structure - is finished.
K-line pattern
3, K-line shape
Congratulations, you have successfully entered the door of Price Action. What you need to do in the future is to look at more charts and practice more.
As long as you can accurately identify the several situations I just mentioned, you will be able to identify what the market is doing in any cycle and in any situation, which will help you filter out many wrong decisions and formulate the right trading plan more flexibly.
Greatly improve your trading performance. In the components of Price Action, Price accounts for a large proportion.
At the beginning of the article, I mentioned that the K-line candlestick is a visualized price.
We can obtain a lot of information that is helpful to our market analysis through K-lines. However, in order to make our transactions more convenient, the market has formulated regular quantitative signals for us, so various K-line patterns have been derived.
Many times, in addition to the market structure we just learned, we also need K-line patterns to provide us with double security, give us confidence, and trigger our trades. So learning K-line patterns is also important.
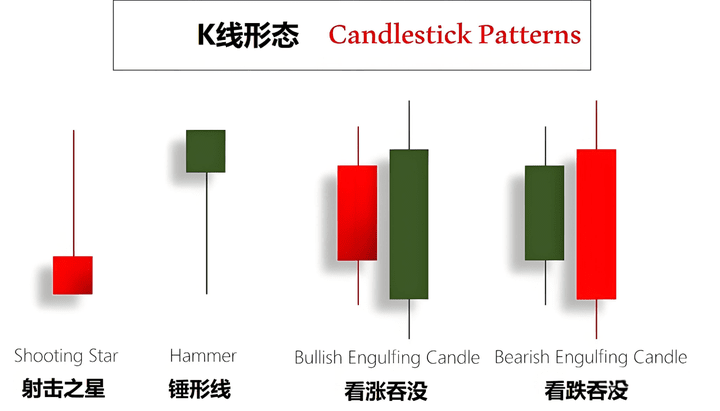
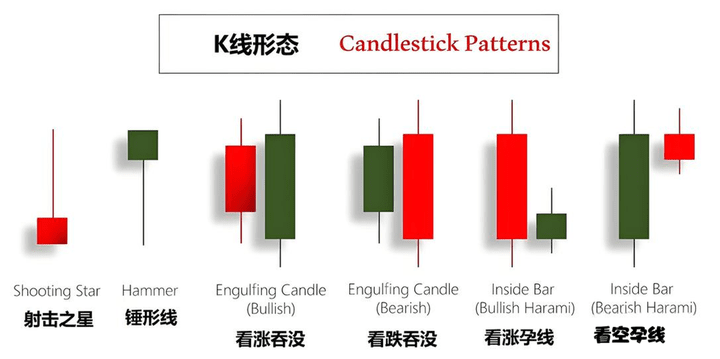
In addition to the shooting star, hammer line, and bearish engulfing pattern we mentioned earlier.
(Novice entry, the root of market profit, interpretation of the three levels of yin and yang (K-line))
Today I will share a more useful K-line pattern here. First, I will briefly introduce the definition of this pattern, and then I will tell you how to find the most advantageous position in the market structure of Price Action, and combine and use this K-line pattern to enter the market and win a high-probability trade.
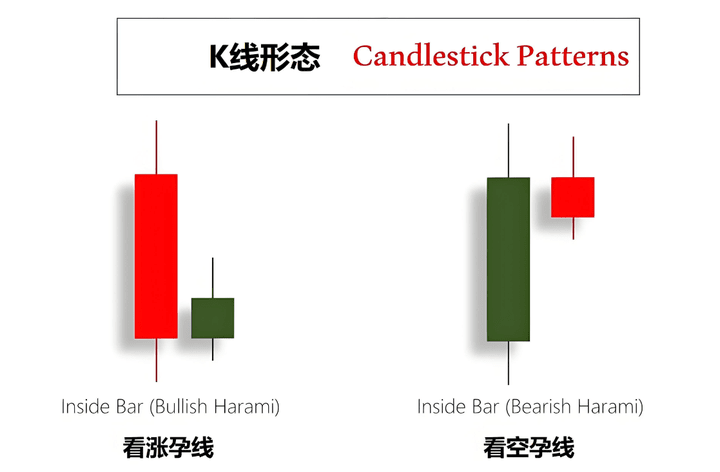
InsideBar (harami pattern)
Because its shape is like a pregnant woman, so the Chinese name is bearish harami and bullish harami. The bullish harami is composed of a yin line plus a very small yang line. Whether the entity or shadow line of this yang line is within the previous K-line. The bearish harami is the opposite. The entity and shadow line of the yin line are within the previous yang line. Generally speaking, there are two common ways to use this pattern to trade.
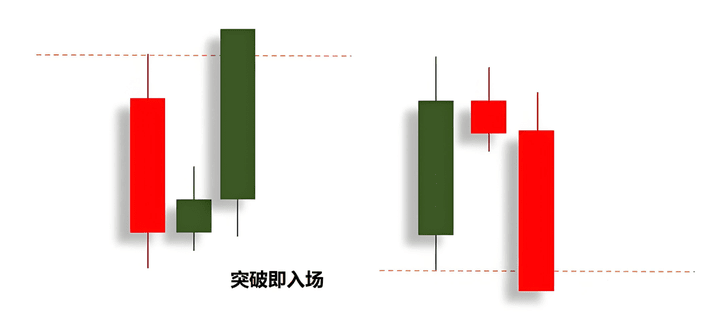
The first.
When the price breaks through the high or low of the previous K-line, we will enter the market to buy or sell regardless of whether the latest K-line has ended. This belongs to left-side trading.
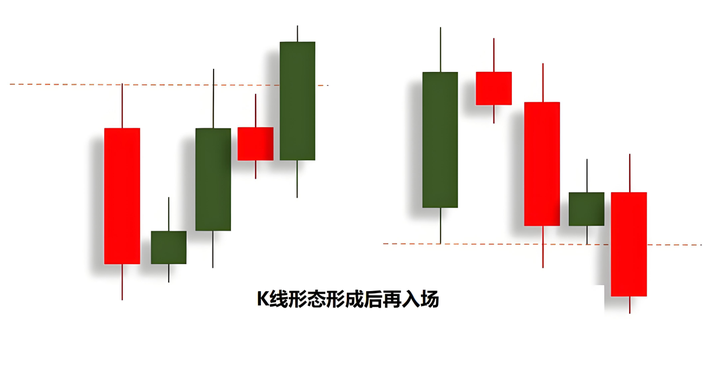
The second more conservative approach is to wait for the current K-line to truly end at the high or low of the previous K-line, and only enter the market after it has stabilized and established a direction.
When we refer to K-line patterns for trading.
The most taboo thing is to immediately enter the market when we see a Pinbar, sell when we see a Pinbar, and buy when we see a bullish engulfing pattern.
.......
This is a very wrong approach, because K-line patterns should be used as confirmation signals and can only be used as assistance. Their composition often does not exceed 3 K-lines, so they cannot represent more comprehensive information and trends. Using them alone to make trading decisions.
is actually not a wise choice. The best way is to cooperate with the market structure and be in the most advantageous position.
Use the most accurate entry timing. If you can understand this principle, I believe you will stay away from the bad mentality of chasing highs and killing lows, and you will not be too far from stable profits.
Let's look at two examples of charts.
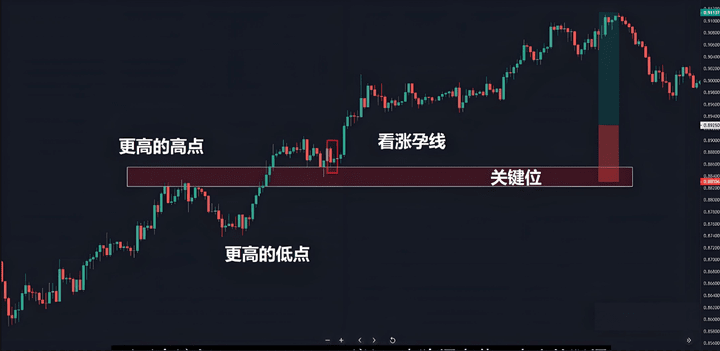
The first example: Trend continuation.
In the picture above, the price started to retrace after making a new high here. At this time, a bullish harami appears here.
A yin line夹着a small yang line, but this retracement has slowed down. When the K-line pattern ends, it is followed by a large yang line.
The closing price is higher than the bearish engulfing pattern, proving that the buying party has officially returned.
We choose to enter the market after it closes here, and set the stop loss at the nearest key level.
The result proves that our trade is correct. The K-line smoothly drives the price upward and successfully reaches the take-profit point.
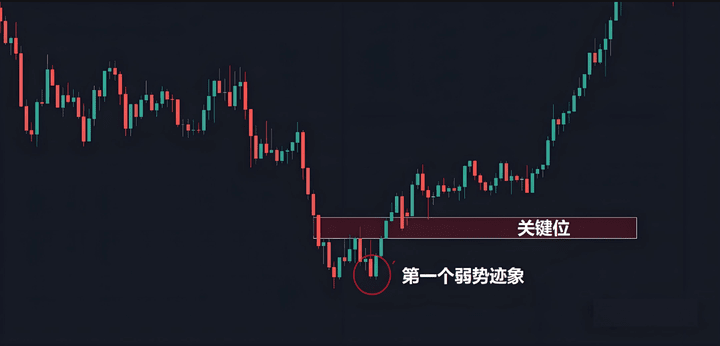
The second example: trend reversal.
In the picture above, we see that after a downtrend has lasted for a period of time, the price no longer creates new lows.
This is the first sign, indicating that the trend is beginning to weaken. After the price breaks through this key level.
Then return to this position and do a.
Harami pattern, a yin line completely wraps a small yang line.
When the next K-line ends, it officially confirms that the selling party's attempt has failed and the trend continues to rebound.
Chart pattern
4, Chart form
What is a chart pattern?
I believe if you have done technical sharing for a period of time.
You will find that the market will constantly do one thing through repeated patterns.
The chart pattern provides such a trace.
So that we can have traces to follow.
Discover what the market is doing at this moment and the logic behind it.
Today I am here to share two with you.
Chart patterns often seen in the market.
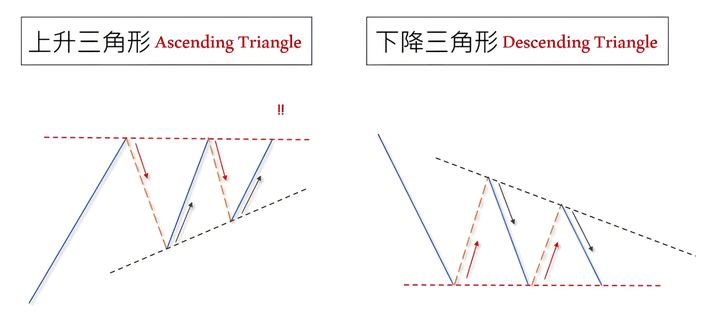
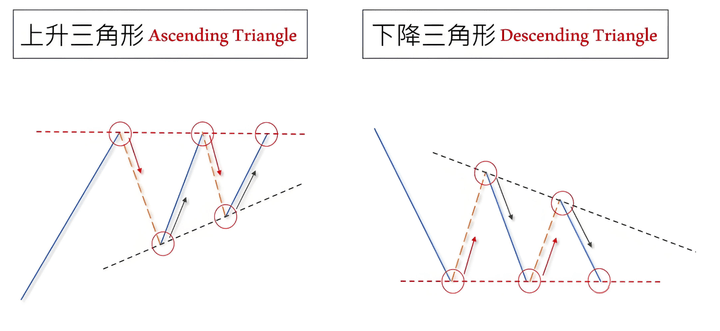
Ascending triangle
Descending triangle
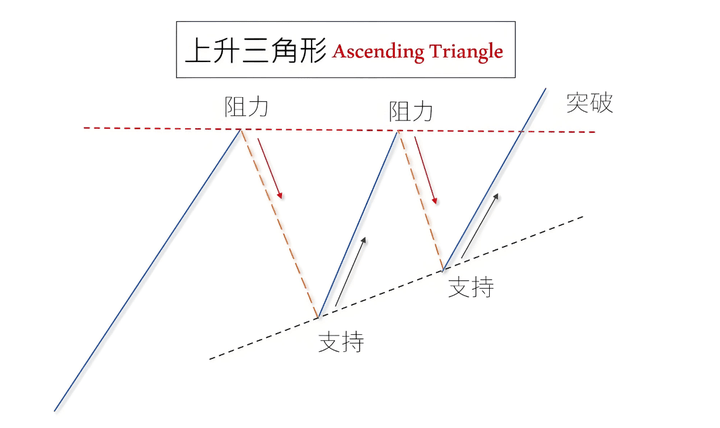
In an upward trend.
The price encounters the first resistance level, which will become the base of this pattern. The price starts to move slightly in the opposite direction, and this low point will become the lowest point of this pattern.
When the price returns to the same position as the first resistance level again, it will encounter resistance again and move in the opposite direction again, but this time the decline will be smaller than the previous time, and the downward force is significantly weakened.
Form the second support here.
We connect the two low points into a straight line. Basically, this pattern has formed. When the price returns to this level of resistance for the third time, the price successfully breaks through the resistance and continues an upward trend.
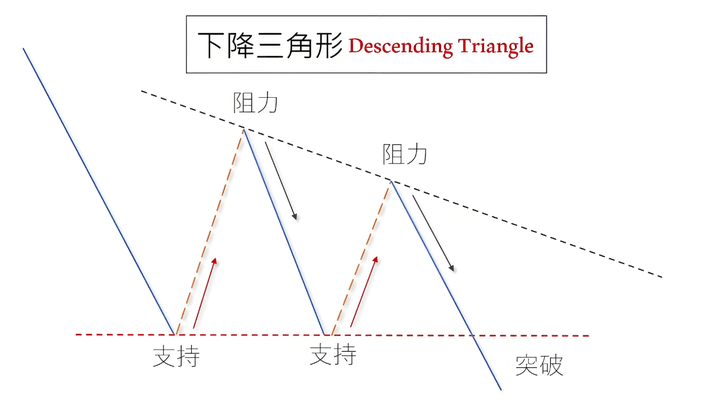
The falling triangle is the same.
The impact of the horizontal support level on the price is less than one breakthrough each time, and the final breakthrough is successful, continuing a downward trend.
Generally speaking.
The price must touch this pattern at least 5 times, up 3 down 2 or down 3 up 2. It is completely okay to touch it more than five times, but if you immediately enter a trade just because it breaks through, it is a very risky behavior.
In the theory of Price Action.
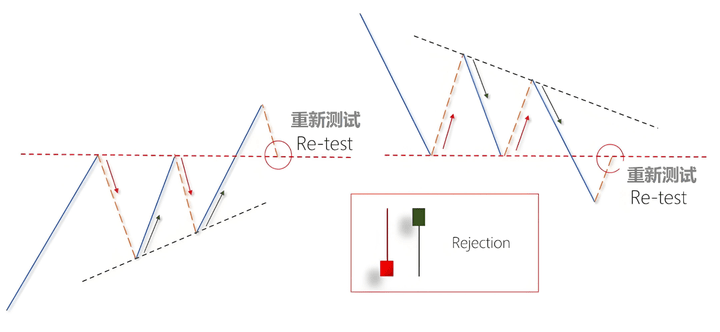
There is a very important concept called Re-Test, also called backtesting, which means that no matter what kind of market and target, after the price breaks through the key level, it will often retrace back to the key level.
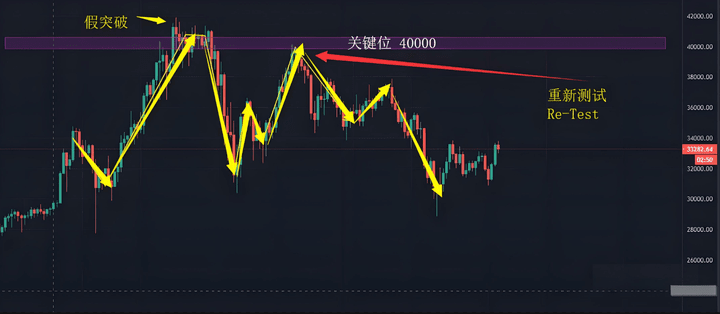
For example, in the 4-hour chart of BTC above, after the price breaks through $40,000, it no longer creates new highs, and then immediately turns downward, followed by a rebound.
And then returned to the high of 40000, which took a total of 5 days, which is a very favorable example of backtesting.
So, in order to increase the probability of winning a trade, I usually wait for the price to break through and return to this level of resistance or support.
Wait for the market to help me test it again. If I see that there is obvious rejection, that is, a long K-line shadow line or something similar, I will enter the market. Although this approach is more conservative, it will sometimes cause you to miss some trading opportunities.
But this technique will have a much higher success rate than just entering a trade based on its breakthrough. The market is never short of trading opportunities.
And the most lacking thing is patience. Whoever has patience can make money.
For example, the market in the picture above.
People who are impatient will feel that the price is falling from 41000, and they dare not chase the fall to go short, nor dare to go long, and only complain that they did not seize the opportunity. People who have learned to use Price Action and understand backtesting are waiting to bottom out.
Because he believed that the price would definitely rise again, so he bottomed out around 30000 and entered the market with a heavy position. When the price briefly stayed at 40000 and did not break through the key level.
Immediately close the position, and then go short in reverse. You can make a lot of money with one big wave. This is called waiting for the opportunity and making a name for yourself!
Finally, let's share a set of iron rules for currency trading:
I. Replenish positions when trapped to seek breakeven, and extravagant profits are greed. When trading currencies, it is inevitable that several currencies will be trapped. At this time, be sure to remember not to try to turn losses into profits instantly. A hasty approach will only make you fall into a quagmire and unable to extricate yourself. You should honestly replenish your positions and try your best to protect your principal, so that you can have a steady stream of income like a trickle.
II. A high wave on a calm surface, beware of big waves behind. The currency market seems calm on the surface, but in reality, there are undercurrents. Do not be deceived by the insignificant small gains in front of you, always maintain a high degree of vigilance, and always be wary of the violent and large fluctuations that may occur next.
III. There will be a callback after a big rise, and the K-line will draw a triangle for many days. When the currency price soars all the way, don't be overjoyed and complacent. Because there will be a callback after this surge. Operators need to be able to see the K-line trend, isn't it the regular equilateral triangle outlined over many days?
4. Buy yin but not yang, sell yang but not yin, and move against the market to become a hero. When buying coins, choose to buy decisively when the price falls. When selling coins, make a decisive decision when the price rises. By going against the grain, you can win by surprise and become a hero in the currency circle.
V. Do not sell when rising, do not buy when diving, and do not trade when consolidating. Do not rush to sell when the currency price rises, and do not rush to bottom out when diving. When it is in a consolidation state, you must firmly control your hands, observe calmly, and respond to all changes with no change.
6. Look at support levels in an uptrend and resistance levels in a downtrend. When the currency price is in an upward trend, pay close attention to the support level to prevent a sudden pullback; when the currency price is falling, pay attention to the resistance level so that you can decisively bottom out at the right time.
7. Full仓操作是大忌,一意孤行不可取,无常变化要知止,进出自如在观机Do not operate with a full position. It is a bad strategy to act arbitrarily. The currency market is unpredictable. You must know when to stop when you see good results, and enter and exit freely by observing the situation. Only by calmly observing the changes in the situation can you seize the best opportunity.
8. Trading currency is about mindset. Greed and fear are major harms. Be cautious about ups and downs, and be calm and relaxed. An excellent operator's mindset is very important when operating in the currency market. Greed and fear are our greatest enemies. Avoid chasing highs and killing lows. Always maintain a peaceful and calm mindset, so that you can freely travel in the currency market.
Finally, let us firmly remember these eight operating formulas and move forward steadily on the journey of炒币. The road of炒币 is full of challenges and opportunities, and these eight practical operating techniques are like a beacon that illuminates the way forward. When we strictly follow “replenish positions when trapped to seek breakeven, and extravagant profits are greed”, we can remain calm in the face of difficulties and use stable strategies to protect our principal, laying the foundation for future profits.
“A high wave on a calm surface, beware of big waves behind” reminds us to always be vigilant, not to be deceived by the superficial calm, and to keenly observe the potential risks in the currency market. Entering the market involves risks, and operations require caution. Don't be envious when you see others making money, and don't blindly follow others' advice. You are responsible for your own money. Investing is like planting a tree, it takes time and patience. If you plant it well, you will have abundant fruits; if you don't plant it well, it may rot from the roots.
Even the most diligent fisherman will not go fishing during the stormy season, but will carefully protect his fishing boat. This season will always pass, and a sunny day will always come! Follow me, and I will give you fish and teach you how to fish. The door to the currency circle is always open. Only by going with the flow can you have a smooth life. Collect it and keep it in mind!