I believe I have the most say in this as a 10-year veteran in trading coins. Ten years ago, I also scoffed at technology and was not interested, thinking it was dry and untrustworthy. I felt that most people's statements were nonsense. During those three years, I was unilateral and worked hard, only to end up with nothing.
I even borrowed 400,000 from a relative to continue my path to success, and then I quit my high-paying job to trade coins full-time. Now, with 50 million in the market, just the interest alone brings in 50,000 every day.
In the coin world, relying on intuition to operate alone is very easy to be harvested by the market. Technical analysis is an essential tool, and MACD (Moving Average Convergence Divergence) and KDJ (Stochastic Indicator) are two common trading indicators. The problem is that these two indicators each have their strengths and weaknesses; using them alone may lead to pitfalls, but if combined, the winning rate can be significantly improved.
So, how to make good use of these two indicators? Today, I will share practical skills for combining MACD and KDJ, allowing you to judge buy and sell points more accurately, increase trading win rates, and avoid market traps.
Technical analysis in the coin market: Stochastic Indicator KDJ
1. What is the KDJ indicator?
KDJ is calculated based on the highest price, lowest price, and closing price, resulting in K value, D value, and J value.
Values form a point on the coordinates of the indicator. Connecting countless such points creates a complete
KDJ indicator can reflect the price fluctuation trend. It is used to judge the overall price trend changes.
It is also one of the oscillators; KDJ is also a commonly used index, serving as a guide, but does not possess
Strictly speaking, it plays a decisive role. Usually, these oscillators are used as support tools; using them alone can sometimes lag.
Malfunction. It is more practical to apply it to coins with a larger circulation and more active trading.
As the KDJ line is essentially a concept of random fluctuations, it is more suitable for grasping medium to short-term market trends.
Accurate.
2. KDJ settings:
As shown, click the indicator, click KDJ, click parameter settings, set the parameters and save. The default parameters are 9.3.3.
Common parameters. K is the fast line (white). D is the slow line (yellow).
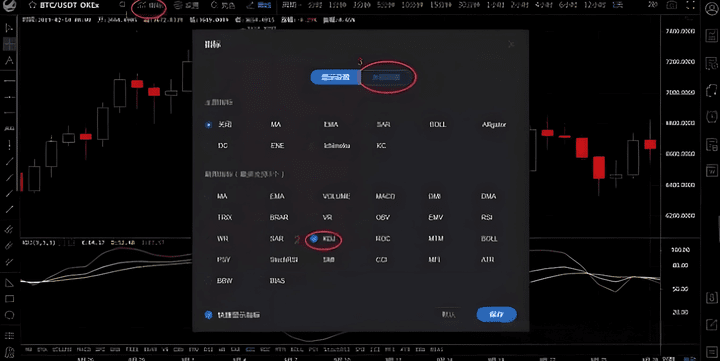
The red circle on the right represents the 0-100 value range.
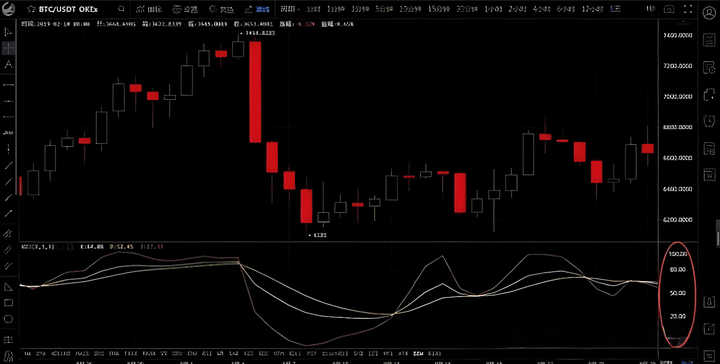
3. The relationship with overbought and oversold.
It mainly uses the real amplitude of price fluctuations to reflect the strength of price trends and overbought and oversold phenomena, issuing buy and sell signals before the price rises or falls.
In actual combat, the judgment of the overall overbought and oversold points is more sensitive than RSI.
When the yellow D line appears above the value of 80, it indicates an overbought phenomenon; when it appears below the value of 20, it represents entering an oversold phenomenon.
4. What are golden crosses and death crosses?
1. Golden Cross: The K line (white line) crosses above the D line (yellow line) and runs above the D line to form a golden cross. If the crossover point
Below the value of 20 indicates a golden point for price rising or consolidating. Generally, after a golden cross appears, the J line (purple line) will run above the yellow line.
2. Death Cross: The K line (white line) crosses below the D line (yellow line) and runs below the D line to form a death cross. If the crossover point
Above the value of 80 indicates a price drop or consolidation. Generally, after a death cross appears, the J line (purple line) will run below the yellow line.
In simple terms, a golden cross is a buy signal, and a death cross is a sell signal.
In addition to golden cross and death cross trends, there is a third situation. When the K, D, J three lines of different colors are very close together, entangled with each other, this generally indicates that the coin price will fluctuate in the short term. The closer the three lines are, the smaller the fluctuation range; conversely, a larger fluctuation range is indicated, primarily looking at the J line (purple line).
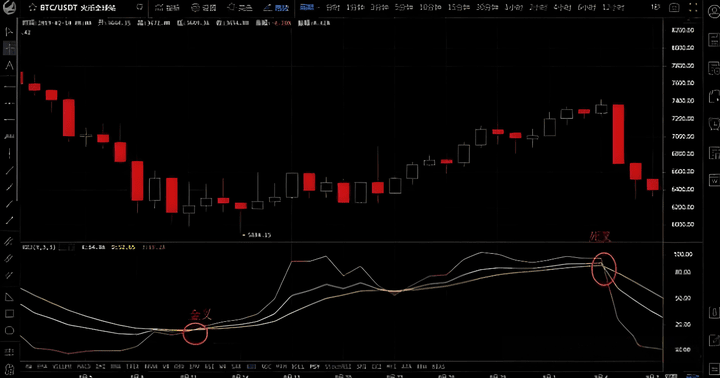
4. Case study:
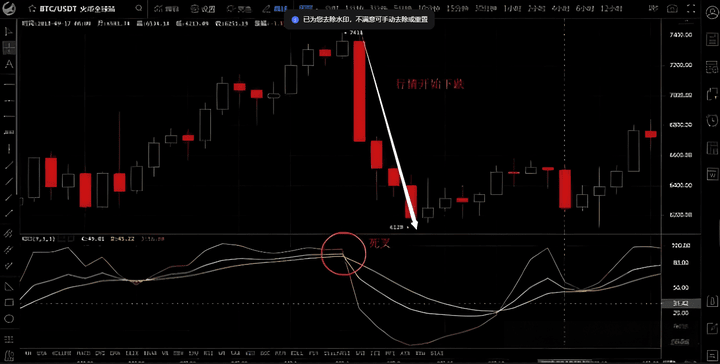
A death cross appears above the value of 80, and the market begins to decline.
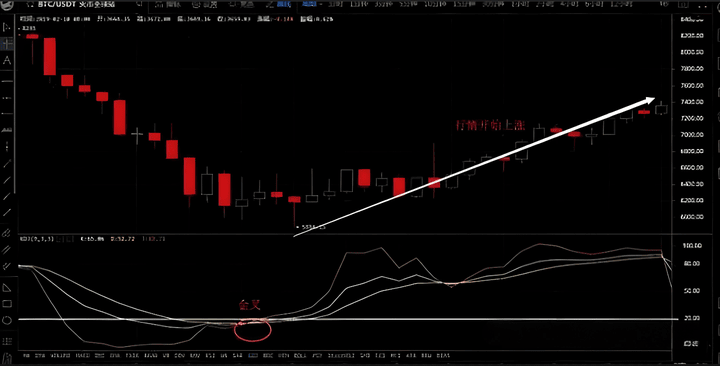
A golden cross appears below the value of 20, and the market begins to rise.
The use of KDJ is only as an auxiliary means. Investors should refer to the K line combinations of coin prices, volume-price relationships, trend patterns, and the KDJ indicator for analysis. When the buy and sell signals they emit tend to be consistent, such buy and sell signals are relatively reliable.
Next, let's understand the characteristics of MACD and KDJ. Only by mastering their advantages and disadvantages can we better apply them in trading.
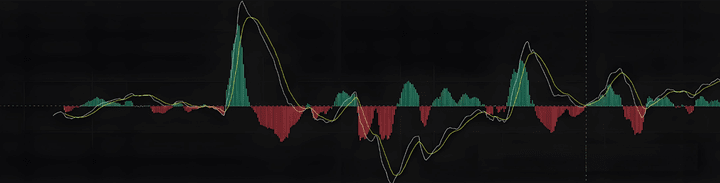
1. MACD: The compass for trend judgment.
MACD is mainly used to judge medium to long-term trends, helping us see the big direction of the market. Its advantage is stability; it does not frequently issue signals, but its drawback is strong lagging, making it unable to quickly capture short-term opportunities.
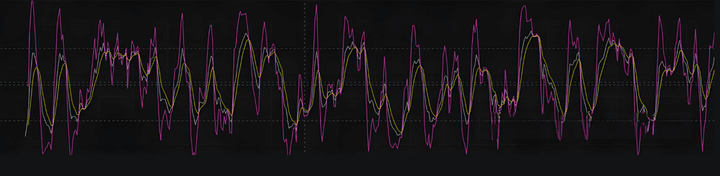
2. KDJ: The scout for short-term trading.
KDJ is more sensitive than MACD, suitable for capturing short-term buy and sell signals, reacts quickly, but is prone to false signals, leading to misjudgments.
MACD can grasp the big trend, while KDJ can filter out short-term noise. Combining them allows KDJ to capture opportunities in advance, compensating for the lagging MACD signals, thus achieving improved trading accuracy and avoiding being misled by the market! How to apply it specifically, let's move into practical combat!
Usage 1:
MACD dual lines upward + KDJ three lines diverging upward = bullish trend initiation.
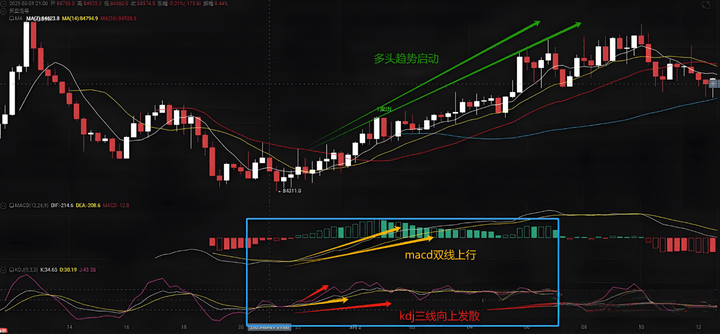
It should be noted that the MACD fast and slow lines are moving upwards, preferably breaking through from below the zero axis, while KDJ three lines are rising synchronously, and the J line changes from negative to positive. This indicates that the market has entered a bullish trend, and the main force may have entered the market, and the price may continue to rise.
So when the price breaks through key resistance, consider entering the market. However, if the KDJ quickly enters the overbought zone, be cautious about chasing highs and wait for a pullback. When the market trend gradually forms, we need to pay attention to whether there are further buying opportunities. If the market experiences a brief adjustment but does not damage the overall trend, the next signal may appear.
Usage 2:
MACD low-level oscillation + KDJ J line low point rising = Main force accumulation may occur.
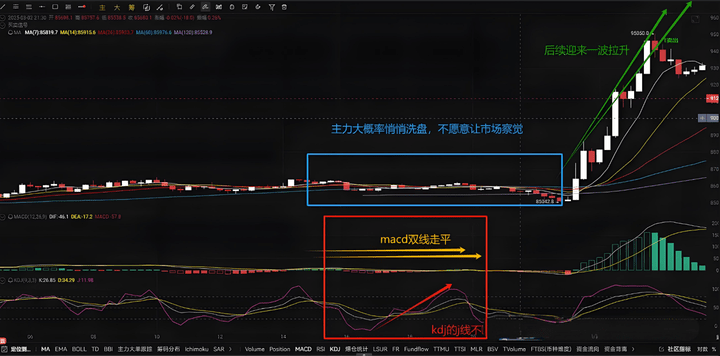
If the MACD fast and slow lines are oscillating at a low level, and the KDJ's J line low points are continuously rising in a staircase pattern, it indicates that the market is entering a balanced state, and the rising J line of KDJ may mean that the main force is accumulating at low levels, unwilling to let the market notice.
At this time, what we need to do is observe whether the coin price stabilizes at the support level, and confirm it with trading volume. If KDJ forms a low-level golden cross and MACD has an upward trend, consider gradually building positions.
During the main force's accumulation phase, the market may not immediately surge, but as the chips concentrate, the trend may gradually rise. At this time, if the market further stabilizes, we should closely monitor for stronger reversal signals.
Usage 3:
MACD secondary flip to green + KDJ low-level golden cross = reversal signal.
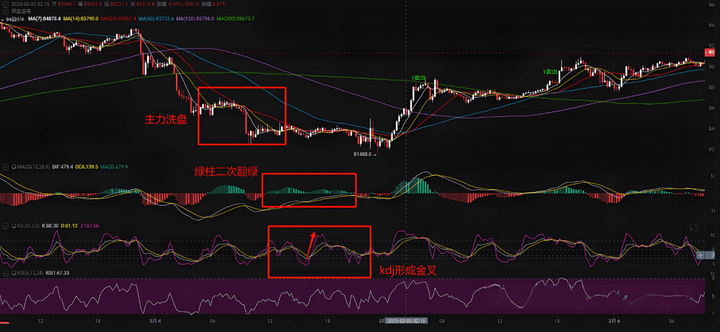
When the MACD red column shortens and then grows again, forming a 'secondary flip to green,' and the KDJ forms a golden cross at a low level, this usually indicates that the previous market decline may be a washout by the main force, and the price is expected to reverse.
At this moment, you should closely monitor whether the coin price breaks through the previous high. Once it breaks through, you can increase your position accordingly. If the trading volume increases again, the signal is more reliable!
However, it should be noted that not all rebounds are strong recoveries; we need to observe market sentiment and see if there are external favorable factors driving the market further up.
Usage 4:
MACD and KDJ both forming a death cross = increased risk of decline.
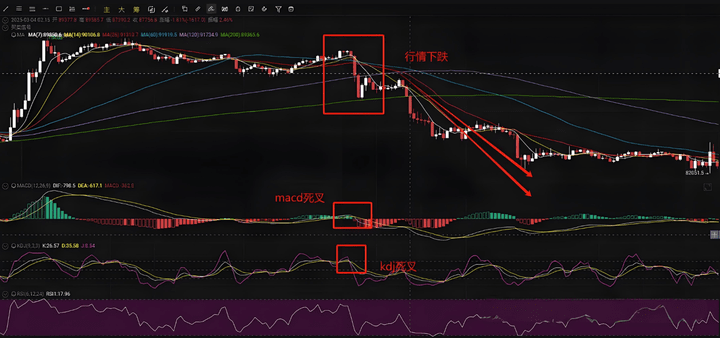
If at this time, the MACD fast and slow lines cross down, and the KDJ three lines sync down, it indicates that both short-term and long-term trends in the market have weakened, and it may enter a downward phase.
So when the coin price is high, consider taking profits or reducing positions; if the coin price is low, observe whether it is a false breakdown to avoid panic selling.
Here it is important to note that if the overall trend of the market still goes up but there is a short-term pullback, we need to further observe the magnitude of the adjustment to determine whether it is suitable for low absorption.
Usage 5:
MACD flat above the zero axis + KDJ death cross = possible short-term pullback.
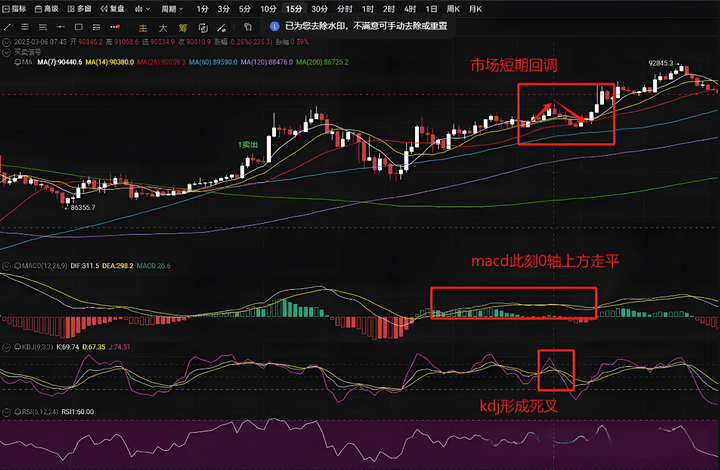
MACD is still above the zero axis, but the fast and slow lines begin to flatten out, and KDJ shows a death cross. At this time, MACD being above the zero axis indicates that the overall market is still in a bullish trend, but the KDJ death cross means that a pullback may occur in the short term, likely indicating a washout by the main force.
Therefore, we need to observe whether MACD shows a death cross. If it is just flat, do not act yet. If KDJ quickly repairs after a death cross, and MACD does not break the zero axis, consider buying on dips.
Advanced skills: How to improve the accuracy of MACD + KDJ?
1. Confirm signals with trading volume.
If MACD/KDJ issues a buy signal with increased trading volume, the signal is more reliable.
If the trading volume does not match, it may be a false signal and should be approached with caution.
2. Combine with support and resistance levels.
At key support levels, a low KDJ golden cross is more effective.
Near important resistance levels, be cautious of a high KDJ death cross.
3. Respond flexibly to different market conditions.
In a trending market, MACD signals are more reliable.
In a ranging market, KDJ may be more effective.
Combine market sentiment and news to improve judgment accuracy.
Therefore, if you want to use MACD + KDJ more steadily, first do the following:
1. Avoid using a single indicator for judgment; MACD looks at the big trend while KDJ captures short-term signals. Using them together is more precise.
2. Use different strategies for different market conditions: Trend market: MACD is the main focus; ranging market: KDJ is more effective.
3. Combine market factors to comprehensively analyze trading volume, support and resistance, market sentiment, etc., to avoid being misled by a single signal.
Finally, I want to say that using MACD + KDJ together can improve trading win rates, but the market changes rapidly, and no indicator is 100% accurate. The key is to apply them flexibly and manage risks reasonably to survive and profit in the coin world. Learn this method to avoid detours, improve win rates, and steadily increase account gains!
If you are also a tech enthusiast, take a look at the following image:

Finally, I will share a set of iron rules for trading coins:
1. Focus on trends, only pay attention to hot sectors, and try to trade the leaders as much as possible;
2. Fundamentals, only select those with a circulating market value of over 10 billion and have been around for two or three years;
3. In technical analysis, only trade coins in an upward trend; that is, when the 20-day moving average is flattening or turning upwards.
4. Break point rule, focus on two key points: buy near the 20-day low when prices are high, and sell when trading volume increases.
5. Remember not to borrow money for these, position allocation is very important; do not heavily invest in any single coin.
6. If you make a mistake due to an accident or impatience, please correct it immediately, and do not have the slightest luck; try to avoid mistakes.
7. Always pursue the top leader; otherwise, do not chase;
8. Patient investment masters achieve wealth appreciation through waiting, refusing the urge for overnight success in trading.
9. Care about the coin's blood-making ability and prospects as much as possible, rather than solely pursuing a cheap price;
10. When encountering setbacks, please read the above 9 points three more times.
Finally, keep in mind:
The coin world is a marathon; stability is far better than fast wins. What is gained by luck will ultimately be lost by strength. Only by integrating position management into instinct can one survive in a harsh market.
Remember: living means having the qualification to wait for the next round of reversal.
No matter how diligent a fisherman is, he will not go out to sea to fish in the season of storms, but will carefully guard his fishing boat. This season will eventually pass, and a sunny day will come! Follow me, and I will teach you both fishing and fishing skills. The door to the coin world is always open. Only by going with the trend can you have a life in tune with the trend. Remember this!