Having been deeply involved in the cryptocurrency space for ten years, monitoring and analyzing the market has become a habit. On August 19, the movements of BTC and ETH hide secrets. Combining candlestick patterns and liquidation data, I will provide in-depth analysis of current opportunities and risks, accurately grasping operational rhythms.
1. BTC: The tug-of-war in the volatile range
(1) Candlestick trend: Seeking direction in volatility
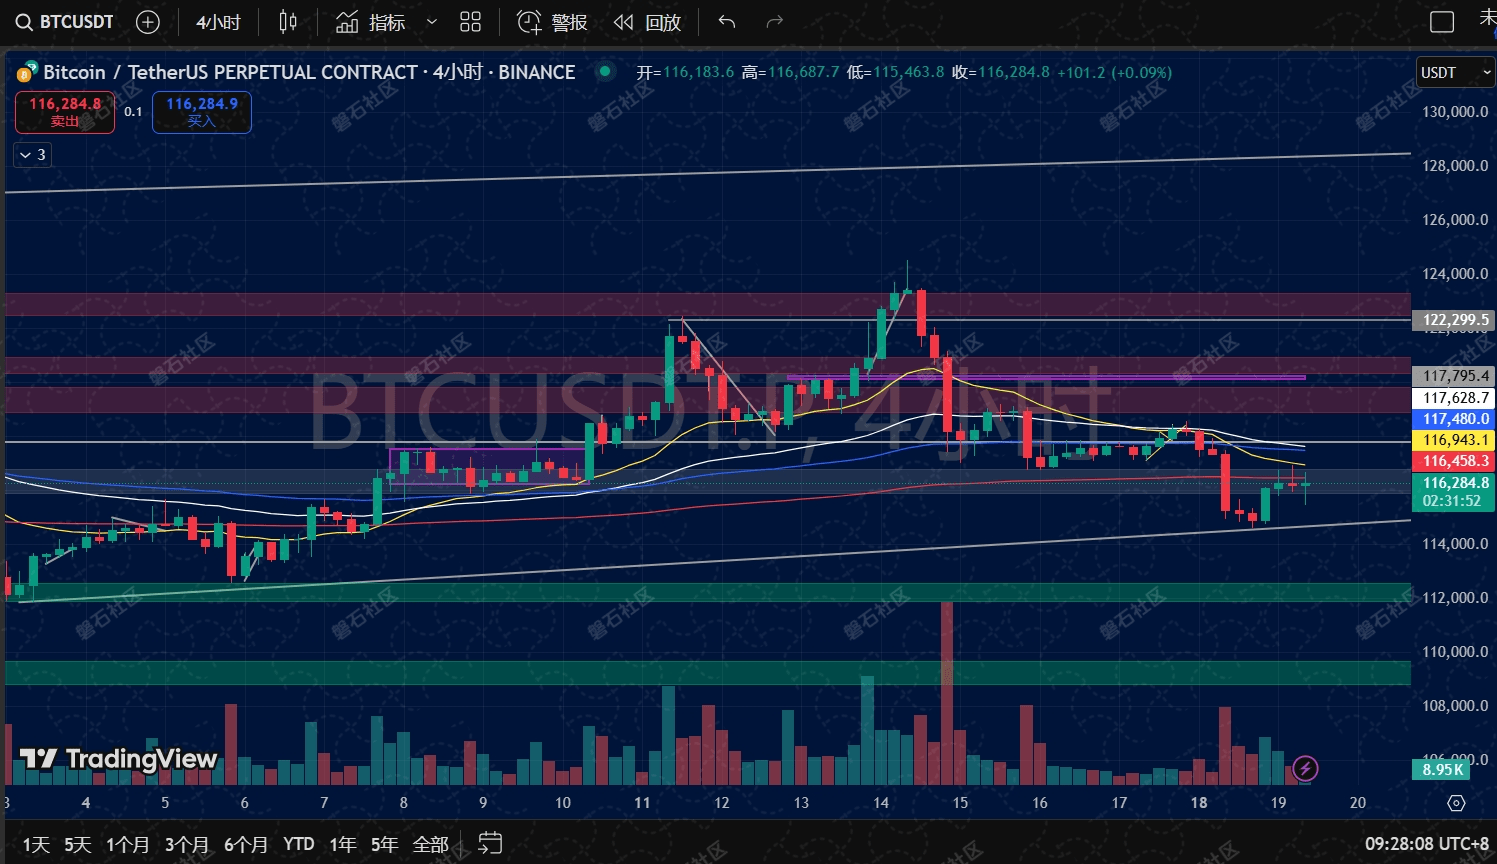
In the BTCUSDT 4-hour chart, the current price fluctuates around 116,412.8. After a small trend run, it has entered a volatile range with moving averages tightening, where bullish and bearish forces are balanced in the short term. This is a typical "prelude to direction selection."
The lower green support zone (112,000 - 114,000) is the "guard line" for bulls. If the price bounces back and stabilizes in this range, combined with moderate volume increase, it can be seen as a low-buy signal, corresponding strategy is to layout gradually and bet on the rebound; the upper purple (117,482) and gray (122,299) pressure levels need to break through with volume to confirm a trend reversal, otherwise it is likely to meet resistance and fall back. At this time, caution is needed for the risk of chasing highs.
(2) Liquidation data: The "battlefield scars" of bull-bear games
The Bitcoin exchange liquidation map shows the current price is 116,401, with dynamic changes in the cumulative long and short liquidation intensity hiding the details of capital games. When prices fluctuated earlier, liquidation volume concentrated and exploded, indicating a fierce "stranglehold" at critical price levels, with many retail investors being liquidated due to blind operations.
Although the liquidation volume has eased currently, it does not mean that risks have dissipated. In terms of operations, it is recommended to primarily use a strategy of "light positions for trial and phased building of positions," for example, first taking 10-20% of the position to test the trend. Wait for a clear breakthrough of support/resistance and volume cooperation before adjusting positions to avoid being passive with full positions.
2. ETH: Divergence after rebound, key to watch support
(1) Candlestick structure: Adjustment facing resistance
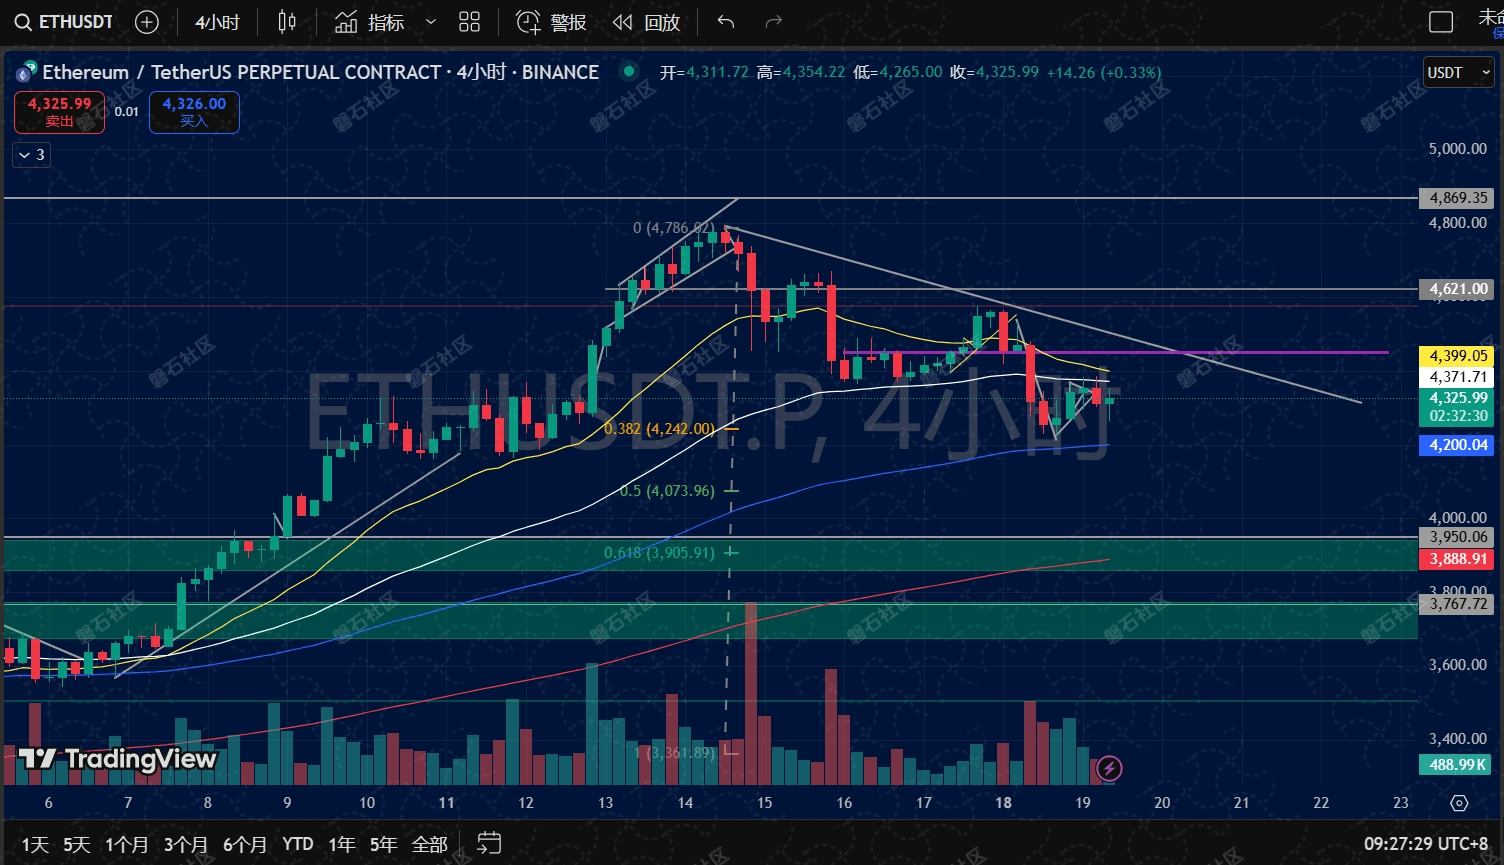
In the ETH 4-hour chart, the price fluctuates around 4,336.95. The rebound in late July was impressive, but it has recently entered an adjustment period, which is the result of "profit taking" and "bull-bear divergence" occurring during the upward trend.
From the Fibonacci retracement levels, 0.382 (4,243) and 0.5 (4,077) are key supports. If it stabilizes at these levels and shows a "long lower shadow + decreasing volume" signal, it indicates strong bullish support, which could lead to a rebound; if these supports are lost, the lower level of 3,889 (previous dense transaction area) will become a new test. If the upper pressure level of 4,400 cannot break through with volume, the short-term volatile pattern will be hard to change, and caution is needed for downward adjustments after consolidation.
(2) Liquidation data: Signals of short-term bearish rise
The ETH exchange liquidation map shows the current price is 4,336.7, with cumulative short liquidation intensity (green line) rising and long liquidation intensity (red line) decreasing, reflecting a short-term rise in bearish strength. This may be due to some bulls taking profits and bears attempting to enter, but whether this can continue to suppress prices depends on the gains and losses of support levels.
If the price drops below 4,200, the bears may further exert pressure, and operations need to reduce positions to avoid risks; if it holds the key support and rebounds, it indicates that the bulls still have counterattack capability, and positions can be increased accordingly. At this time, "light positions + stop-loss" is the core strategy, such as setting a stop-loss of 5-8%. Once the level is broken, exit in time to protect the capital.
3. Overall operational thinking: Patiently wait for "certainty"
Currently, both BTC and ETH are in the "bull-bear divergence, trend yet to clarify" stage. For ordinary retail investors, "patience" is the best strategy:
Holders: Strictly implement stop-loss and take-profit. If BTC drops below 114,000 or ETH drops below 4,200, decisively reduce positions to avoid small losses turning into large ones; if the position is profitable, consider raising the stop-loss to protect profits, allowing gains to "run."
Observers: Wait for clear signals before entering the market. For example, BTC stabilizing above the moving averages and breaking through pressure levels with volume, or confirming stability after testing support; ETH forming a rebound structure and reclaiming key resistance. Entering at this time has better winning odds and risk-reward ratios.
In the cryptocurrency world for ten years, I've seen too many lessons from chasing highs and cutting losses. The more chaotic the market, the more you need to stabilize your rhythm and operate according to "signals" rather than "emotions." Want to get in-depth analysis and accurately grasp market trends every day? Follow me for timely breakdowns of market changes, helping everyone avoid pitfalls and seize opportunities, steadily profiting amidst the storms of the crypto world~
@合约狠人Garry #BTC #ETH

