📊 SOL/USDT Technical Update – 4H Chart (Binance)
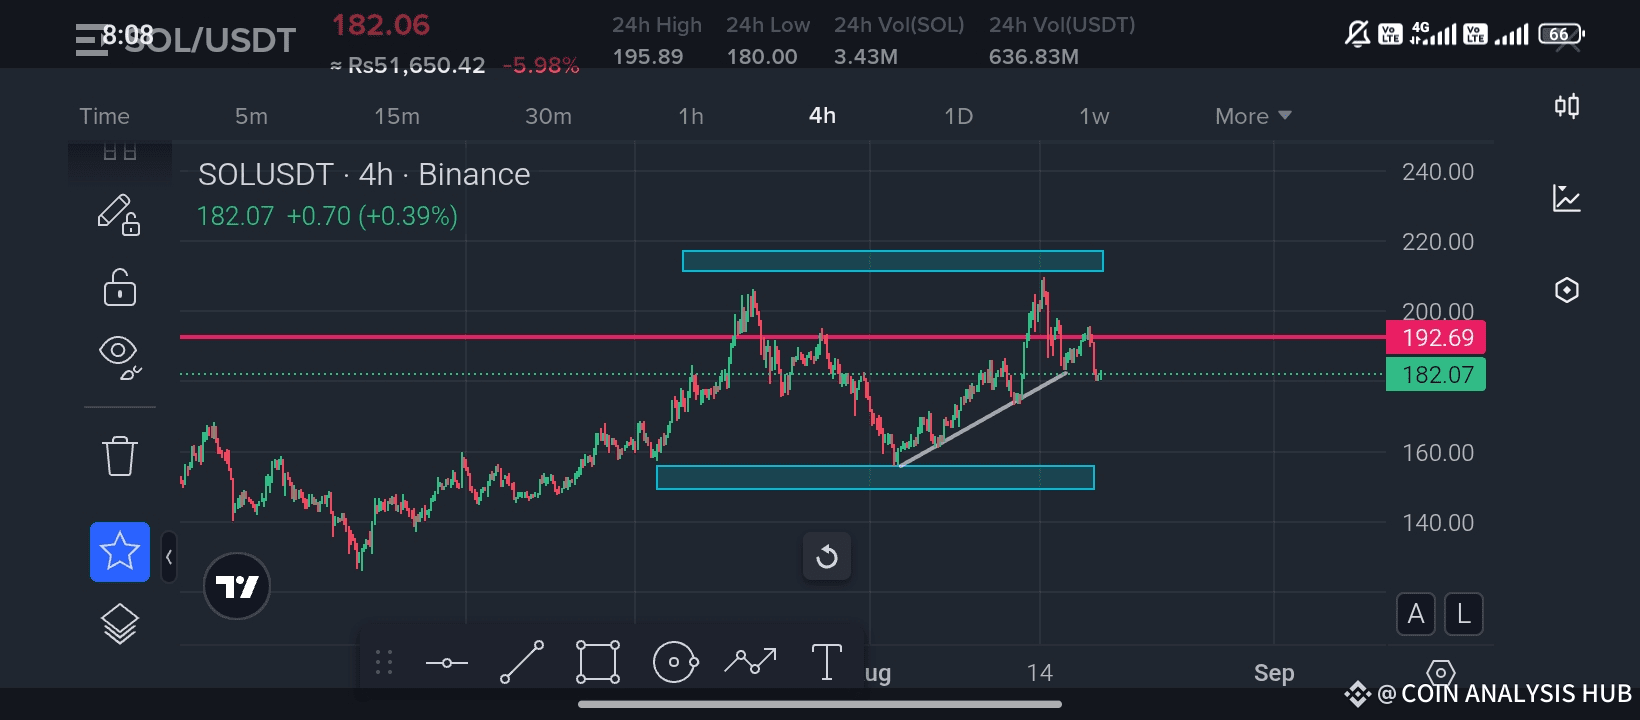
SOL is currently trading around $182.07 (+0.39%) after recently rejecting from the $195-$200 resistance zone.
🔎 Key Observations:
Price is respecting the ascending trendline, showing higher lows structure.
Strong resistance zone: $192 – $200 (marked in red & upper blue box).
Strong support zone: $165 – $170 (lower blue box).
Break and close above $192-$200 could open the way towards $215 – $225 in the short term.
If SOL loses the trendline & $170 support, a deeper correction towards $155-$160 is possible.
⚖️ Trader’s Eye:
Currently, SOL is consolidating between support at $170 and resistance at $195-$200.
👉 Breakout direction will define the next major move.
Bullish Scenario: Holding trendline + breakout above $200 = strong bullish continuation.
Bearish Scenario: Rejection from $192-$200 & breakdown of $170 = deeper pullback.
📌 Levels to Watch:
Support: $170 – $165
Resistance: $192 – $200
Upside Target (if breakout): $215 – $225
Downside Target (if breakdown): $155 – $160
⚡ SOL is at a critical decision zone – traders should watch closely for confirmation before entering positions.
Best of luck 🤞 🍀 🤞

