I was born in 1988. I trade in cryptocurrencies full-time and make a living from the cryptocurrency circle. I haven't worked since I graduated from university. My current assets are in the tens of millions. I withdraw 100,000 yuan from the cryptocurrency circle every month and don't feel any impact on me. I live a leisurely and free life without intrigue and scheming. I live the life I want.
Every morning, I get up, take my kids to school, then come home and make breakfast. It's around 9:00, and then I turn on my computer and review yesterday's orders. Trading volume in the cryptocurrency market is very low in the morning, so I'm usually busy in the evening. I take a quick break in the morning, then review my trades and compile them into my trading system. Reviewing is really important!
Around 4 or 5 p.m., I usually go for a run in the park or woods, then pick up the kids from school. I go home and sometimes make dinner myself, sometimes order takeout. By the time I'm done, it's usually around 7 or 8 p.m., which is when the US stock market opens and the cryptocurrency market starts to get wildly active! Just seize a few opportunities and you'll reach your daily goal!
If trading is slow or the market is declining, and I'm short of opportunities, I'll attend trading events or have dinner with friends. This kind of communication and socializing is an important way for me to balance work and life, and it also helps me expand my network and learn more about industry trends.
Then, I start analyzing various data and charts, studying market trends and price movements. This is crucial for making the right trading decisions. Sometimes, I act like a detective, carefully studying various clues and looking for potential trading opportunities. In short, it's free and easy.
After ten years of trading, six full-time, I've tamed greed and fear, turning massive losses into consistent profits. Now, I can manage my family and my account is steadily growing. Profits in trading aren't about luck, but about understanding and execution.
Understand MACD first: the "thermometer" of trend
MACD is a moving average thermometer: blue line (short term), yellow line (long term), bar line (gap), and the zero axis divides long and short (long above and short below).
- Look at the position of the golden cross and dead cross: the golden cross is strong above the zero axis, and the dead cross is strong below the zero axis;
- Divergence is an alarm: if the price reaches a new high and the indicator is falling (top divergence), you should sell; if the price reaches a new low and the indicator is rising (bottom divergence), you can buy.
Remember: it lags, so don't look for perfect buying and selling points. Use it in combination with other indicators.
11 bloody disciplines
1. If the market goes sideways, guess and give away money;
2. Hot coins should be sold within 3 days, and no lingering battles should be carried out;
3. Dare to take the strong trend and don’t be scared away by fear of heights;
4. The high position giant sun runs halfway first;
5. The 20-day moving average is a safety belt, buy online and sell offline;
6. Don’t sell if the price is not rising, don’t buy if the price is not falling, and don’t take action if the price is sideways;
7. Split positions, no more than 10% of a single currency position;
8. Look at the flow of funds for good or bad news, don’t believe the news;
9. Use three indicators: MACD, Bollinger Bands, and volume;
10. Write a plan for each trade (what to buy, position, stop loss and take profit);
11. Stop loss and take profit are the lifeline. Cut your losses if the price drops by 3%-5%, and sell half of your price if the price rises.
Trading requires discipline; only by following the rules can you survive. The market isn't short of opportunities; it's short of people who seize them. If you adhere to these rules, you too can make steady profits.
The cryptocurrency world is a battleground, but it's also a wealth-making pit! Some lose everything, while others double their profits without even realizing it. The difference lies in these 11 proven, practical techniques! Master these strategies, and you too can turn cryptocurrency trading into a guaranteed win!
1. High and low consolidation and then observe
When the market is consolidating at high or low levels, a more prudent strategy is to wait and see. Sideways trading often signals a change; after digesting the previous volatility, the market will ultimately choose a clear direction. At this point, rash action could lead to unnecessary losses. Waiting for market clarity before acting accordingly is the wisest approach. Veterans have repeatedly warned, "When the market is sideways, waiting and watching is more valuable than blindly trading."
2. Don’t be attached to hot positions; adjust your positions according to the market conditions.
In short-term trading, popular positions are often the result of speculation. Once the hype fades, funds quickly exit the market, leaving investors stranded in a passive position. Therefore, a veteran investor advises against clinging to popular positions for too long, but rather to flexibly adjust and maintain agility. As he puts it, "Short-term, popular positions come and go quickly, and a little carelessness can lead to chasing the ups and downs. Successful short-term trading is not about blindly following trends, but about maintaining a clear mindset and 'working through everything from start to finish, until nothing is left in the end.'"
3. The upward trend opens higher, and the position needs to be firm
If, during an uptrend, the K-line shows a gap-up, bullish candlestick pattern accompanied by high volume, it indicates the market has entered a phase of accelerated growth. During this period, it's important to remain calm and hold on, as this often leads to a surge. Veterans refer to this as the "growth phase," emphasizing the importance of unwavering conviction and resistance to short-term fluctuations during this phase, in order to reap substantial profits.
4. A huge bullish candlestick requires decisive exit
Whether the market is high or low, the appearance of a large bullish candlestick is a signal to exit the market. In this case, even if the price hits the daily limit, it's crucial to close the position decisively, as a large bullish candlestick is often followed by a pullback. Our predecessors taught us, "No matter how tempting the profits may be, knowing when to take advantage and closing the position decisively is the key to avoiding profit taking." The core of this strategy is knowing when to advance and when to retreat. Risk mitigation is essential in all circumstances, ensuring that profit drawdowns are controlled.
5. Buy when the moving average is above the negative line and sell when the moving average is below the positive line
Moving averages are a key reference for short-term trading. If the stock price is above a key moving average and a bearish correction occurs, it's a buy signal. Conversely, a bullish correction below a moving average may signal a lack of upward momentum, prompting a sell-off. In short-term investing, it's generally best to focus solely on the daily moving average or attack line, avoiding delays and holding positions for extended periods. A veteran investor advises, "No more than a week, sell within three days; don't miss the opportunity." Short-term trading requires speed and precision; holding for extended periods increases risk.
6. Don’t sell if the price goes up, don’t buy if the price goes down, and don’t move if the price goes sideways.
In the cryptocurrency world, where market fluctuations are frequent, this principle is considered a fundamental rule of survival. If the current price isn't significantly higher than the purchase price, don't sell rashly; conversely, if there's no significant decline, don't rush to buy. When the market is sideways, it's safer to wait and see. Veterans call this "stability first." Any rash trade will likely result in losses. Long-term profitability depends not on frequent entry and exits, but on choosing the right entry and exit points.
7. It is better to take in less than more, and do what you can.
In the cryptocurrency world, flexibility is key. Even if you're extremely confident, it's best not to invest a large amount all at once. Proper position allocation is crucial. Our predecessors remind us, "It's better to invest a little than to overinvest." Because the market can fluctuate unexpectedly at any time, diversification can reduce the risk of a single investment. For each trade, maintain a reasonable position ratio to avoid being caught off guard by unexpected market fluctuations.
8. Learn to interpret market news
In the cryptocurrency world, the influence of news cannot be underestimated. Market news often directly triggers significant price fluctuations, potentially leading to sharp increases or decreases. Therefore, investors should learn to interpret market information, especially major events and policies. Veterans advise new investors to wait and see when encountering major news, as excessive intervention can lead to unnecessary losses.
9. Master technical indicator analysis
Technical analysis plays a crucial role in the cryptocurrency world. Experts recommend that beginners systematically study technical indicators, develop a learning plan, and master analytical tools such as moving averages, KDJ (K-Drawing Difference) indicators, Bollinger Bands, candlestick patterns, volume-price relationships, and capital flows. Technical analysis requires extensive experience and is not a one-time skill. However, mastering technical analysis can help investors determine buying and selling points and mitigate unnecessary losses.
10. Develop a trading plan and avoid frequent trading
Frequent trading not only incurs high fees but also disrupts trading mentality and can lead to emotional trading. Veterans emphasize that "trading requires planning, not blind, arbitrary action." In the cryptocurrency world, frequent entry and exit often means greater uncertainty. An effective trading plan can help investors maintain rationality and clarity of thought.
11. Do a good job of risk control and set stop-loss and take-profit
Before every trade, set reasonable stop-loss and take-profit points to keep risk within acceptable limits. When these points are reached, exit the market decisively rather than greedily pursuing profits. Cryptocurrency prices fluctuate drastically, and the experience of our predecessors tells us that "reasonable stop-loss and take-profit are the key to successful trading." Even experienced investors cannot accurately predict the market, so comprehensive risk management measures are essential for every investor.
Summarize:
Cryptocurrency trading isn't a one-time success, nor does it rely solely on luck or following trends to consistently generate profits. Experience from our predecessors tells us that success lies in rationality and patience. The key is to find a method that works for you, adhere to your principles, and practice repeatedly, rather than chasing fleeting trends and quick profits. Stable profits come from a balanced mindset, risk management, and a deep understanding of the market.
To make $1 million in the cryptocurrency world, you either have to rely on a bull market and hold on, or you have to bet on a lucky coin, or you have to use high leverage to bet on the right direction. But most people lose money, so don’t just rely on the get-rich-quick stories; first determine how much risk you can tolerate.
If you are also a fan of cryptocurrency technology, click on the coin homepage.
Click on the avatar to follow me and get first-hand information and in-depth analysis!

The Ultimate Guide to the 200-Day Moving Average: Professional Traders Show You How to Avoid Being Washed Out and Capitalize on the Whole Trend!
A common mistake traders make is to constantly hope for a "holy grail" in trading, neglecting the learning and experience gained through actual trading. New traders are advised to develop a detailed trading plan. This plan should set parameters for each trade, such as which market conditions are suitable, how to enter and exit a market, and how to manage trades. If you consistently experience losses, it's crucial to reflect on your trading plan and continuously improve it. The 200-day moving average is one of the most closely watched indicators.
Turn on the financial news and you'll often hear arguments like this:
"The S&P 500 fell below its 200-day moving average – a bear market is coming!"
"You should buy when the price breaks through the 200-day moving average."
"Apple shares closed below their 200-day moving average — time to sell."
But the question is: how does this actually help traders?
No help at all.
Instead, it will only play with your emotions and trick you into buying or selling at the wrong times.
But don't worry, we're about to change that.
What is the 200-day moving average and how does it work?
A moving average (MA) is a trading indicator formed by averaging price data and displayed as a curved line on a chart.
Here's how it works...
Assume that the closing prices of Apple stock in the last five trading days were $100, $90, $95, $105 and $100 respectively.
The 5-period moving average is calculated as: [100 + 90 + 95 + 105 + 100] / 5 = 98
When you plot these 5-period moving averages continuously on a chart, they form a smooth curve.
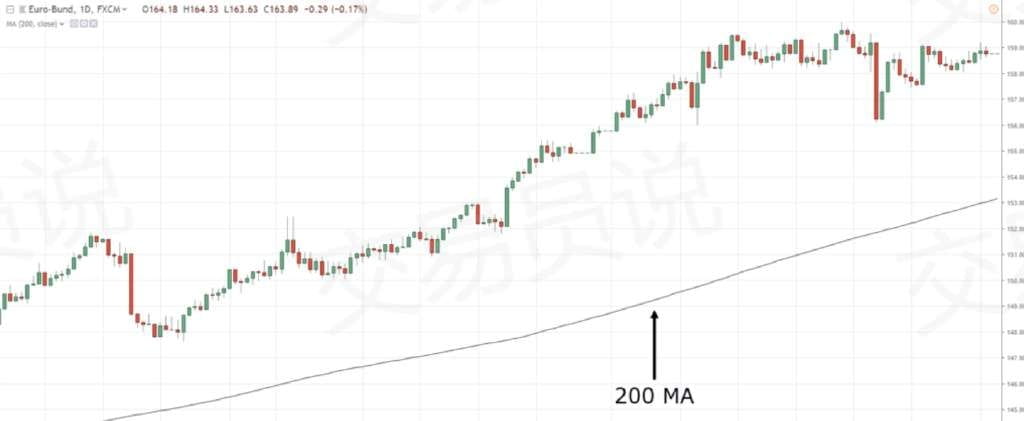
The principle of the 200-day moving average is exactly the same. The only difference is that it counts the price data of the last 200 trading days, thus forming a longer-term moving average.
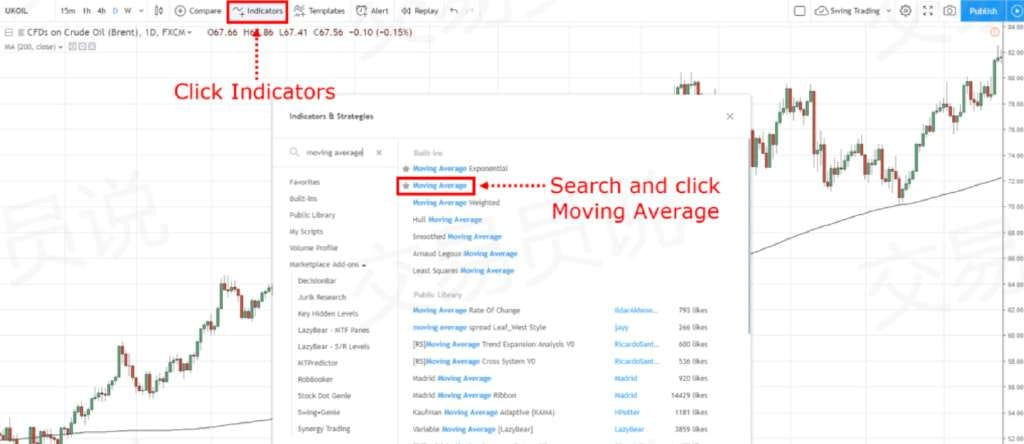
(Using TradingView as an example) the method to set the 200-day moving average is as follows:
Here’s an example of a chart with the 200-day moving average:
It should be noted that there are many types of moving averages, such as the exponential moving average (EMA), simple moving average (SMA), weighted moving average (WMA), etc.
But you don't need to worry about these types, as the core principles are the same (only the calculation method is slightly different).
Now let’s get to the point…
How to use the 200-day moving average to improve trading success rate?
The key is:
The 200-day moving average is a long-term trend indicator.
This means that it allows you to identify and trade with long-term trends.
The specific method is as follows:
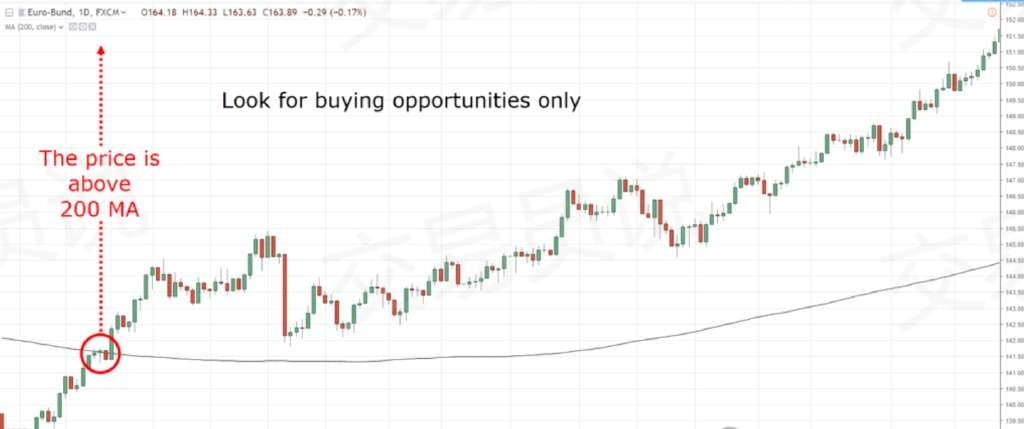
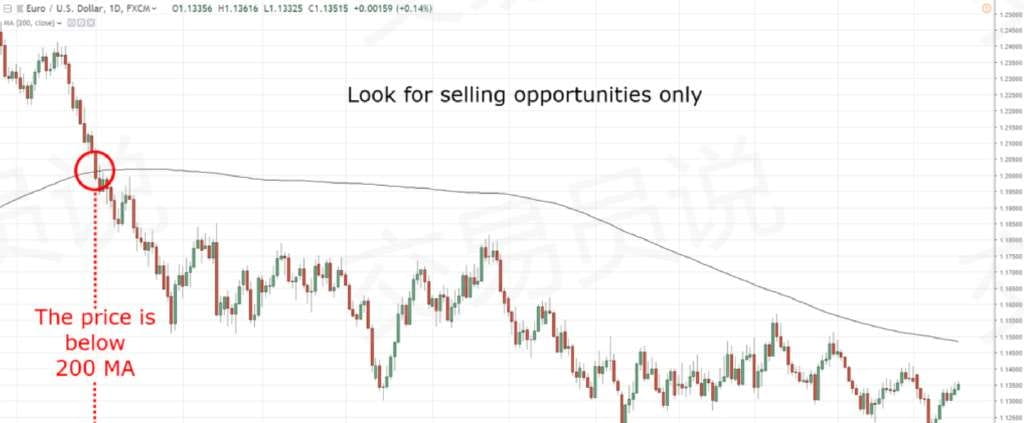
When the price is above the 200-day moving average, look for buying opportunities first.
◎ When the price is below the 200-day moving average, consider selling opportunities.
The example is shown in the figure below:
Professional advice: If you are trading stocks or spot cryptocurrencies, you can refer to the market index or BTC to determine the trend direction.
For example: When the S&P 500 index is above its 200-day moving average, prioritize looking for buying opportunities in U.S. stocks.
This simple 200-day moving average trading strategy can both increase your win rate and reduce drawdowns.
How to accurately grasp the buying and selling opportunities by combining the 200-day moving average?
You might ask:
"It's not difficult to use the 200-day moving average to determine the trend, but when is the best time to enter the market?"
Here are a few practical tips:
◎ Support and resistance levels
◎ 200-day moving average rebound
Ascending triangle
Bull Flag
The detailed analysis is as follows...
1. Support and resistance levels
Support level: A key area on a chart that may trigger buying.
Resistance: A key area on a chart that could trigger selling pressure.
Operation logic:
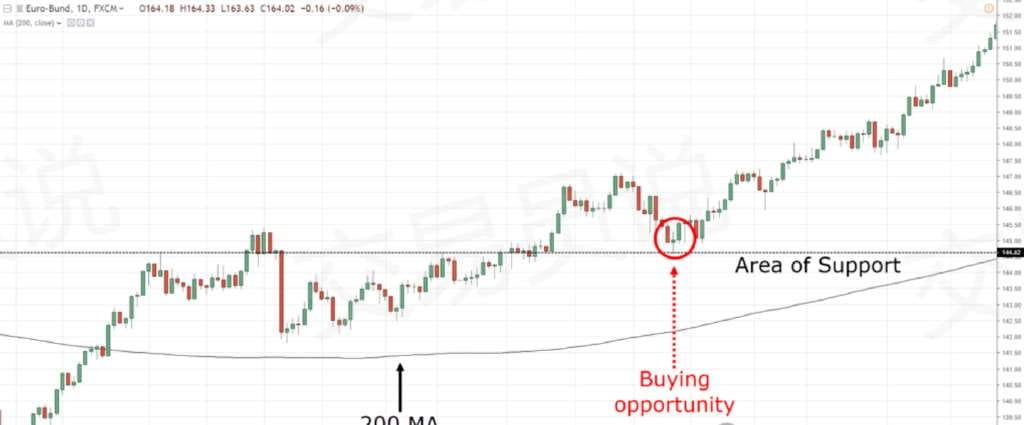
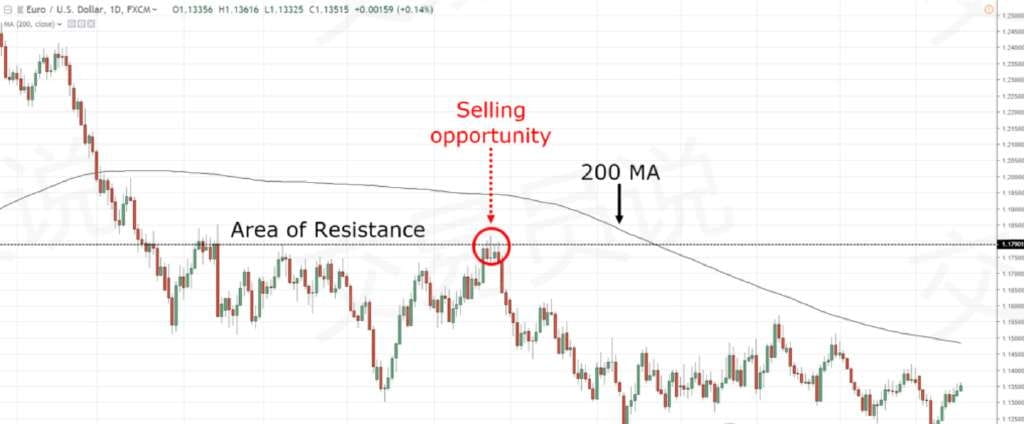
When the price is above the 200-day moving average, look for buying opportunities at support levels.
When the price is below the 200-day moving average, look for selling opportunities at resistance levels.
As shown in the figure below:
2. 200-day moving average rebound strategy
When the trend is weak, the 200-day moving average often forms a value area.
When the price rebounds after approaching the 200-day moving average, it often indicates an excellent entry opportunity. As shown in the figure below:
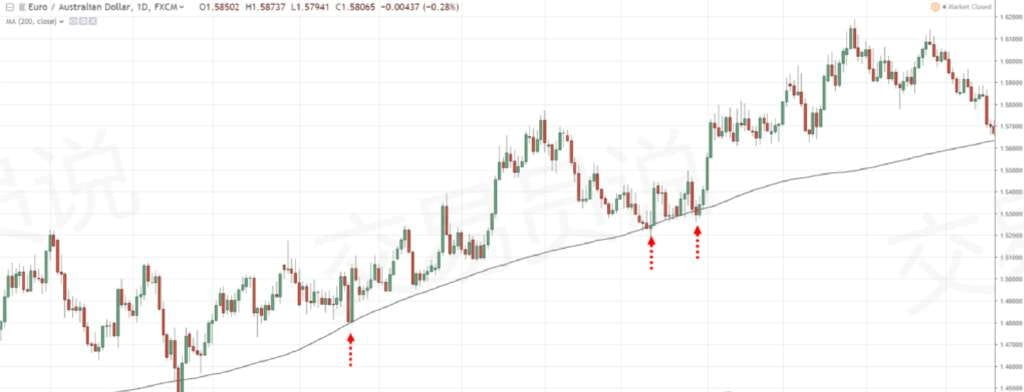
Pro Tip: When the 200-day moving average coincides with a nearby support/resistance level, your trading success rate will significantly increase.
3. Ascending and descending triangles
An ascending triangle is a bullish pattern characterized by buyers willing to take orders at higher prices despite resistance, indicating market strength.
Instructions:
When the price is above the 200-day moving average (uptrend), look for a breakout of the ascending triangle to go long;
When the price is below the 200-day moving average (downtrend), watch for a breakout of the descending triangle to go short.
The example is shown in the figure below:
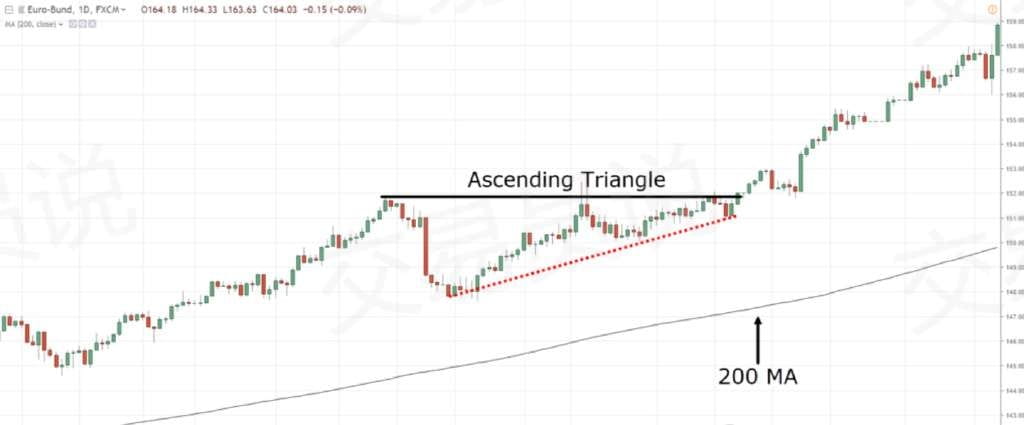
Pro Tip: The longer an ascending triangle forms above its 200-day moving average, the stronger the subsequent breakout tends to be.
4. Bullish Flag
The bullish flag is another bullish chart pattern.
This is a sign of price strength because the bulls are in control and the bears are having a hard time pushing the price lower (which is why you have small candlesticks on pullbacks).
So, in an uptrend, you can look for bullish flag patterns and buy on a breakout of higher highs.
In a downtrend, look for a bearish flag pattern and short on a breakout below the low.
As shown below:
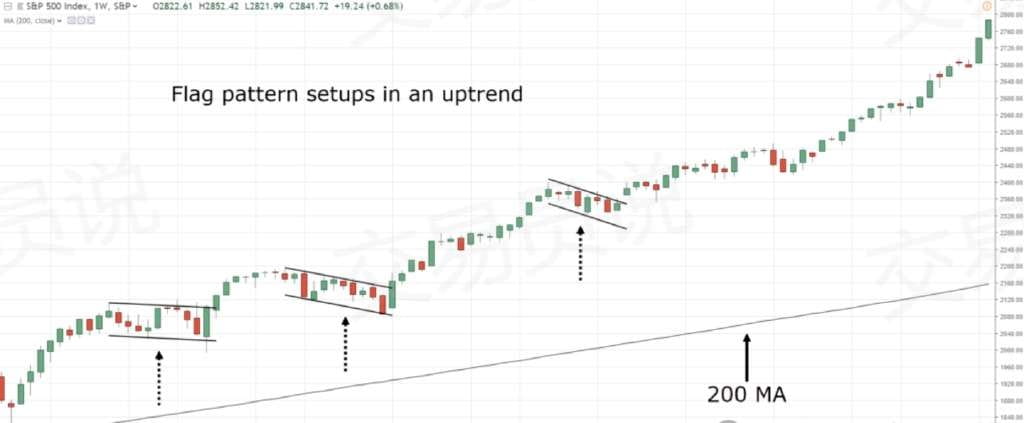
Pro Tip: The best flag trading opportunities usually occur on the first pullback after the price first breaks out of a consolidation range.
How to use the 200-day moving average to capture the big trend and avoid being shaken out during a pullback?
If you want to ride the big trends in the market (the ones that make other traders salivate), then you have to give your trading space a chance to breathe.
We should not cancel the tight trailing stop. Instead, you have to give it a buffer zone.
One way to do this is to trail your stop loss with the 200-day moving average. This means that if you are long, you will only exit the trade if the price closes below the 200-day moving average.
Alternatively, if you are short, exit the trade only if the price closes above the 200-day SMA.
As shown below:
Pro Tip: If you want to ride the short-term trend, you can follow the 20-day moving average; if you want to ride the medium-term trend, you can follow the 50-day moving average.
How to accurately identify market cycles and avoid counter-trend operations?
The market is always in dynamic change, cyclically switching between consolidation → trend → consolidation.
You can break the market down into 4 phases:
1. Accumulation
2. Advancing
3. Distribution
4. Declining
(This is important, so please learn it)
1. Accumulation phase
The accumulation phase usually occurs after a downtrend.
At this time, the market is in a range-bound pattern with obvious support and resistance levels.
You will observe that the 200-day moving average gradually flattens out and the price fluctuates repeatedly around it (commonly known as the "whip-sweep" phenomenon).
This shows that the power of buyers and sellers has reached a balance and the market is in a period of direction selection.
As shown in the figure below:
This means...
At this stage, the 200-day moving average strategy may be ineffective. The market may break out either upward or downward: a downward breakout would indicate a continuation of the downtrend (a good opportunity to short), while an upward breakout would signal the beginning of an upward trend and the next phase...
2. Rising stage
When the price breaks through the upper edge of the accumulation range, the market enters an uptrend, characterized by rising highs and lower lows, and the price stabilizes above the 200-day moving average, which begins to turn upward.
Consider the following example:
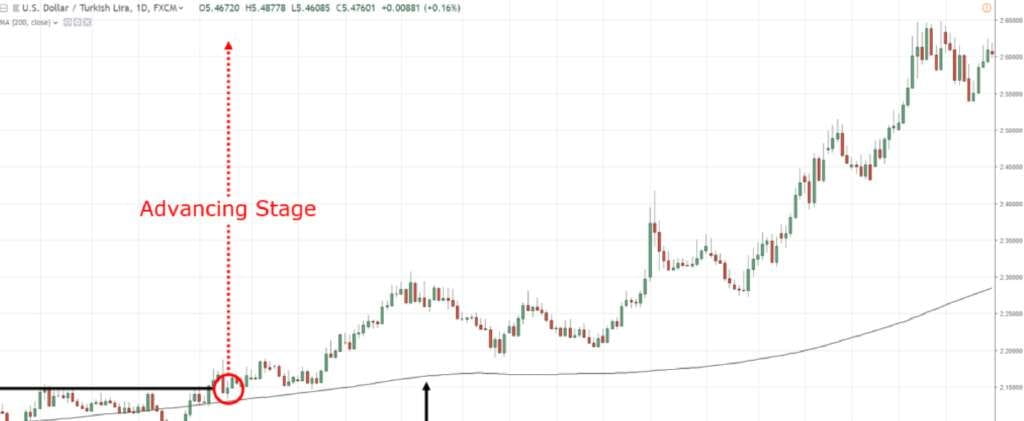
During an uptrend, the path of least resistance is up, so you want to be a buyer (not a seller).
There are several ways to trade the upside:
◎ Seize the first pullback buying opportunity after the accumulation phase breakthrough
◎ Wait for the price to retrace to the support level that was converted from a resistance level
◎ Pay attention to the buying point when the price pulls back to the moving average
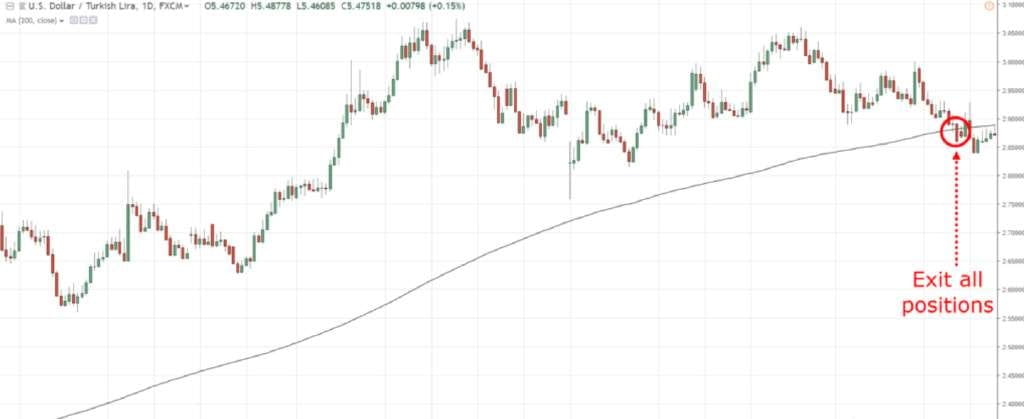
3. Distribution Phase
The market won't rise forever. When selling pressure begins to suppress prices, it will first enter a distribution phase. This phase manifests as range-bound fluctuations within an uptrend. The 200-day moving average flattens again, and prices fluctuate around it, indicating that the market has once again entered a state of equilibrium between bulls and bears.
Here’s an example:
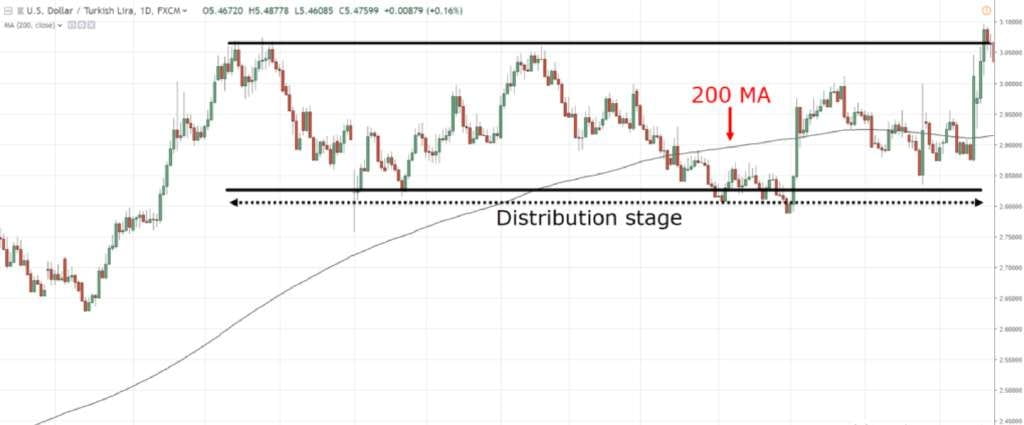
At this point, the market may break out upwards or downwards: if it breaks out upwards, the trend will continue; if it breaks out downwards, it means the beginning of a downtrend...
4. Decline phase
This is the final phase of the market cycle. When the price breaks below the lower edge of the distribution range, it enters a downtrend, with lower lows and lower highs. At this point, the price is trading below the 200-day moving average, which begins to slope down.
Consider the following example:
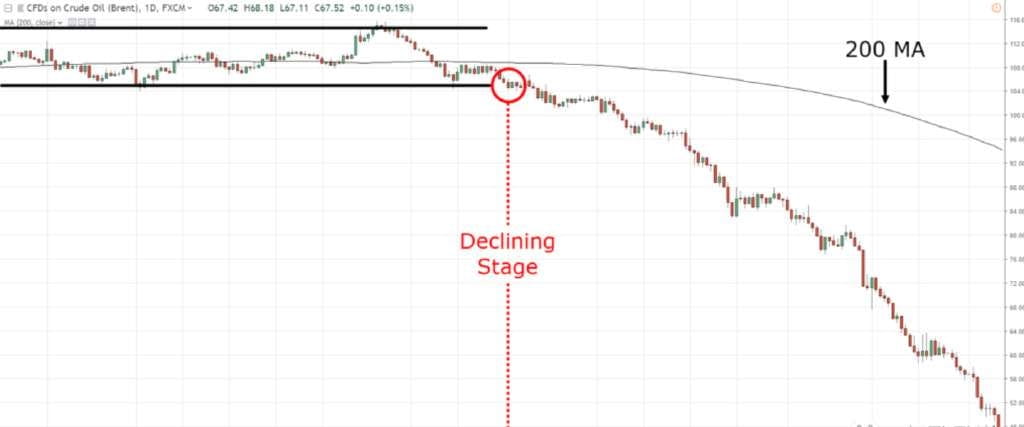
During a downtrend, the path of least resistance is to the downside, so you become a seller (not a buyer).
Likewise:
The downward trend will not last forever. When the price is low enough, it will attract buying and the market will return to the first stage - the accumulation stage, completing the cycle.
The four stages of the market are more art than science.
Sometimes it is unclear which stage the market is in.
When this happens, your best option is to move to another market where it makes more sense.
Want to survive long and earn steady profits in the cryptocurrency world? Here are 10 top-notch insights I've learned through hard work. Crypto traders, remember them:
1. The level of an expert is determined by the length of time they hold a short position.
The real strength lies not in making a lot of money when the market is rising, but in having the courage to go short when the market is unclear. Patiently waiting for opportunities is 10 times more reliable than trading every day.
2. In a bear market, buying is risky
When the market is trending downward, even the cheapest stocks are likely to fall even further. It's better to wait for signs of stabilization than to blindly buy at the bottom.
3. In a bull market, selling is often a regret
When the upward trend continues, don't get out because of small fluctuations. Hold on as long as the trend remains unchanged, and wait for a clear turn before exiting to fully capitalize on the main upward trend.
4. Buy low, sell high – easier said than done
The key isn't "getting it right," but being able to wait. Be patient and wait for buying opportunities, withstand market fluctuations and wait for selling opportunities, and don't be misled by short-term fluctuations.
5. Follow the main capital, not the market sentiment
The market is driven by big money. Understanding where that money is flowing is key to keeping pace. Don't listen to retail investors' calls for more or less; focus on where the real money is flowing.
6. Technical and fundamental factors are no match for momentum
No matter how good the indicators or how great the news, they can’t go against the general trend. Those who follow the trend make a lot of money, while those who go against the trend get harvested.
7. When bad news comes out at the top, run away
When bad news suddenly breaks out at a high level, it is often the main force that is selling. Don't take chances, exit the market first to protect your profits.
8. Buy boldly when bad news comes out at the bottom
If bad news continues to spread even after the stock has fallen to the bottom, it is likely that investors are panic-selling. If you dare to enter the market at this time, you can often buy at the bottom.
9. It’s enough to be rich once in a lifetime. Keeping profits is better than anything else.
Don't be greedy for "doubling your money again" and pocket your profits promptly. Only by protecting your principal and profits can you become a long-term investor in the market.
10. Bitcoin is a must to avoid missing out on the bull market
As the anchor of the cryptocurrency world, Bitcoin often leads the way in bull markets. Only by properly allocating your holdings can you keep up with the market.
These aren't theories; they're lessons learned through hard work. Understanding them can save you years of missteps; and applying them effectively can help you profit reliably, whether in bull or bear markets.
To make $1 million in the cryptocurrency world, you either have to rely on a bull market and hold on, or you have to bet on a lucky coin, or you have to use high leverage to bet on the right direction. But most people lose money, so don’t just rely on the get-rich-quick stories; first determine how much risk you can tolerate.
If you are also a fan of cryptocurrency technology, click on the coin homepage.
Click on the avatar to follow me and get first-hand information and in-depth analysis!