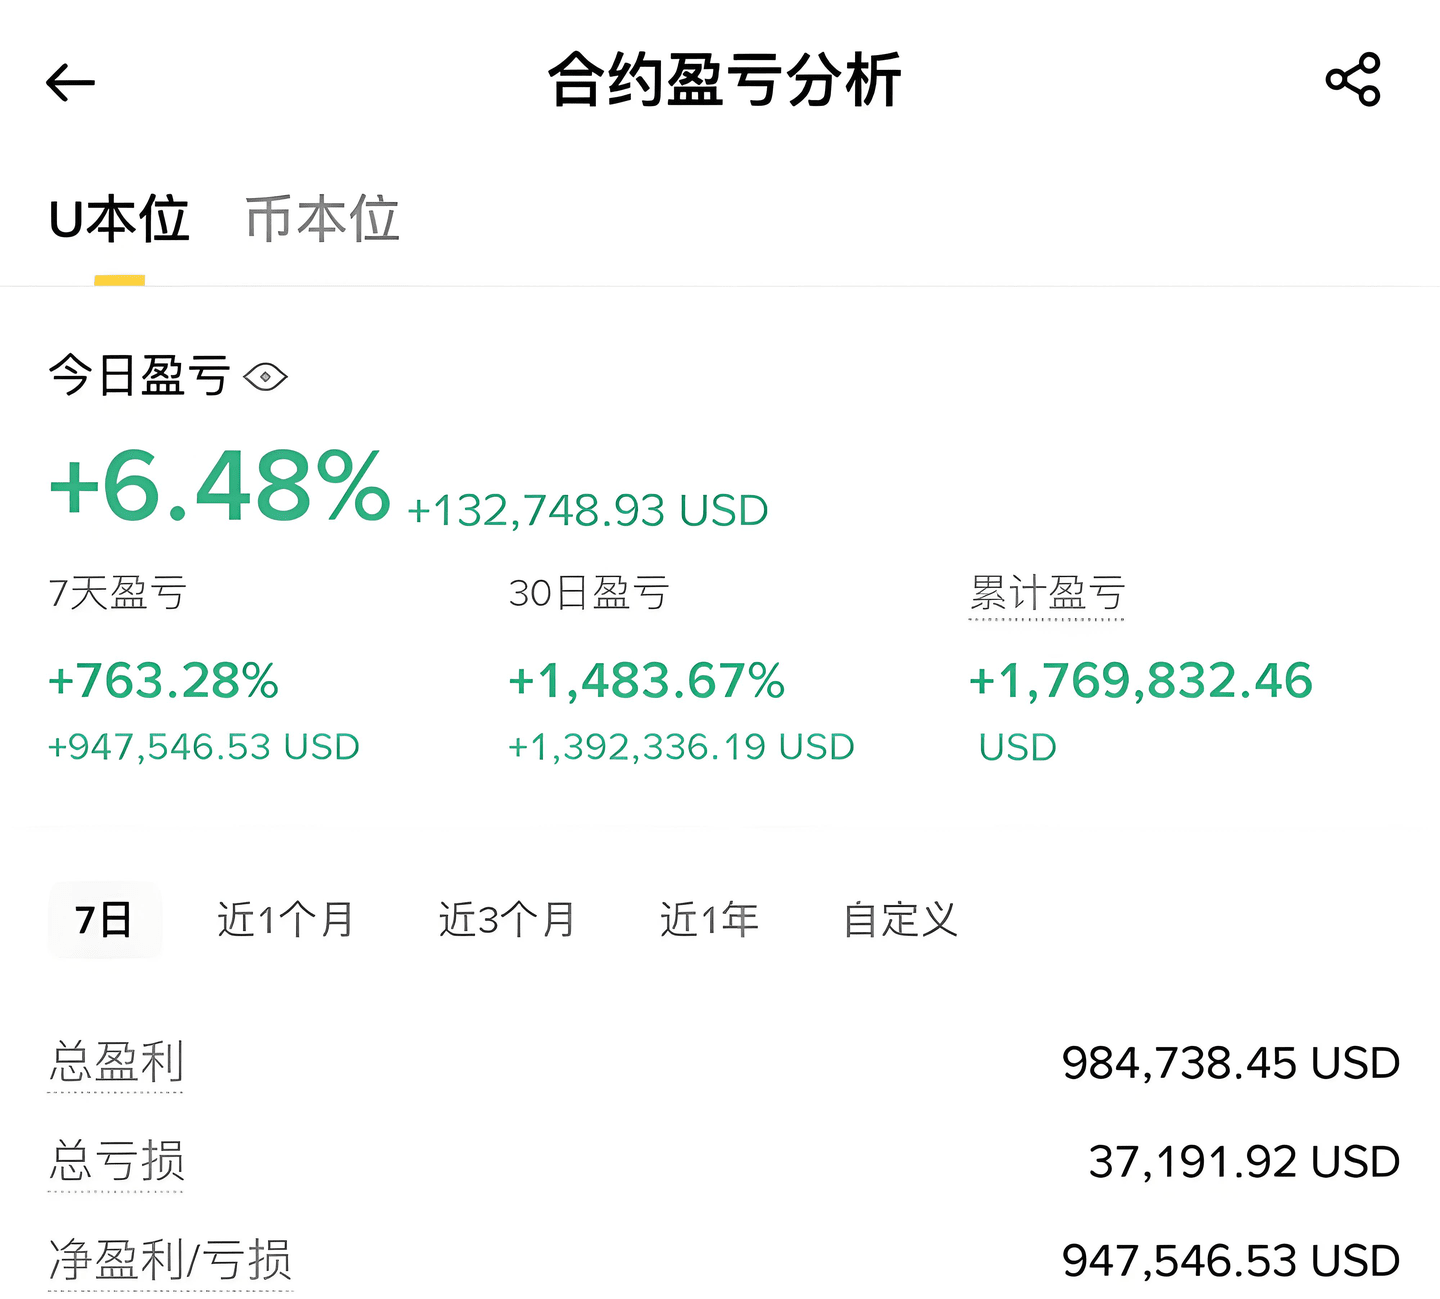
This is a method I tested this year 2025: in one month, the yield reached 1483.67%, making a profit of 100,000U!
In the first stage, a unit of operation is set at 100U per trade, focusing on the hot currency contract games, strictly setting a stop loss of 3%-5% and a take profit of 8%-15%.
Using the classic three-stage model: 100U → 200U → 400U → 800U (fully reinvest profits each time).
Please note: The limit for clearing levels is set to 3 attempts; even if the first 9 are successful, one liquidation may consume all profits.
After successfully clearing three levels, capital will accumulate to 1000U + 200U as spare funds. In this stage, a compounding strategy system will be activated:
[Lightning War +] Ultra-short cycle games
Allocation ratio: 15%-20% position (150-200U)
Focus on assets: mainstream coins like BTC/ETH
Time frame: 15-minute level fluctuations
Profit and loss characteristics: high volatility (daily returns can reach 20%+, with equivalent drawdown risk)
[Trench Warfare +] Strategic layout
Allocation ratio: 5%-10% position (50-100U)
Operational mode: 10x leverage layout on the 4-hour level market
Profit management: withdraw 50% of profits weekly to invest in BTC
Core advantage: Balancing short-term volatility with long-term value accumulation
[Annihilation +] Trend Catching
Allocation ratio: 20%-30% flexible position
Operational requirements: must meet ① clear trend line breakout ② RSI <30/70 oversold buy area ③ 3-day volume anomaly
Holding period: medium-term holding of 3-15 days
Risk control key points: set a risk-to-reward ratio of over 1:3, using a trailing stop-loss strategy.
To make big money in the crypto world, you really don’t need to stubbornly stick to those flashy technical indicators.
Four years ago, an old fan stayed up late every day staring at K-lines, calculating RSI, and drawing MACD, but ended up making his account messier, and after two liquidations, he was completely defeated.
I only said one thing to him: 'In the crypto world, those who are too smart are more likely to stumble; those who can make money are often the ones who are willing to use simple methods.'
He tried my '343 gradual position building method' with half belief— the name is simple, but the logic is easy enough for a primary school student to understand. The result? In two years, he turned 200,000 into over 70 million.
This method has three steps, remember:
Step 1: 30% exploratory position building
Start with 30% of total funds, only choose mainstream coins like BTC, ETH, SOL, and don’t touch air coins. Don't try to catch bottoms or guess rises and falls; just aim to stand firm—keeping an eye on market fluctuations while holding real positions keeps you calm.
Step 2: 40% gradual position building
The market has dropped? Don't panic, buy in batches. Add a little every time it drops about 10%, up to a maximum of 40%. While others are panic selling, you quietly lower your cost, and when the rebound comes, profits will soar. If it rises? Don't chase it, wait for a pullback, no need to rush.
Step 3: 30% add to positions with the trend
Wait for the trend to stabilize—such as regaining the 7-day line or firmly stepping on important support levels—then put the remaining 30% in to catch the main uptrend. But remember, the take-profit line should be drawn in advance; when the market hits it, close the position to secure the profit.
Does this sound like it lacks technical content? Yes, the key is never in the technology but in execution: can you follow the rhythm, not go all in, not panic, not chase after rises, and not be led by emotions.
Now he trades completely differently: if it rises, he adds at key points; if it falls, he buys gradually; if it rebounds, he goes with the trend, steady like a mountain.
Ultimately, the ones who can truly turn around in the crypto world are not the 'smart people' with extraordinary talent, but those who are willing to stubbornly stick to simple methods.
If you are still chasing highs and cutting losses, changing strategies every few days, you might as well stop and try this old method. No flashy skills, no gambling on luck, just rely on rhythm, patience, and execution—do simple things thoroughly, and the money will naturally come.
In the crypto world, making 1 million requires either relying on a bull market and holding on, or betting on a wealthy coin, or betting the right direction with high leverage. But most people lose money, so don't just look at the stories of sudden wealth; first, think clearly about the risks you can bear.
If you are also a tech enthusiast in the crypto space, click on the coin homepage.
Click on my avatar to follow me for the latest information and in-depth analysis!

After over 10 years of trading cryptocurrencies, one of my winning strategies is: using K-lines + structure to predict the next price direction. This method is applicable whether you are a novice or an expert; even with bare charts, you can catch the rises and falls!
Are you tired of being overwhelmed by 'suffocating anxiety' every time you look for trading opportunities on the chart?
Do you desire to read price charts as smoothly as reading a book, easily identifying trading opportunities based on price action, without being tortured by 'analysis paralysis'?
This is precisely the essence of a price action trading strategy—making everything logical, clear, and extremely simplified.
This tutorial will teach you how to 'extract' trading opportunities based on price action from a 'bare chart', completely avoiding dazzling distractions that can cloud your vision.
Next, we will delve into several articles to explain (Price Action Chart Guide) in depth. In this series of content, you will systematically learn and master the core knowledge and practical skills of price action trading, gradually building a clear and logical chart analysis mindset.
The upcoming content includes:
◎ What constitutes price action analysis? Your journey to profitability starts here
◎ Must-master candlestick patterns
◎ Super simple identification method for sideways fluctuating market conditions
◎ How to identify trends and trade trends? The secrets of price action
◎ Advanced price action patterns, suitable for diligent traders
◎ Detailed explanation of price action trading entry settings
◎ The overlooked 'obscure chart types'
◎ Recommended tools for price action traders
◎ Price action trading course
What is price action? The true starting point of your profitable journey
Price Action is one of the trading methods most favored by retail traders and is also a widely used style among many institutional traders—but what exactly is it?
Is it really that simple to 'trade candlestick patterns at support/resistance levels'?
Many people's understanding of price action is like this:
'Learning price action trading means waiting for your favorite K-line pattern to appear on the chart, then quickly hitting the buy or sell button before the opportunity disappears!'
The internet is filled with too much misleading information, which has led many to develop incorrect and fatal concepts.
The purpose of this guide is to fill these knowledge gaps and help you establish the correct trading mindset!
If someone asks me, 'What exactly is price action trading, and how do I do it?', I would break it down into the following four core steps:
1. Chart analysis—combining market structure with other technical elements (including top-down analysis)
2. Trading signal identification—including various candlestick patterns and breakout behaviors (some specific patterns are more effective)
3. 'Position Assessment'—also known as 'Context Confirmation'. Are we currently in a technically valid area, or in a market invalid area?
4. Predictive ability—based on current chart information, can you make reasonable predictions?
These four steps are the foundation of my trading decisions.
Before considering any trading actions, you must first conduct chart analysis! Don't do anything before you understand the chart!
The essence of price action is to extract information from a 'bare chart' to predict future price movements, without loading a bunch of unnecessary technical indicators. Before delving deeper, let's first talk about the chart itself.
Compare: a polluted chart vs. a clean bare chart. This is an example I found from a forum:
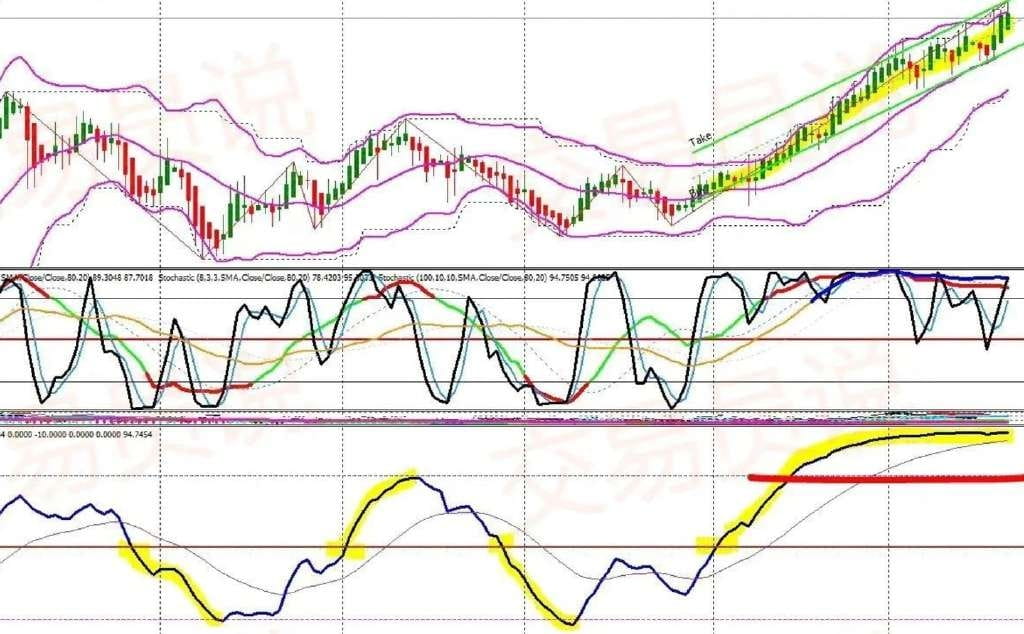
At first glance, this chart seems 'very professional' and might be somewhat interesting to play with in the short term. But in the long term, it's too complex and cluttered— as a trading workspace, it places too heavy a data processing burden on the brain, quickly leading to exhaustion.
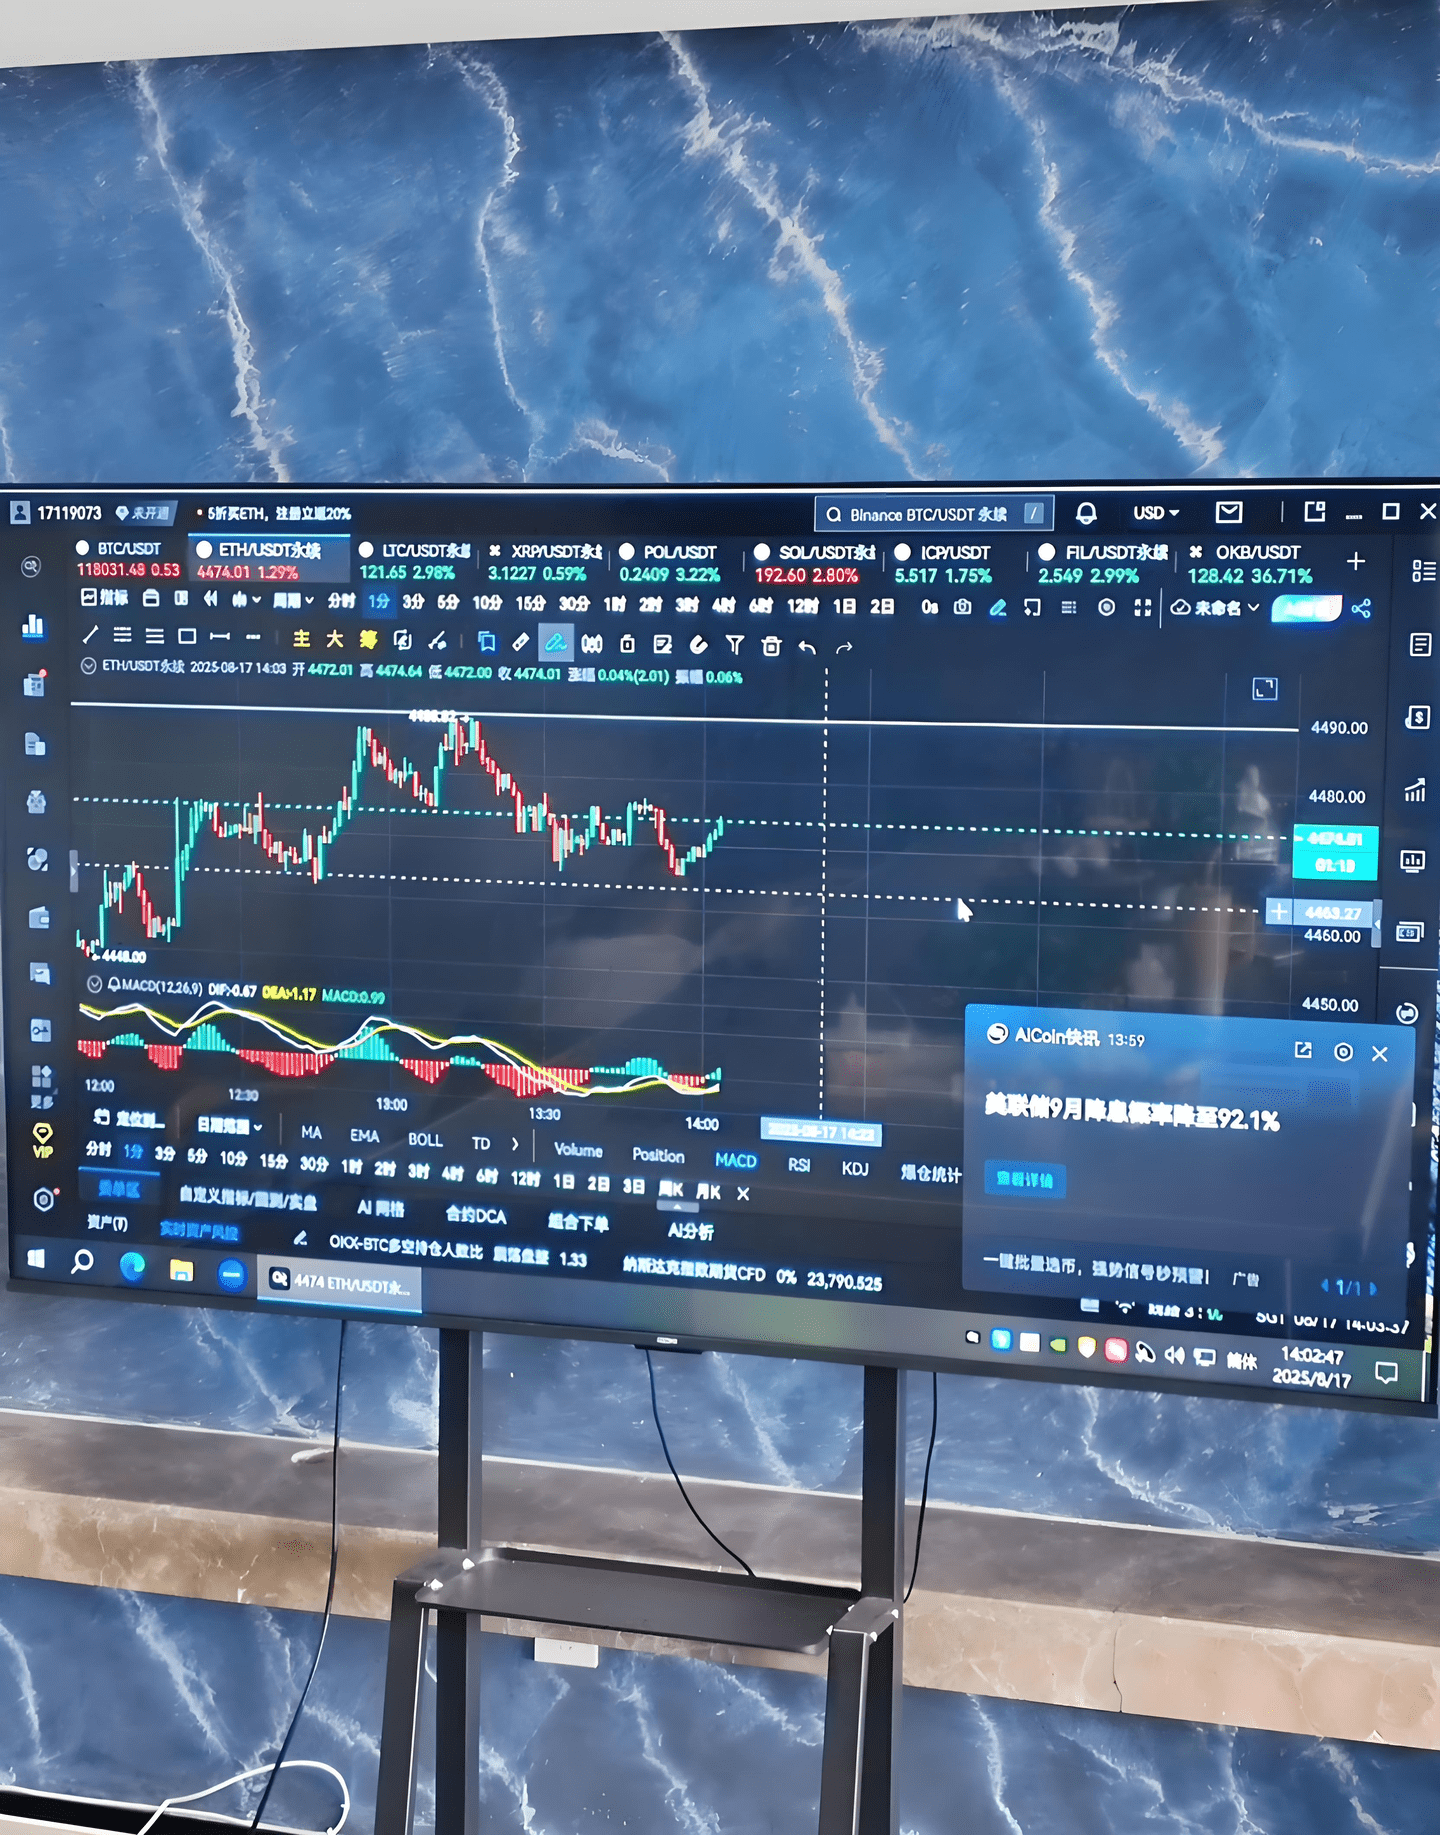
I personally prefer the style of the environment shown in the image below:
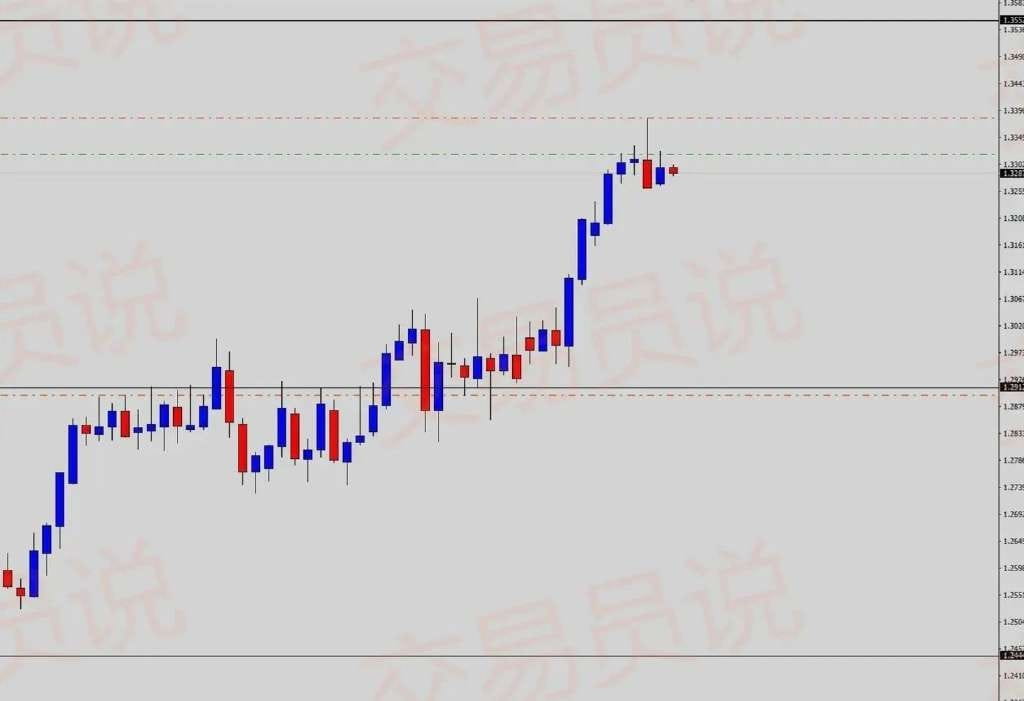
As you can see, this chart is my trading chart, very clean and minimalist, entirely focused on price. What I am doing here is a USDCAD bearish rejection signal trade, aiming to capture a mean reversion.
Why am I so fond of price action-based trading systems in the crypto world?
◎ No need for flashy tools, make decisions directly from charts
◎ 'Trade what you see, not what you imagine'
◎ Easy to form logically clear trading ideas
◎ You can make decisions without massive data support
◎ Keep strategies simple, logical, and easy to implement
Every time your eyes land on the chart, the first thing is to assess the current market state—is this a 'tradable environment'? If you can’t even read the chart, don’t place bets casually!
Remember to apply your most basic technical analysis skills—many beginners fail because they skip this step!
Stick with this tutorial, and we will deeply dissect all aspects of my trading strategy, allowing you to immediately apply them to your own charts for practical trading...
Checkpoint: A price action trading strategy is not just about jumping in rashly upon seeing a certain candlestick pattern or relying on an isolated technical signal. Before making a clear, confident trading decision that won’t keep you up at night, you first need a clean chart environment and solid technical analysis skills.
The candlestick patterns you must master before predicting price trends
Candlestick patterns are the most widely known part of price action trading.
Candlestick charts were first introduced to the Western world by Steve Nison through his classic work (Japanese Candlestick Charting Techniques).
Another pioneer of technical analysis, Martin Pring, introduced the 'Pin Bar' in his classic work (Technical Analysis Explained), which remains a hot topic among price action traders.
Next, I will demonstrate some key candlestick patterns and the concepts behind them, helping you quickly get started with the price action trading system.
Long shadow candlesticks: a powerful tool for predicting future trends
When one end of a candlestick (K-line) has a long upper and lower shadow, it indicates that the market has made a 'rejection response' at that price level.
This 'rejection' can serve as an early warning signal for an imminent reversal.
These long shadow candlesticks often serve as templates for the following patterns:
Pin Bar, Hammer, Shooting Star, and my favorite 'Rejection Candle', most of my trades are based on this type.
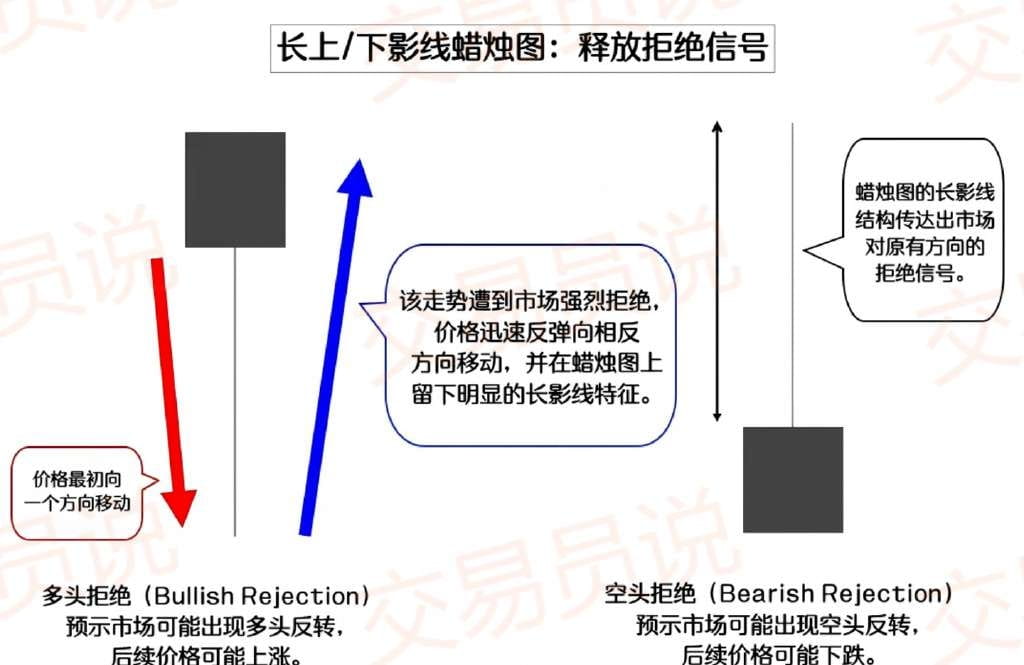
A long shadow on a candlestick means the market could reverse from the current direction, whether upward or downward, depending on where the 'rejection' comes from.
In short, this is a price action reversal signal, allowing traders to predict future price trends.
This is also why 'reversal/rejection signals' are so popular among traders—when they find these long shadow candlesticks appearing in key areas of technical analysis, they decisively buy or sell.
Let's look at some cases:
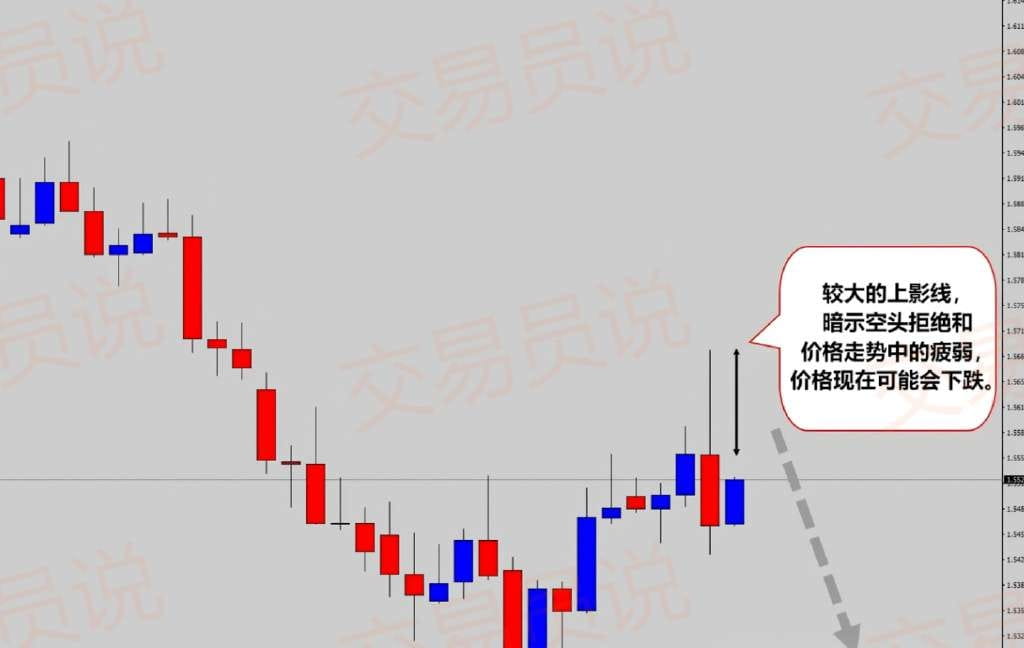
Case 1: Long tail bearish rejection signal
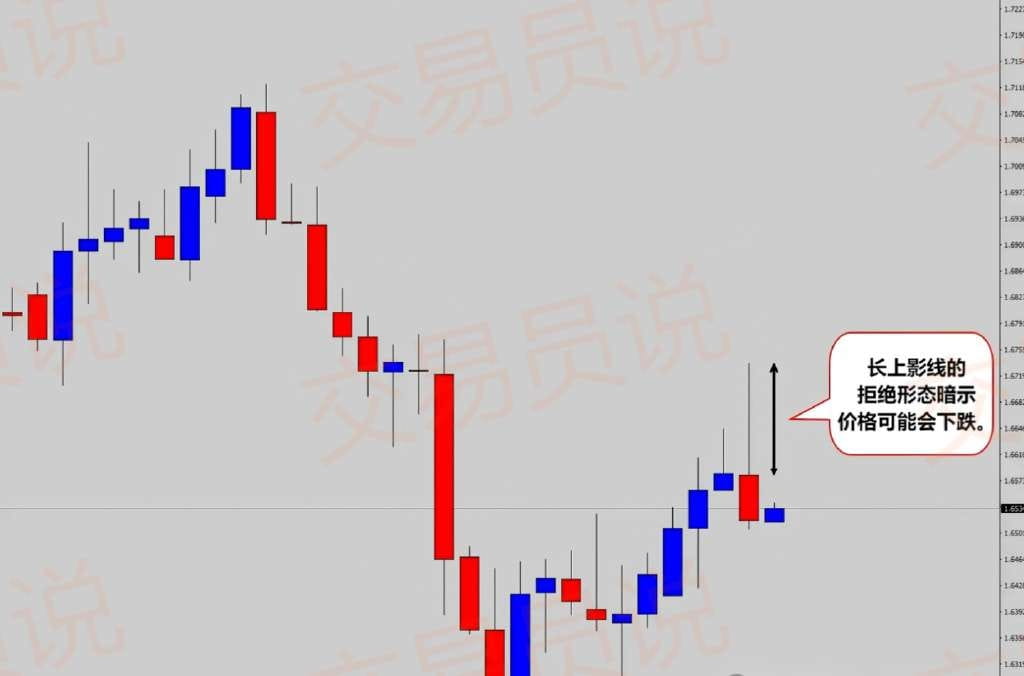
The above chart shows a candlestick with a long upper shadow, indicating that the market may continue to decline along with this bearish rejection signal.
We can see that the market indeed continued to decline, forming a profitable trade.
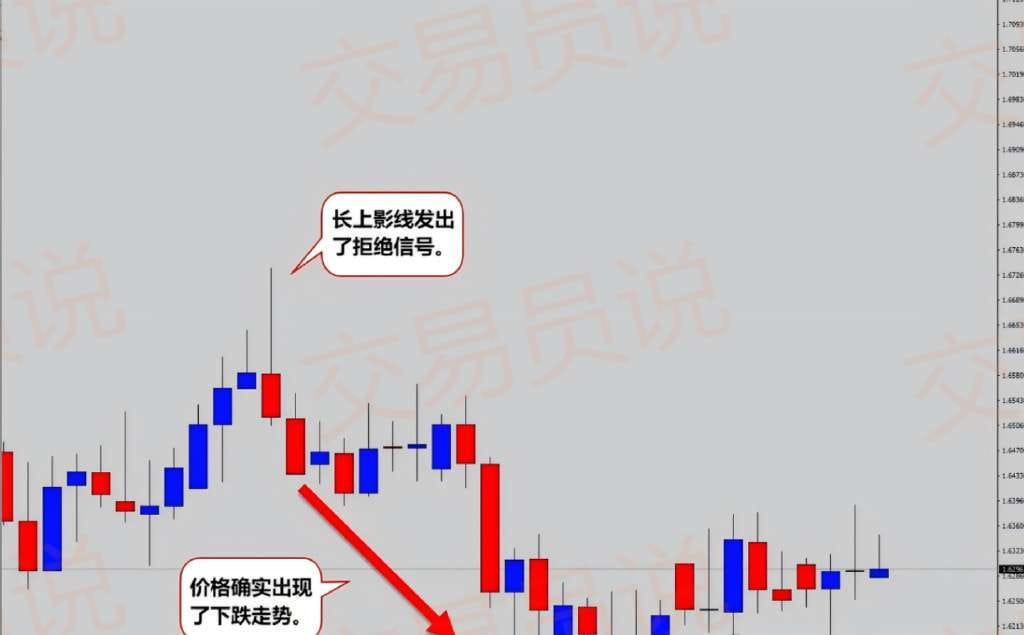
Case 2: Continuous lower shadow bullish rejection signal
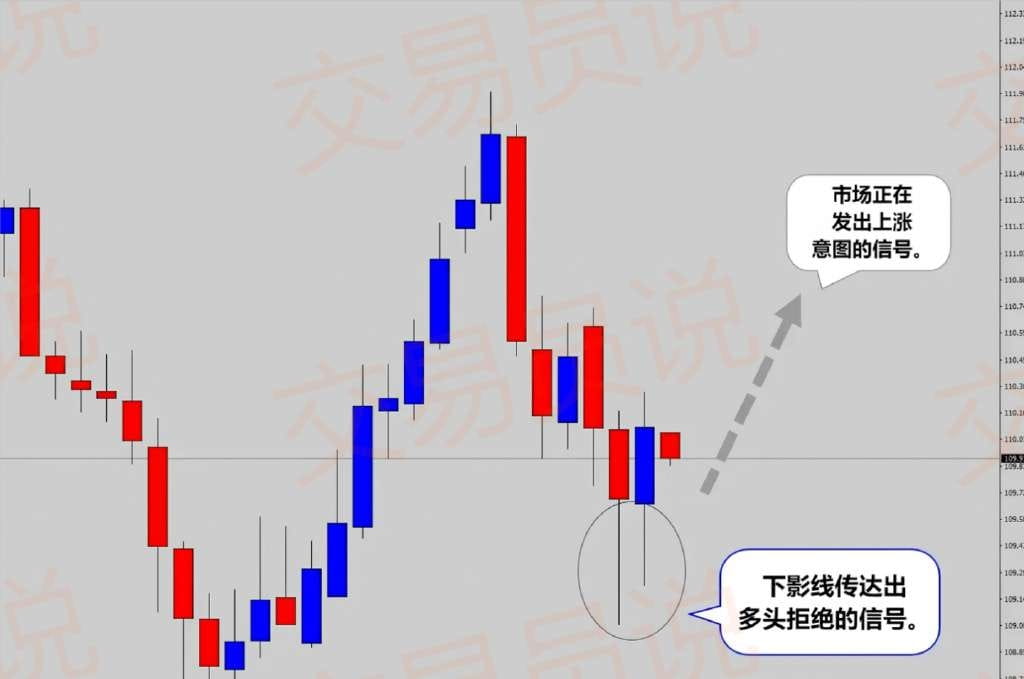
After two consecutive candlesticks with long lower shadows, how do you think the market will move next?
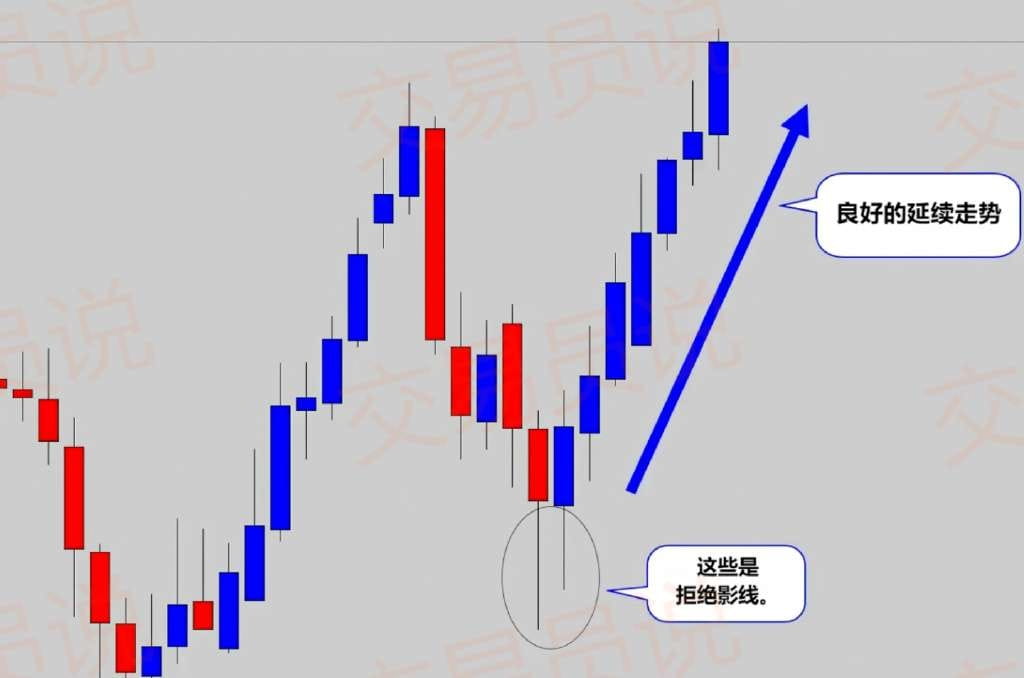
Indeed, the market did embark on a beautiful upward trend, perfectly echoing the rejection signal of the lower shadow.
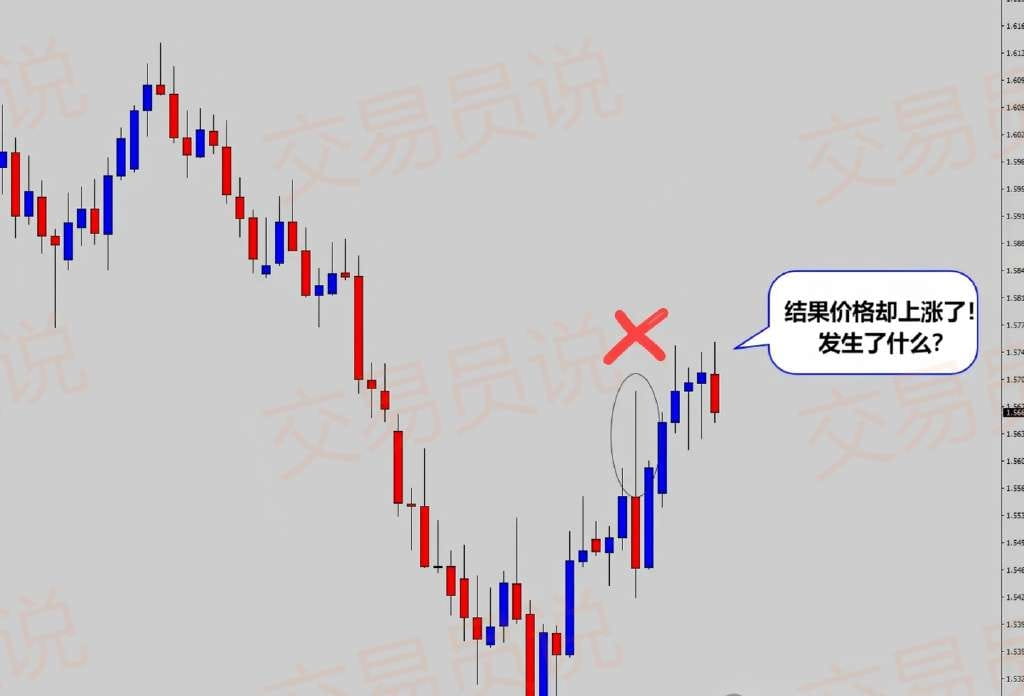
However, can we mindlessly enter on every 'long shadow' signal? Please look at the obvious example below...
Thus, based on what we currently see, this long wicked candlestick clearly outlines the direction of price.
With such an upper shadow, will the market drop, right?
The above chart shows an extremely large upper shadow candlestick, suggesting the market should decline, right?
But what’s the reality? The market completely went off-script!
What happened? This is the crypto market; nothing is guaranteed. This is precisely why 'risk management' holds a significant place in your trading education. When things don't develop as we expect, good risk control can prevent your account from suffering huge losses.
I deliberately included a 'failure case' here to prevent you from thinking that price action trading is all a 'dream world', reminding you that actual trading has uncontrollable factors.
Summary
Long shadow candlesticks are a very easily recognizable price action signal, usually indicating that the market is about to reverse. But remember, it cannot be the sole basis for your trading decisions!
Combine these long shadow signals with other high-value technical points on the chart (e.g., support and resistance, trend structure) to integrate this information and build a logical and valuable trading idea.
This is the true power of price action trading.
Share a few practical position management suggestions to help you trade more steadily:
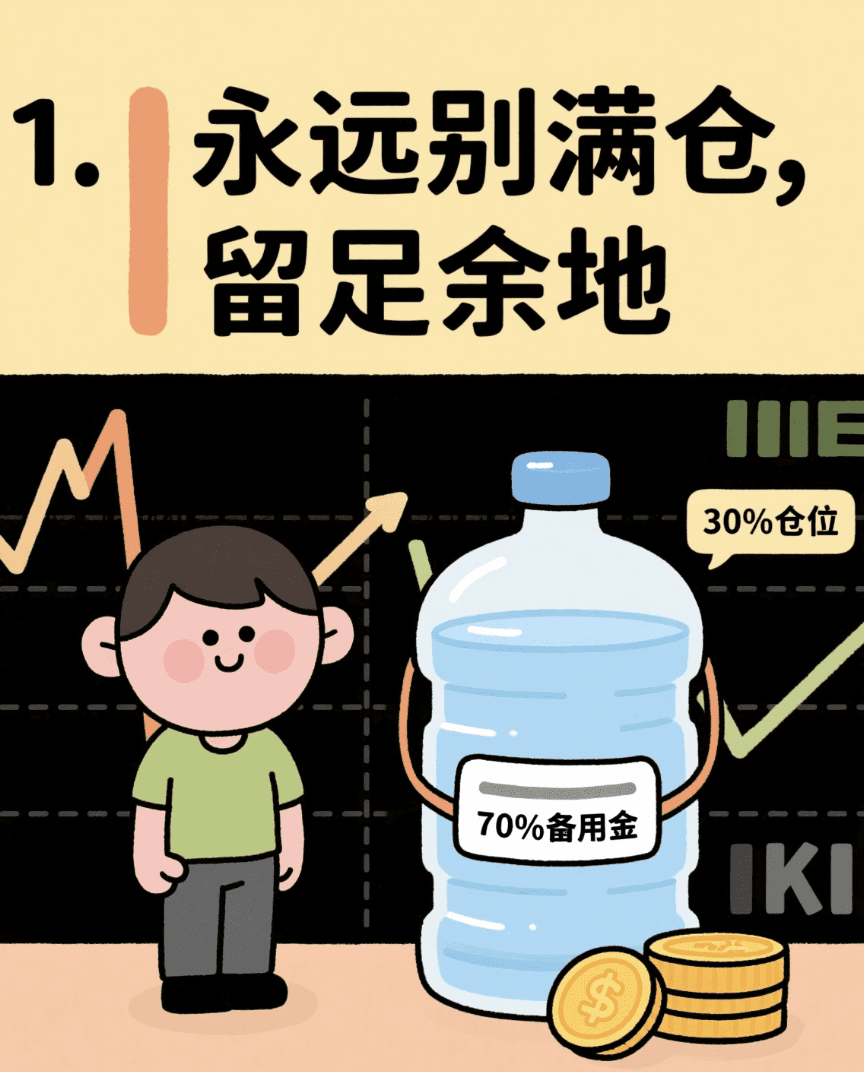
1. Never go all in, leave room for maneuver
No matter how good the market looks, only use a maximum of 30% of your position to enter, keeping the remaining 70% as 'spare funds'. When the market suddenly reverses, having 'bullets' in hand allows for flexible responses, leaving room for a turnaround opportunity.
2. Gradual position building, steadily increasing like climbing stairs
Don’t go all in at once; short-term fluctuations can easily trigger stop losses. You could try this:
- First position: Lightly test the waters during a bottom or breakout
- Second position: Add to positions after confirming the trend direction
- Third position: Add to positions with clear trends
Step by step, able to advance and retreat.
3. No averaging down on losses, no greed during rebounds
If a position is losing, don't think about averaging down—this is the pit most retail investors easily fall into. The real trick is: when the trend reverses, decisively cut your losses and take a break, waiting for the next opportunity. Take profits on rebounds, don’t cling to the battle.
4. Think about stop-loss and take-profit levels before placing an order
Before buying, you must clarify: at which point do you need to stop loss? At which point do you decisively take profits?
It is recommended to set at least a 1:2 risk-to-reward ratio for each trade, so that even with a success rate of only 50%, you can still profit in the long run.
In the crypto world, making 1 million requires either relying on a bull market and holding on, or betting on a wealthy coin, or betting the right direction with high leverage. But most people lose money, so don't just look at the stories of sudden wealth; first, think clearly about the risks you can bear.
If you are also a tech enthusiast in the crypto space, click on the coin homepage.
Click on my avatar to follow me for the latest information and in-depth analysis!