#MarketPullback Bitcoin $BTC
$115,507.00
-$2,379.00
(-2.02%)
Today
1D
5D
1M
6M
YTD
1Y
5Y
MAX
Technical Analysis & Market Insights — August 18, 2025
Key Price Movements & Trends
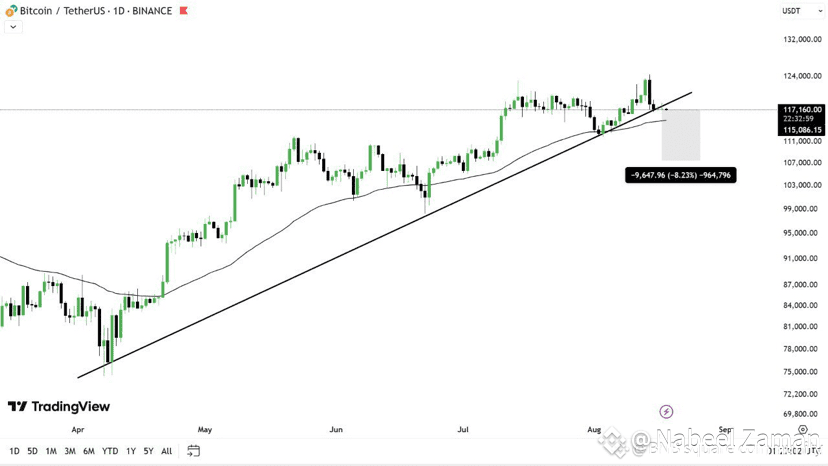
Price has pulled back from recent highs. Analysts Lark Davis and Michaël van de Poppe caution that BTC may test deeper lows in the $108 K–$112 K range despite lingering near $118 K
CoinDesk
.
Another source flags that Bitcoin could dip below $115,500, signaling a possible breakdown if bearish pressure persists
Mitrade
.
In fact, BTC recently slipped below $117,000, hovering closer to $116,800—a clear sign of short-term volatility and investor caution
AInvest
.
Technical Patterns & Indicators
Some analysts point to a "W"-shaped RSI formation—a rare, bullish setup that may foreshadow the next multi-month cycle peak. If validated, this pattern could signal renewed upward momentum
CryptoDnes.bg
.
BTC is currently in its seventh consecutive week of rally, but historically, such extended price discoveries often lead to corrections—so traders should be on guard
AInvest
Cointelegraph
.
Notably, the 200-day moving average recently reached $100,000—a psychologically and technically significant level that now serves as long-term support
Blockchain News
.
Technical Summary (TipRanks Data – August 17)
Indicator Signal
Summary Overall Hold (Neutral)
Moving Averages Mixed – shorter MAs (5, 10-day) are Sell, while longer MAs (50, 100, 200-day) are Buy
TipRanks
Oscillators Mostly Neutral, with ROC Buy, and MACD Sell
TipRanks
Pivot Levels Classic R1 around $120,044, S1 near $115,555
TipRanks
Summary: What's Going On?
Bearish Signals Emerging: BTC is retreating from the $124 K high reached on August 14 and now hovers around $115–118 K
Brave New Coin
The Economic Times
Bangla news
CoinDesk
AInvest
+1
Cointelegraph
.
Short-Term Correction Risk: Analysts anticipate a potential pullback to $108K–$112K and warn of a breakdown under $115.5K
CoinDesk
Mitrade
AInvest
Cointelegraph
.
Possible Bullish Recovery: The rare RSI "W" formation and strong long-term moving averages (50–200 day) offer a glimmer of bullish support
CryptoDnes.bg
Blockchain News
TipRanks
.
Neutral-to-Cautious Stance Advised: Technical indicators (from TipRanks) suggest a Hold—with mixed signals across timeframes and metrics
TipRanks
.
Key Levels to Watch:
Support: ~$115.5 K (short-term), ~$100 K (long-term via 200-day MA)
Resistance: ~$120 K (pivot R1), with psychological resistance in the $118–120K zone
What This Means for You
Traders: Watch for potential breakouts above $118–120K—or breakdowns below $115K. Monitor RSI and MACD closely.
Investors: The 200-day MA near $100K remains a stabilizing level if the market cools further.
Risk Managers: A cautious “wait and see” posture may suit many—consider using tight risk controls around current price zones.