1. Technical Analysis
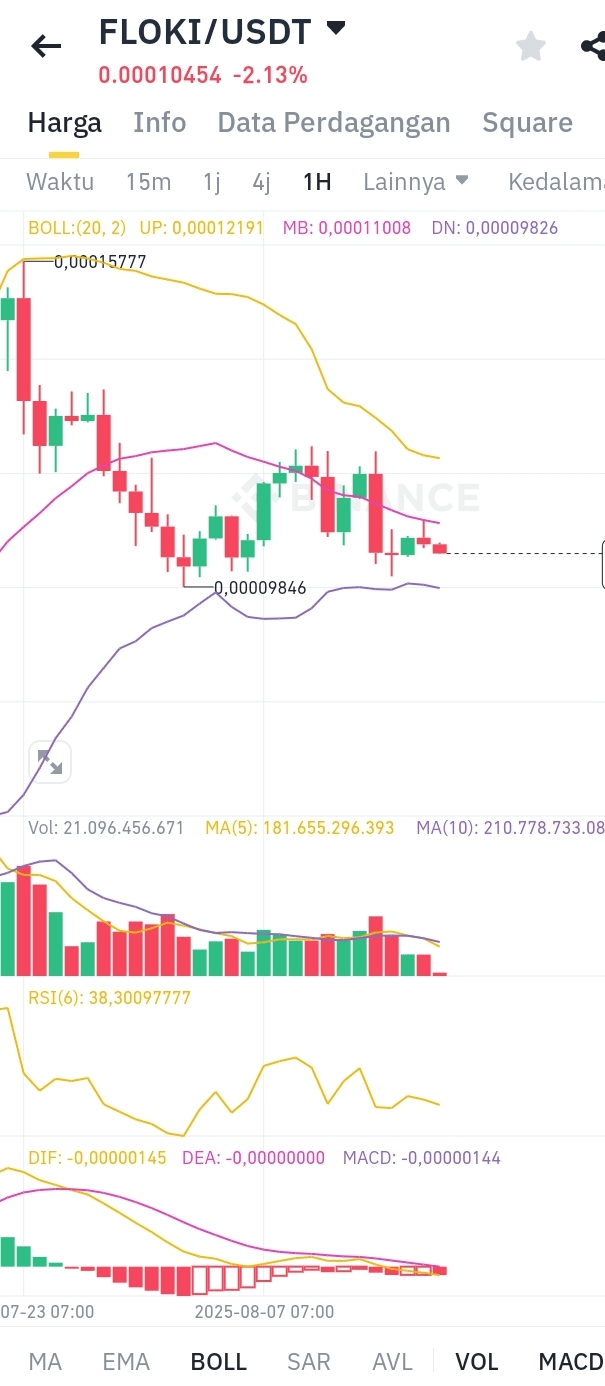
Current Price: 0.00010454 USDT (-2.13%).
Bollinger Bands Indicator:
Upper Band (UP): 0.00012191
Middle Band (MB): 0.00011008
Lower Band (DN): 0.00009826
The current price is below the Middle Band, approaching the Lower Band, indicating potential oversold.
RSI (6): 38.30 (approaching oversold level, but has not reached the extreme area below 30).
MACD:
DIF: -0.00000145
DEA: -0.00000000
MACD: -0.00000144 (negative value indicates bearish momentum).
Volume: 21.096B FLOKI, with MA(5) lower than MA(10), indicating a decrease in short-term trading volume.
2. Market Sentiment Analysis
The price drop of 2.13% indicates selling pressure.
RSI approaching oversold could be a rebound signal if confirmed by buying volume.
Trading Strategy
1. Strategy for Short-Term Traders (Scalping/Day Trading)
Entry Point:
If the price touches Lower Bollinger Band (0.00009826) and RSI < 30, it could be an accumulation area.
Confirm with increased buying volume to ensure a rebound.
Take Profit:
First target at Middle Bollinger Band (0.00011008).
Second target at Upper Bollinger Band (0.00012191).
Stop Loss: Below Lower Band (0.00009500) to avoid losses if the bearish trend continues.
Note: Use a 15m-1H timeframe to confirm signals.
2. Strategy for Medium-Term Traders (Swing Trading)
Entry Point:
Wait for reversal confirmation such as RSI > 50 and MACD crossover to positive.
If the price breaks through the Middle Band with high volume, it could be a strong entry signal.
Take Profit:
Target at Upper Band (0.00012191) or higher if the bullish trend is strong.
Stop Loss: Below the last swing low (0.00007754).
3. Strategy for Conservative Traders (Buy Dips)
Gradual Accumulation:
Buy in a strong support area (0.00009826 - 0.00009500) with oversold RSI.
Divide capital into 2-3 parts for price averaging.
Hold Until Rebound: Sell target at 0.00012000 or higher if the trend improves.
Risk Management
Use stop loss to limit losses.
Avoid trading with high leverage if volatility is unclear.
Monitor news related to FLOKI (such as project updates or general crypto market sentiment).
Conclusion
Bullish Scenario: If the price rebounds from the Lower Band with high volume, it could be a buying opportunity.
Bearish Scenario: If the price breaks through the Lower Band and RSI remains below 30, potential continuation of downtrend.
Recommendation: Wait for technical signal confirmation and combine with volume analysis for optimal entry.