Technical Analysis PEPE/USDT
1. Bollinger Bands (BOLL) Indicator
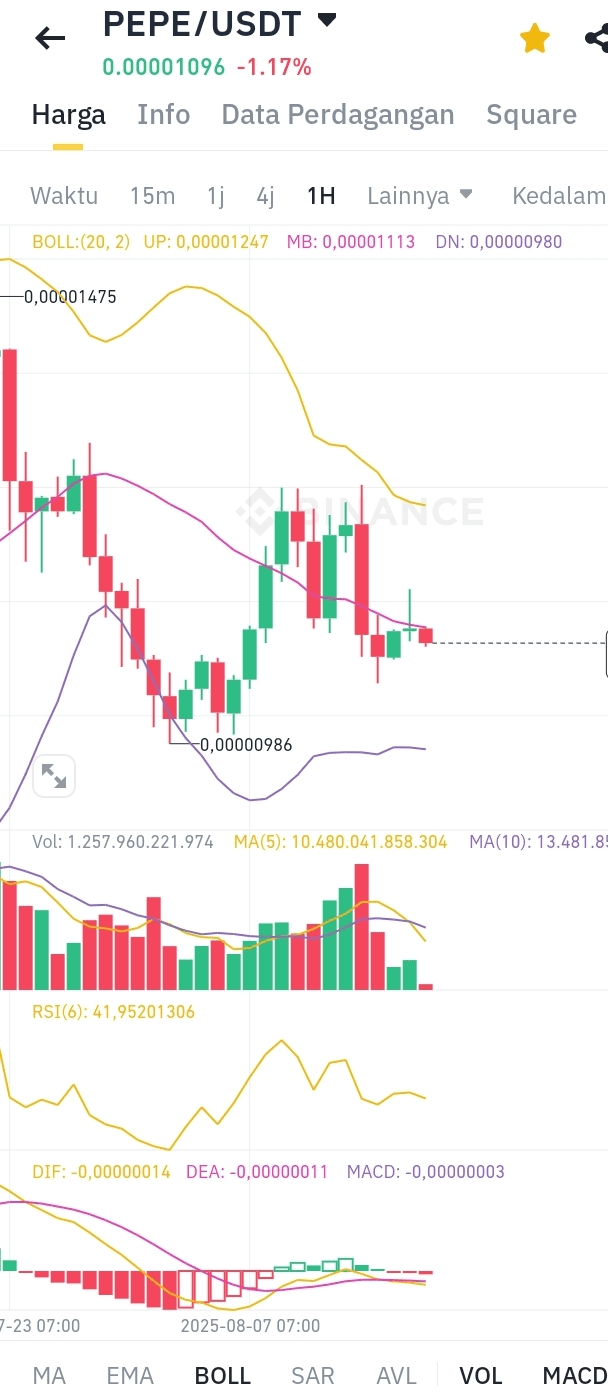
Upper Band (UP): 0.00001247
Middle Band (MB): 0.00001113
Lower Band (DN): 0.00000980
Current Price: 0.00001096
Interpretation: Current price is between the middle band (MB) and lower band (DN), indicating selling pressure. If the price approaches the lower band (0.00000980), it could be a potential support area for a rebound. Conversely, if the price breaks below the lower band, the downtrend may continue.
2. Relative Strength Index (RSI)
RSI(6): 41.95
Interpretation: RSI is below 50, indicating bearish momentum. However, it has not yet entered the oversold area (usually <30), so there is still room for further decline before a rebound.
3. Moving Averages (MA)
24h Volume: 1,257,960,221,974
MA(5): 10,480,041,858,304
MA(10): 13,481,851,289,301
Interpretation: Current trading volume is lower than MA(5) and MA(10), indicating decreased trader interest in the short term. This could indicate consolidation or further decline.
4. MACD
DIF: -0.00000014
DEA: -0.00000011
MACD: -0.00000003
Interpretation: MACD is below the signal line (DIF < DEA) and is negative, indicating bearish momentum. However, the difference between DIF and DEA is small, so further confirmation is needed for a trend change.
PEPE/USDT Trading Strategy
1. Bearish Scenario (Price Decline)
Entry Point: If the price breaks below the lower band (0.00000980) with high volume.
Target Profit: 0.00000950 (next support or psychological level).
Stop Loss: 0.00001100 (above the middle band).
Confirmation: RSI enters the oversold area (<30) or MACD shows bullish divergence.
2. Bullish Scenario (Rebound)
Entry Point: If the price bounces off the lower band (0.00000980) with high volume and RSI starts to rise from the oversold area.
Target Profit: 0.00001113 (middle band) or 0.00001247 (upper band).
Stop Loss: 0.00000950 (below the lower band).
Confirmation: MACD crossover upwards (DIF > DEA) or trading volume increases significantly.
3. Consolidation Scenario (Sideways)
Range Trading: Buy near the lower band (0.00000980) and sell near the middle band (0.00001113).
Stop Loss: Outside the range (e.g., 0.00000950 for long, 0.00001130 for short).
Confirmation: Low volume and RSI approaching 50.
Risk Management
Use Stop Loss: Limit maximum loss to 1-2% of capital per trade.
Watch Volume: High volume during breakout/breakdown increases the validity of the signal.
Avoid FOMO: Wait for confirmation from several indicators before entry.
Additional Notes
Suitable for day trading (intraday).
Fundamentals: Monitor news related to meme coins or Binance for sudden impact.
With the current indicators, PEPE tends to be bearish in the short term. Stay disciplined and monitor price movements to adjust strategies.