Stellar (XLM)'s recent price movement is attracting market attention - its daily chart exhibits a technical pattern similar to XRP earlier this year, seen by many investors as a potential bullish signal.
From the chart, XLM has formed a clear 'inverted head and shoulders' pattern: the left shoulder began in January, the deep head shape formed at the end of May, and the right shoulder has been gradually completed since August. The current price is approximately $0.452, just below the critical $0.50 neckline, a level widely regarded as the 'gateway' for a significant upward movement.
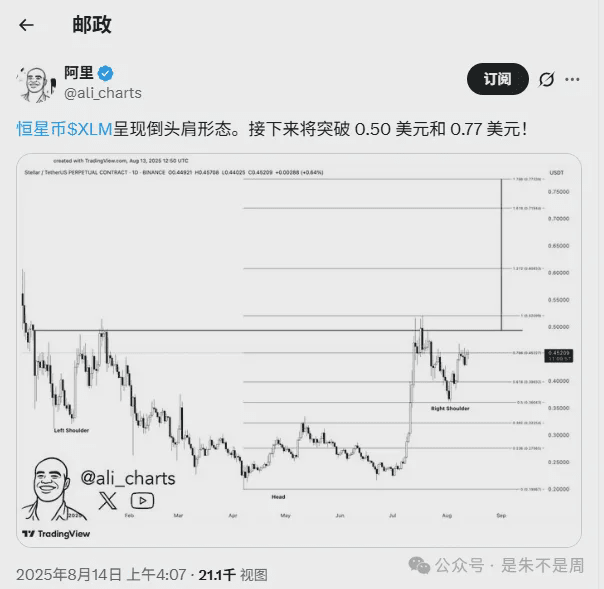
The market significance of this pattern lies not only in the technical structure itself but also in the historical memories it evokes. Earlier this year, XRP experienced a double-digit percentage increase after breaking through a similar neckline. For XLM, Fibonacci extension indicators also point to similar potential: if the breakout is successful, the 1.618 extension corresponds to $0.71, and the 1.786 extension is close to $0.77, suggesting considerable upside potential.
However, a breakout requires strong buying support. The clearest signal will be a daily closing price stabilizing above $0.50, accompanied by robust trading volume. If it fails to break through, XLM may pull back to the support levels of $0.40 or even $0.36, to gather strength for the next attempt.
The market is currently closely watching whether XLM can replicate XRP's price trajectory, with the battle around the $0.50 neckline becoming the short-term focus.

