The main discussion here is about the opening price and closing price of Bitcoin, sharing the market sentiment and trading methods after the technical patterns break, involving most patterns, bottom patterns and.
Top patterns and continuation patterns, moving averages and trend charts. The following chart shows the trend of Bitcoin after the convergence triangle breakdown, with the time period based on daily candlesticks.
The time taken for the formation is relatively long, three and a half months. There are also short-cycle candlestick charts, 1-hour candlestick charts.
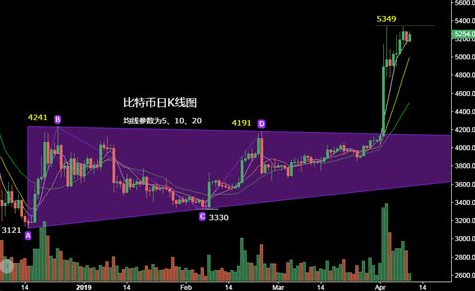
Chart 2 and Chart 3 are 1-hour candlestick charts, with a time period of one hour. The time taken for this convergence triangle pattern to form is also relatively short, about three to five days or a week.
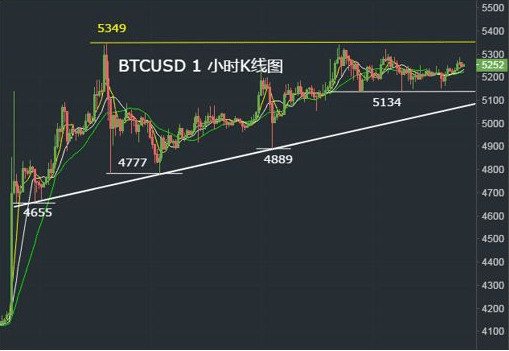
Chart 2 - Bitcoin 1-Hour Candlestick Chart
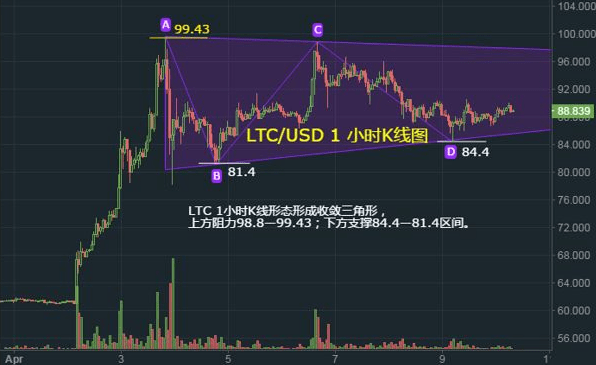
Chart 3 - Litecoin 1-Hour Candlestick Trend
Why can we chase after a rise after a breakout, and why can we short when it breaks down? First, look at the daily candlestick chart for April 2nd, which shows the candlestick chart after the convergence triangle breakout, regardless of its authenticity.
All relate to how to avoid if it is a false breakout, and where to support and exit.
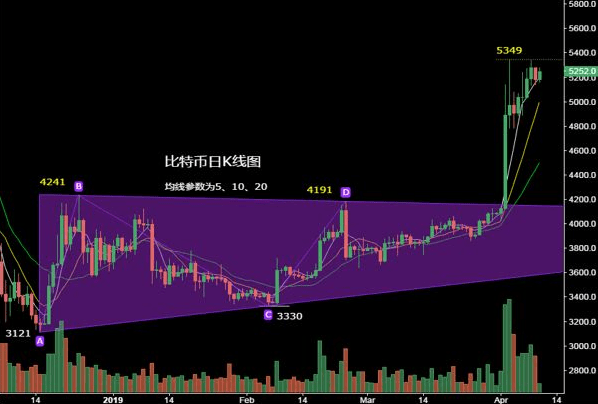
Chart 4 - Last Tuesday's Upward Breakout
On April 1st, when approaching the resistance line, the area above 4100, where the convergence triangle has not broken, is all resistance. The closer we get to the resistance line, the more people will choose to short and exit.
Go long, short at highs, and of course, some people choose to wait and see. When shorting near the upper resistance line of the triangle, the stop-loss point must be at 4243, meaning.
When the price breaks upwards through 4240, basically all the short sellers will exit.
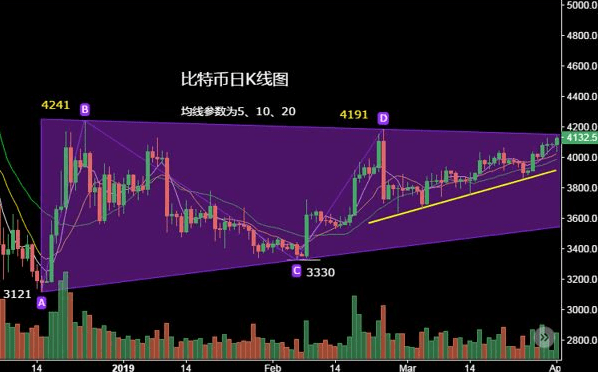
Chart 5 - Before Breaking the Convergence Triangle
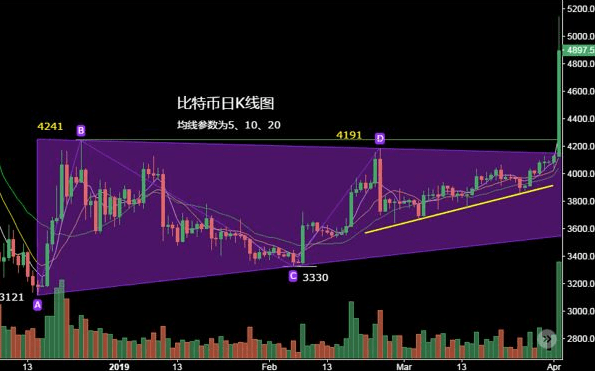
Chart 6 - Daily Candlestick of the Breakthrough Day on April 2nd
At that time, after the breakout, Chart 6 shows the candlestick chart of April 2nd, and when it broke through to 4400-4600. As long as these prices were seen breaking upwards through 4241, then it is already.
Breaking upwards, or saying it breaks above 4200, it has already broken upwards.
Some traders may use the time cycle as daily or weekly units, meaning they may hold positions for several weeks. This means that in this triangular range.
In the original range, they may look bullish for several weeks or bearish for several weeks. However, these users just need to see the price break upwards through 4200 or above 4241.
After that, they will all have a unified thought that the market should rise, and those who short will definitely exit.
The key lies in the change in market sentiment right after the breakthrough. Pay special attention to what the market sentiment was like at that time.
Originally long, seeing the upward breakout confirming the position, will continue to be bullish. After the pattern breaks out, the pattern looks bullish, and those who are bullish will add positions (note that the action is to buy and open positions). Originally.
Originally short (shorting from December 15 to April 1), after the convergence triangle broke, when the upward trend became clear, they would exit quickly to stop losses, and those who shorted would incur losses.
In the end, in order to quickly reach breakeven, after the short position stops out, they will turn around and go long and look bullish. At this time, those who short will stop out (which means buying to close the position, note.
The action is to buy), actively turning around to go long (the action is to buy and open positions), those who are waiting will also enter the market to chase long after seeing the clear trend, and the trading actions will also.
Is to buy. All traders, in a short period, concentrated actions are all buying, so the price will naturally surge in a short time. So Bitcoin on April 2nd.
When breaking through 4200, its upward momentum is very, very fast.
The key point for profit space is a determined sense of direction and speed. What price you buy at and how much you earn depend on speed. If you buy quickly enough, then naturally the later purchases.
People will push the price higher, so the profit space will be very large. Therefore, at critical points, trading requires high demands. It is necessary to monitor in real-time, especially at critical points.
It is a turning point in the market, approaching the upper track in months, and it is worth spending time monitoring. Especially at critical moments.
The width of the convergence triangle in the daily candlestick chart of Bitcoin. How wide is the widest convergence triangle? The widest is from 4241 to 3121. The widest space is 1100. There’s a small part.
Some people continuously look to short or say they look to short at very low prices. Then there are also some people continuously looking long, so in this range, there are all kinds of people, and some are at even lower.
Those who shorted at lower prices like 3400 or 3500.
However, when the price breaks upwards through 4200, if those traders who continuously short have their maximum loss reach 600 to 700 points, then if we say to take this.
To make back the losses, one has to turn around and go long for 600 to 700 points. Basically, short sellers will turn around to reach breakeven. The largest fluctuation in this range is 1.
100. Those who shorted below the lowest price of 3300-3400 lost the most, and when it broke through 4200, they could potentially lose 800 points and would need to turn around and go long by 800 points.
The money only balances when the price breaks upwards through 4200, looking bullish for 800 points means 5000. The highest price will be between 4300-4400, with some pending orders, and it may also go up to 43.
Around 00, or above 4250, it may have a pending order.
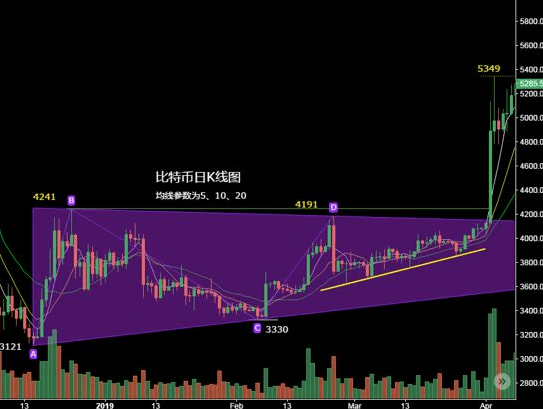
Chart 7 - How wide is the amplitude of the convergence triangle, the space for the first target will be that much.
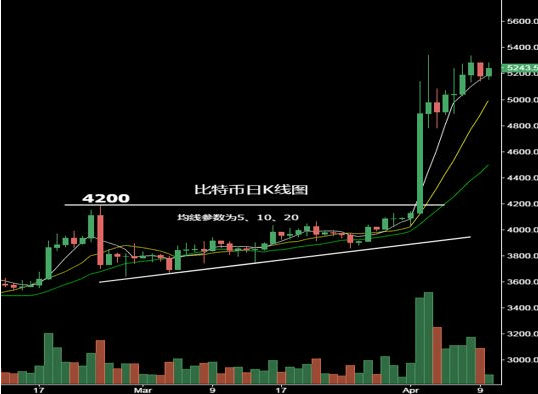
Chart 8 - The Regularity of Technical Trends
The regularity of technical trends can be observed by looking at the trend chart of Bitcoin on the daily candlestick cycle. In the previous core course, we taught everyone three methods to look at trends, the most.
What was mentioned earlier is one of the three main methods, either trend lines, the definition of trends, or moving averages, which are these three methods. Look at Bitcoin's price at that time.
The price before April 1st, or after March 27th, is above the moving average of Bitcoin's daily chart. During the technical course, we always emphasized the daily candlestick.
The chart being above the moving average is obviously strong. The lower inclined support line shows that the support level below this support line is getting higher and higher. At that time, it moved upwards.
Before breaking 4200, although it did not break upwards, it can still be observed that the lowest point is getting higher, just like laying a foundation.
There are also other patterns, such as head and shoulders bottom, head and shoulders top, or M tops, double tops and double bottoms. The nature is the same; the market sentiment is the same. The key is to identify.
The key resistance line that broke out at that time, or the support line or breakdown point.
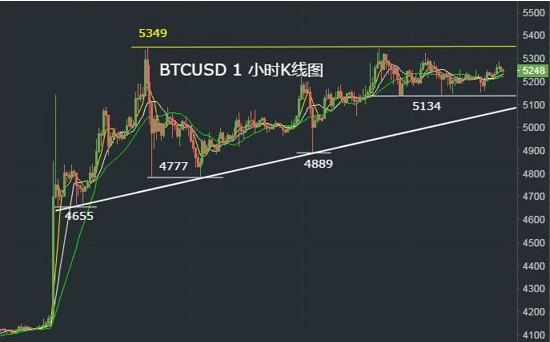
Chart 9 - Ascending Triangle
Ascending triangle, its characteristic is that the upper part is at the same horizontal price level, and the lower support line is getting higher. This kind of trend is accumulating momentum, waiting for an upward breakthrough.
Break.
This type of convergence triangle pattern, whether breaking upwards or downwards, will hold for a while. Why does the market need to hold for a while? Because the longer it holds, the more explosive it becomes.
The stronger the strength, the stronger the trend.
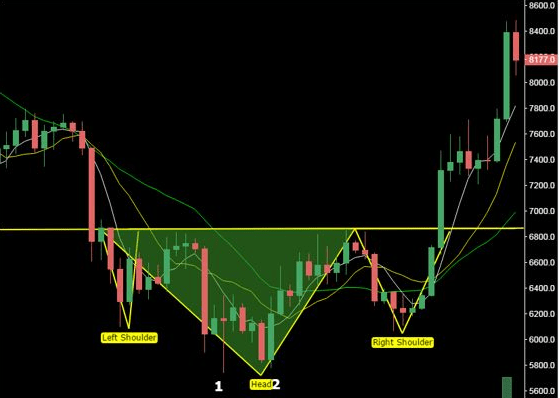
Chart 10 - Double Bottom or Double Top Pattern
This double bottom pattern is the trend of Bitcoin from mid-June to the end of July. This double bottom formed from June 11 to July 17. The head of this double bottom is at 1.
Chart 10. So where is the head? The head of the head and shoulders bottom is at 5750. On July 17th for Bitcoin, it did not break upwards. Before this double bottom.
One can only assume that it is a double bottom, only when it breaks upwards through 6840 can it confirm that the double bottom pattern is established. Chart 11. Just like Bitcoin broke through the pressure line upwards last week.
Times.
6840 is a horizontal pressure line, and in practice, it can also be sloped. This is quite special; it is a horizontal line. This horizontal line is equivalent to last week's Bitcoin.
When the coin breaks upwards through 4200, the pressure line is the same, and the market sentiment when breaking upwards from this convergence triangle is identical, just like at 6840.
Some traders may short with a stop at 6847, but if they short, they may incur losses. After these short sellers incur losses, in order to balance their profits and losses, they will turn around.
To go long, those who are long will also add positions. When it breaks through the neck line and pressure line, at that time, everyone in the market was going long.
When everyone is going long, meaning everyone is entering the market, then this price will naturally be pushed up, so after it breaks through the neck line, the momentum is the greatest.
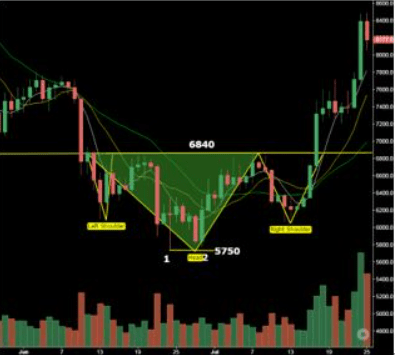
Chart 11 - Double Bottom Pattern
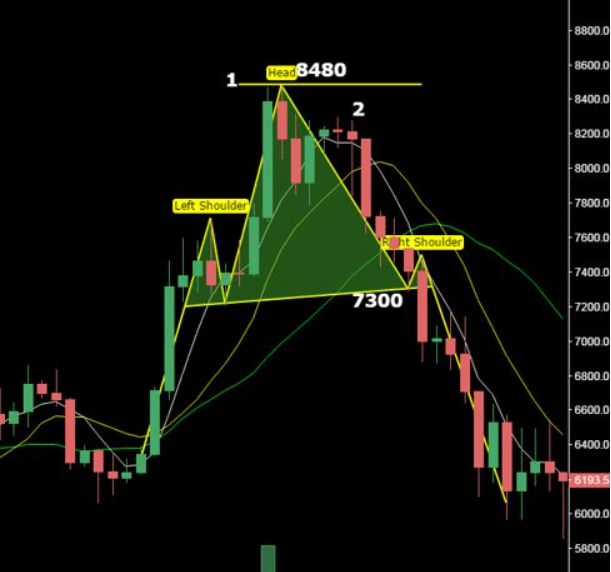
Chart 12 - Double Top Pattern
This is a double top, just like the market from the end of July to the beginning of August last year. The top is 8480, which is the highest point, and the neck limit is 7300. You can see how wide the space is from 7300 to 8480.
The first target is reached at 6100. The space from 8480 to 7300 is 1180. The space from the neck limit to the head is how wide it is downwards; the wider the space downward, the larger the downside space.
Subtract 1180 from 00, then the price reaches 6120. In other words, it reaches below 6000. Similarly, where is the breakout point or level? It is at 7300.
It is said that we must find this critical point, which is the key support line. At that time, this line was 7300. This means that when the price breaks through 7300, many.
Everyone is shorting.
Chart 12, strictly speaking, it is a double top, which means the double top and head, shoulder top. The difference is that one has two heads, and one has one head. Actually, there’s no difference.
There is a significant difference, the key is to see the space it breaks through the neck line, which means that after the key support level breaks, it can indicate this head and shoulders top or a double top.
The top is established.
The breakdown of technical patterns, or upward breakouts, has a longer time cycle. If everyone is willing to guard or wait for this kind of pattern, once it breaks down.
After that, its spatial return rate is very, very high, but making such trades can only happen a few times a year.
There are only a few opportunities in a year, or maybe one or two in a month. Just like Bitcoin, waiting for three and a half months, it breaks upwards through 4200, 3100 to 420.
0, this space can do a few more times, but in three and a half months, it is only a few times.
If using this pattern as a cycle, the trading frequency is very low. Just mentioned that these patterns are based on the daily candlestick cycle. In fact, many times, the small cycle.
Upwards. In particular, convergence triangles can often form within a few days, meaning there are more trading opportunities on the hourly chart. Regardless of whether it's based on the daily candlestick or weekly.
Whether in the daily or 1-hour candlestick cycle, the market sentiment during upward breakouts or downward breakdowns is the same, which means that in the key daily candlestick cycle, it comes out.
The time will be relatively long, while the hourly candlestick cycle takes a relatively short time; the hourly candlestick cycle time itself is very short.
To summarize, these patterns (convergence triangles, head and shoulders bottom, head and shoulders top, double tops, double bottoms), whether on the daily candlestick cycle or the 1-hour candlestick cycle, generally.
In this case, the amplitude of the pattern determines how wide the space is after a breakdown or breakout.
In the future, when seeing the convergence triangle breaking out, of course, it is a real breakout. How much space is there during a real breakout, you can measure for yourself. Of course, I will start sharing with everyone.
Regardless of whether it is a true or false breakout, just do it. So later, when trading, it is advisable to find some key pattern breakout points to trade. In the previous segments.
In the course, we also talked about how to act after a breakdown. In fact, many times trading is about making this kind of breakout or breakthrough market movement.
Before any breakthrough market, we taught everyone to follow, whether it is a real breakthrough or a false breakout.


