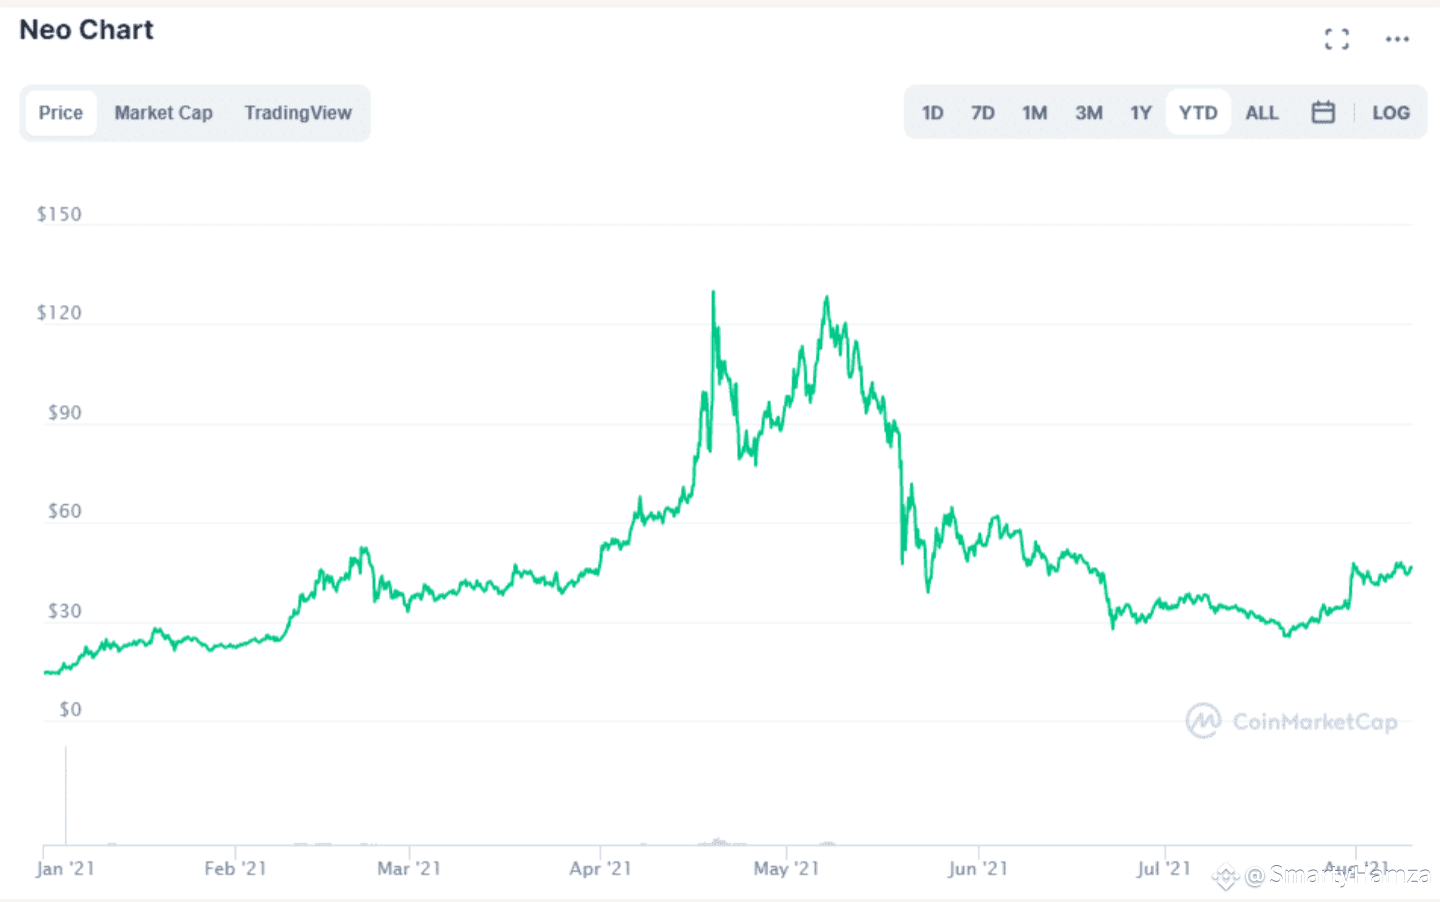
$NEO Highlights from the TradingView NEO Chart
Real-time candlestick patterns: You can view 1-minute to weekly timeframes.
Technical indicators: Includes moving averages, RSI, MACD, and volume overlays.
Community insights: Traders share ideas like breakout targets, support zones, and trend reversals.
Recent analysis:
. NEO is forming an ascending triangle, suggesting a potential breakout.
• Key support: $6.08
• Target levels: $8.06, $8.95, $10.21, and $11.81
Long-term accumulation zone:
$3.90-$4.50, historically linked to major rallies.