---$DOGE
🐕 DOGE/USDT – Current Market Situation (4H Chart Analysis)
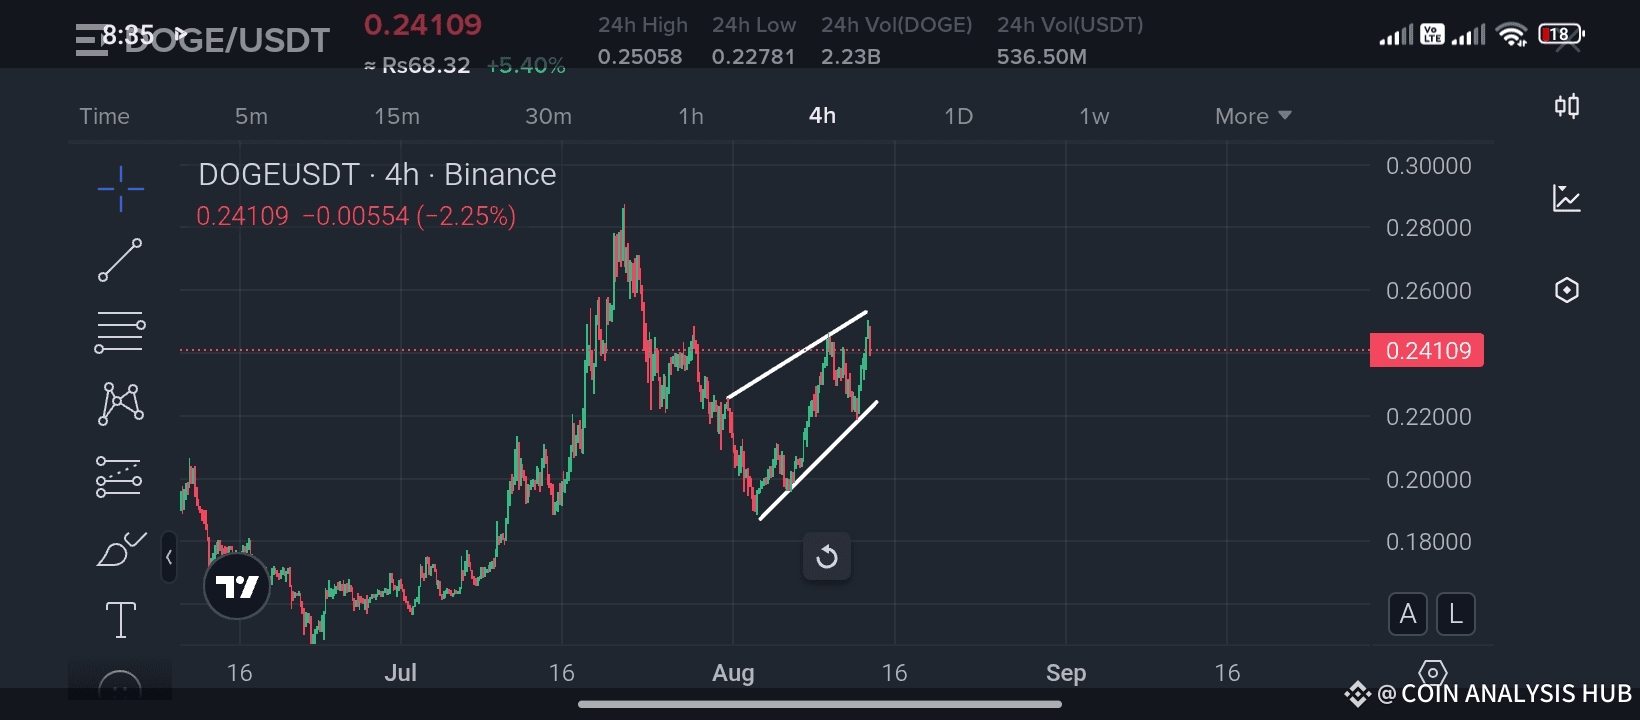
Dogecoin has been showing interesting price action lately, forming a pattern that traders should pay close attention to. Currently trading at $0.24109, DOGE is down about 2.25% in the last 4 hours, but the structure is setting up for a potential decisive move.
1️⃣ Recent Price Action
After a sharp rally in mid-July, DOGE faced heavy resistance near $0.25–$0.26.
Price pulled back to the $0.20–$0.21 area before bouncing strongly.
The recent move has formed a rising wedge pattern (highlighted by the white trendlines), which often signals a slowdown in bullish momentum.
---
2️⃣ Current Technical Structure
Pattern: Rising Wedge
Typically a bearish pattern if confirmed with a downside breakout.
However, breakouts can occur in either direction depending on overall market sentiment.
Key Resistance: $0.25–$0.26 zone.
Immediate Support: Around $0.23.
Major Support: $0.20.
---
3️⃣ Volume & Momentum
24h Volume stands at 2.23B DOGE, showing active participation.
Momentum indicators (not shown here but implied by price structure) suggest buying pressure is still present, but the wedge narrowing signals a potential volatility spike soon.
---
4️⃣ Possible Scenarios
Bullish Case:
If DOGE breaks above the wedge and clears the $0.26 resistance with strong volume, it could quickly test $0.28–$0.30 in the short term.
Bearish Case:
If DOGE fails to hold the wedge support and breaks below $0.23, a pullback toward $0.21–$0.20 is likely, which is a major demand zone.
---
5️⃣ Strategic Outlook
Short-term traders: Watch for breakout confirmation before entering, as wedge breakouts can be volatile.
Long-term holders: The $0.20 zone remains a strong accumulation area if a correction occurs.
Risk management: Avoid chasing price inside the wedge; wait for a clear direction.
---
📌 Conclusion:
DOGE is at a crossroads inside a rising wedge. The next move will depend heavily on whether bulls can break resistance or if bears take control. Traders should prepare for increased volatility and trade with clear stop levels.
🚀 Trend: Neutral–Bullish (short-term caution)
📅 Timeframe: 4H chart
🎯 Next Resistance: $0.26 → $0.28–$0.30
🛡 Key Support: $0.23 → $0.20