#BinanceSquare In the world of Japanese candlesticks, there are some signals that do not appear often… But when they do, they are like a manual alarm bell in the trader's ear. One of these signals is the Hanging Man candle.
🔍 What is the Hanging Man Candle?
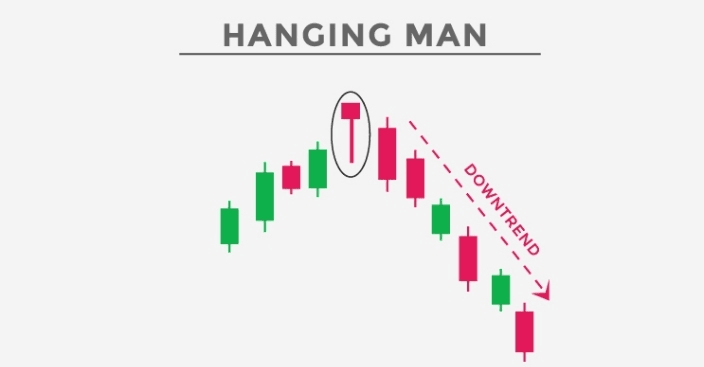
The Hanging Man candle is a bearish reversal pattern that often appears after a strong upward trend.
Characterized by:
A small body (bullish or bearish) at the top.
A long lower shadow at least twice the length of the body.
A short or nonexistent upper shadow.
Its shape suggests that the price tried to drop significantly during the session but closed near the top… However, this failed attempt leaves a clear warning: buyers are starting to weaken.
💡 The Difference Between Hanging Man and Inverted Hammer
The shape may sometimes look similar, but the position in the trend changes the meaning entirely.
Inverted Hammer: Appears after a downtrend and serves as a signal of a potential upward reversal. (We previously explained this in one of our past lessons).
Hanging Man: Appears after an upward trend and serves as a warning of a potential downward reversal.
Element Inverted Hammer Hanging Man
Location After a Downtrend After an Uptrend
Signal Probability of Rise Probability of Fall
Significance Buyers Entering After Fall Sellers Entering After Rise
📈 Live Example from the Market
Imagine a coin like $BTC or $PEPE rising for several consecutive hours, then a candle appears with a small body at the top and a long lower shadow… After that, a strong red candle confirms the reversal.
This scenario often repeats at temporary peaks, especially in smaller time frames (15m, 1h) and also in larger time frames (daily).
🛡️ How to Handle It Professionally?
1. Do not rely on it alone: Wait for confirmation with a bearish candle afterward or a break of a nearby support level.
2. Watch for trading volume: If the trading volume is high when the Hanging Man appears, it is a stronger signal.
3. Combine it with indicators like RSI or MACD to see if the market is in an overbought zone.
⚠️ Common Mistake
Some sell as soon as they see the Hanging Man, and that’s a mistake… It could be just a stop before continuing to rise. Confirmation is key.
🎯 Summary
The Hanging Man candle is not just a pretty shape on the chart… It is a warning from the market that the rise is losing momentum.
As for the inverted hammer, despite its similar shape, its reverse context makes it a message of hope for traders at the end of a downtrend.
The secret to understanding candles is reading the story told by the previous trend.
5. #BinanceFeed


