

Monthly MACD bullish crossover emerges, resembling the 2018–2021 cycle pre rally setup in the altcoin market.
Altcoin market cap consolidates below $1.57T resistance, with RSI and MACD indicating sustained buying momentum.
Daily trend holds above $1.50T support, eyeing $1.60–$1.65T if current bullish structure and momentum persist.
The altcoin market is nearing a key technical point as a bullish crossover emerges on the monthly MACD. According to analyst El Crypto Prof, the setup in the TOTAL2 chart shows similarities to the 2018–2021 cycle.
Both periods feature a rounded bottom pattern with two distinct lows, followed by sustained resistance testing. The current structure has been developing since the 2021 peak, bottoming near $460 billion in late 2022 before gradually recovering.
Historical Patterns Indicate Familiar Market Outlook
In the previous cycle, a breakout above the $430 billion level in 2020 led to a sharp rally, pushing market cap beyond $1.5 trillion. That move eventually peaked above $1.7 trillion before reversing.
Presently, the market has been consolidating below $1.57 trillion, a key resistance level. The ongoing monthly candle is testing this zone, suggesting a potential retest of historical highs near $1.9–$2.1 trillion if momentum holds.
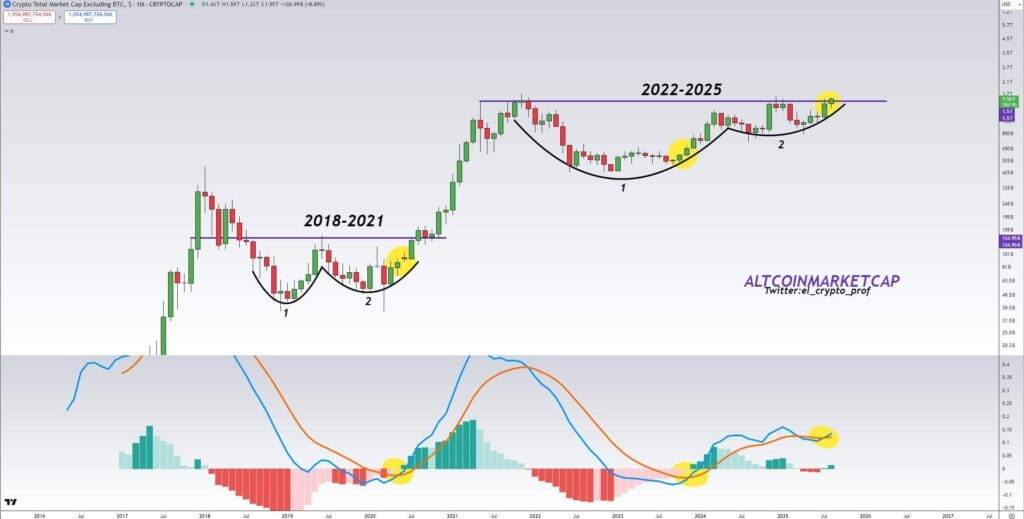 TOTAL2 1-month price chart, Source: El Crypto Prof on X
This pattern is supported by the MACD, which in 2019 crossed bullishly before a major uptrend. A similar crossover occurred in 2024, with the MACD line moving above the signal line and histogram momentum changing from red to green. This change indicates strengthening buying pressure in the broader altcoin market.
Strong Rebound From Mid Year Pullback
The Altcoin Total Market Cap at $1.54 trillion, up by 0.58%. From early February to mid April 2025, the market declined from $1.55 trillion to $1.07 trillion. This downtrend reversed in May as prices surged back to the $1.55 trillion area by late June.
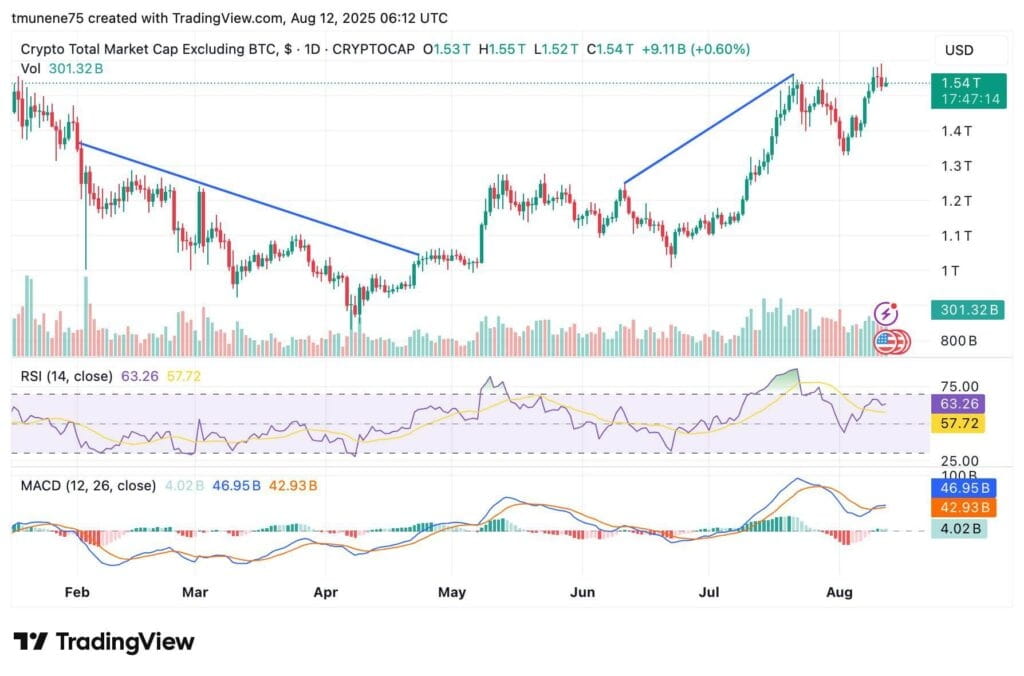 TOTAL2 1-day price chart, Source: TradingView
After a pullback in July, consolidation has set in just below yearly highs. Daily volume is at $301.32 billion, indicating moderate trading activity. RSI is at 63.23, above its moving average of 57.72, showing momentum is positive but not yet overbought.
Key Levels
Technical indicators support the current bullish outlook. On the daily chart, MACD at 46.93 billion is above its signal line at 42.93 billion. Green histogram bars point to continued buying interest.
Holding above $1.50 trillion strengthens the case for a breakout toward $1.60–$1.65 trillion. However, rejection near $1.55 trillion could lead to a retracement to $1.45 trillion before another advance.
The post Analyst Predicts Major Altcoin Surge After Monthly MACD Bullish Crossover appears on Crypto Front News. Visit our website to read more interesting articles about cryptocurrency, blockchain technology, and digital assets.