$ETH ($ETH) has reached a critical juncture, with traders split on whether the next big move will be a deep correction or a rocket ride toward $7,000.
🚀 Breakout Sparks Bullish Momentum
$ETH has surged past the $4,000 mark for the first time since December, hitting a high of $4,329 this week. The price now sits around $4,303 — up 19% over the past 7 days and an impressive 190% year-to-date.
This rally follows a decisive breakout from a multi-year “megaphone” chart pattern. ETH is now trading above all major moving averages, with the 50-day MA crossing above the 200-day MA — a golden cross. Momentum indicators like MACD are firmly bullish, suggesting further upside.
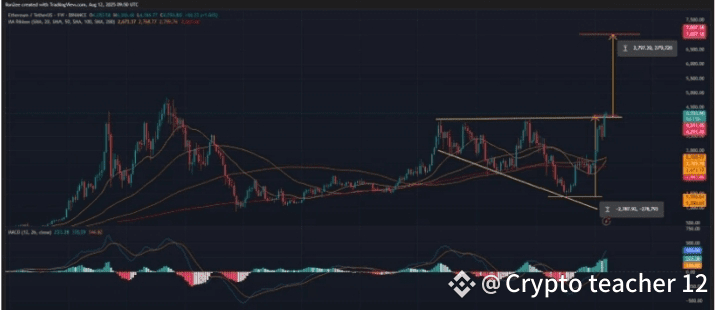
If the trend holds, $7,000 is a realistic target, just 62% away. The market is also less than 12% from all-time highs.
⚠️ Watch These Key Price Levels
Data from CoinGlass highlights heavy liquidation zones at $4,200–$4,300 and again between $4,400–$4,500, which could act as strong magnets for price. On the downside, $4,100–$4,150 serves as critical support. A breakdown below could trigger rapid sell-offs.
🏦 Institutional Money Flows In
In a single day, Ethereum ETFs recorded $1 billion in net inflows — the biggest since their launch. This signals growing institutional demand after a quiet period. However, Glassnode data shows short-term holders are cashing out faster than long-term investors, hinting at possible near-term volatility.
📅 Macro Factors in Play
This week’s U.S. economic releases — CPI (Tuesday), PPI (Thursday), and retail sales (Friday) — could be pivotal. Cooling inflation and potential early Fed rate cuts would likely fuel crypto gains.
Meanwhile, Bitcoin’s recent spike to $122k left an open CME gap at $117,200. If BTC corrects to fill that gap, ETH could face a short-term pullback before resuming its trend.
💡 Bottom Line: The stage is set for a big move — whether that’s a leap toward $7,000 or a sharp correction depends on both technical triggers and macroeconomic signals.