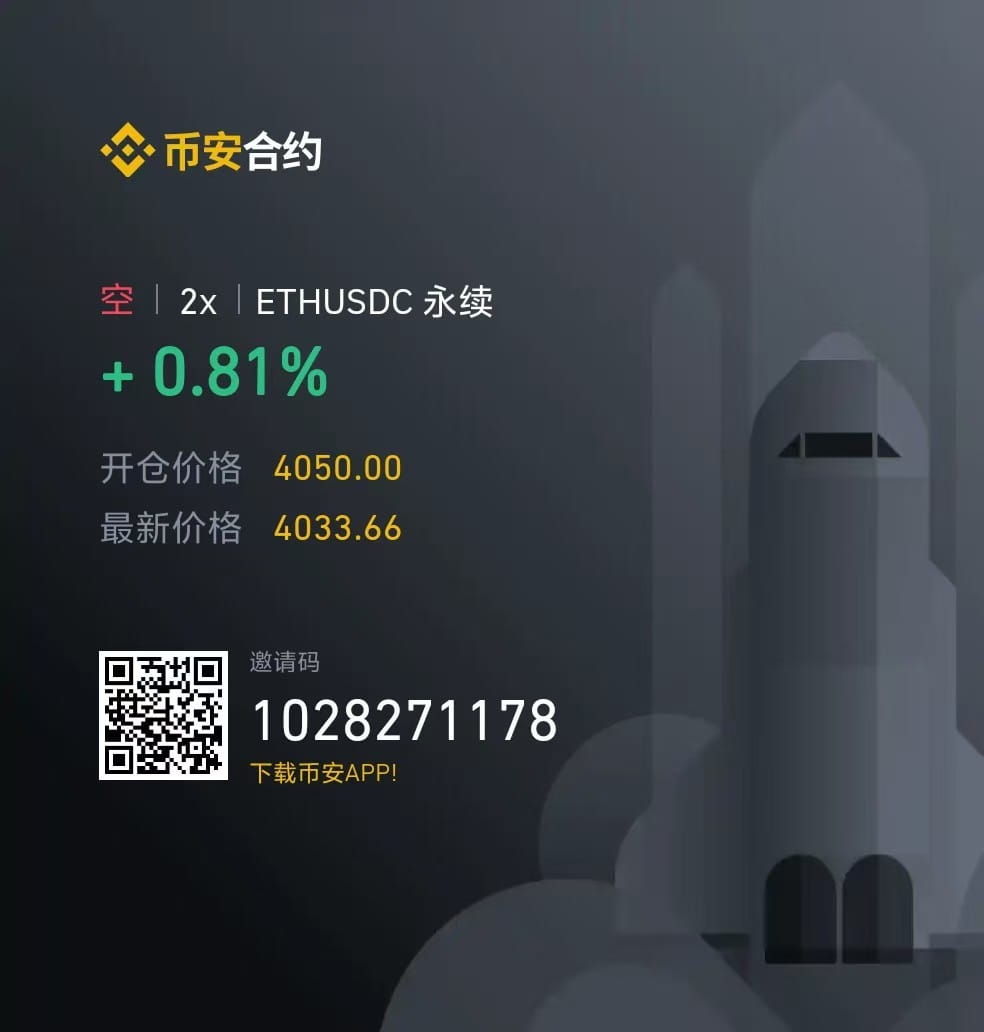
Ethereum (ETH) is currently fluctuating around $4050, appearing strong, but based on technical analysis and market sentiment, I believe this is a good shorting opportunity.
I. Technical analysis
1. Key resistance level: Strong pressure in the 4050-4150 area
ETH encounters historical resistance around $4050. From a daily chart perspective, the 4050-4150 area is a strong resistance zone tested multiple times in 2021 and 2022. The current price has clearly slowed down in this area, and the candlestick pattern shows a long upper shadow 'gravestone doji' or 'shooting star', suggesting weakening bullish momentum and accumulating selling pressure.
Additionally, the Fibonacci retracement tool shows that ETH rebounded from a recent low of $2800 to $4050, precisely touching the 0.618 golden ratio, which is often a potential reversal point for a rebound. Combining historical resistance, $4050 becomes an ideal entry point for bears.
2. Technical indicator divergence: RSI and MACD issuing warnings
On the 4-hour and daily charts, the RSI (Relative Strength Index) shows a top divergence: the price has reached a new high, while the RSI has failed to reach a new high, indicating insufficient bullish momentum. The MACD indicator also shows the fast line and the slow line converging at a high level, and the histogram is shortening, indicating that the trend may reverse.
These divergence signals suggest that although the price is still rising, the internal driving force of the market is waning, and bearish power may take over.
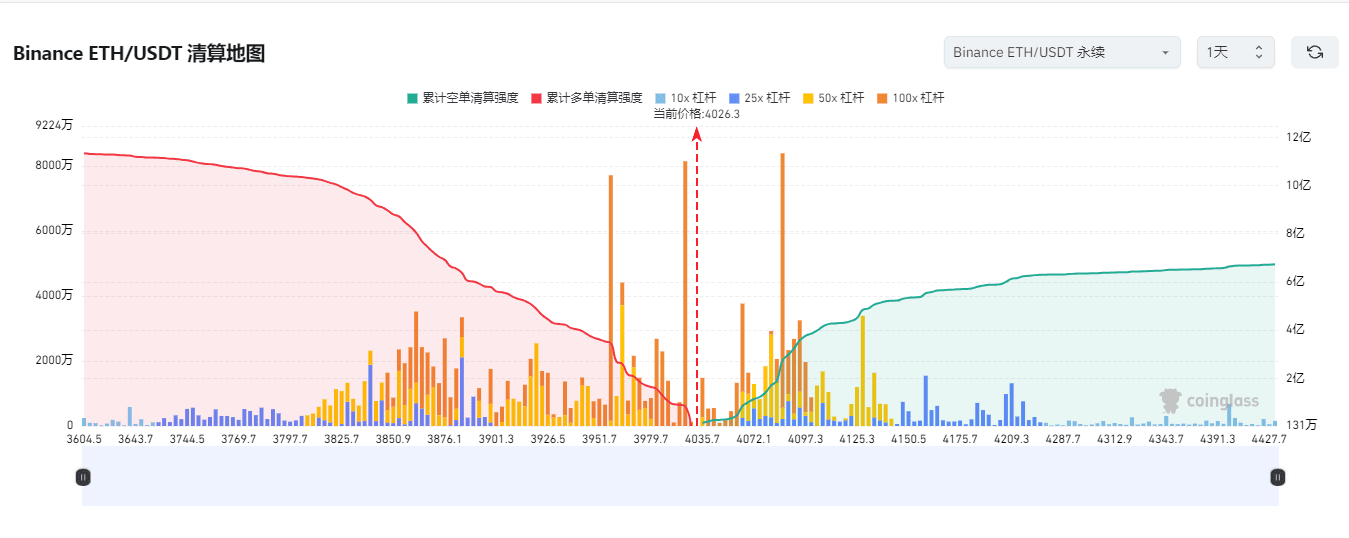
3. Decreasing trading volume: Weak upward momentum
From the perspective of trading volume, the trading volume in the area above $4000 for ETH has significantly decreased and has not expanded alongside the price increase. This indicates that the current rise is driven more by short-term speculative funds rather than sustained inflows from large capital. Volume-price divergence is a typical technical pullback signal, and around $4050 may be a bull trap.
4. Market sentiment and macro background
Overall market sentiment in the cryptocurrency market is overheated, but the external macro environment (such as expectations of Federal Reserve interest rate hikes and fluctuations in traditional markets) is exerting pressure on risk assets. ETH, as a high-beta asset, is susceptible to changes in market risk appetite. Once market sentiment shifts to risk aversion, ETH may be the first to pull back.
II. My trading strategy
Based on the above analysis, I have designed the following staggered shorting strategy, which captures pullback opportunities while strictly controlling risk:
Enter with 30% position at $4050, 2x leverage
Logic: $4050 is the core area of the current resistance level, with clear technical divergence signals and a high probability of a short-term pullback. 2x leverage amplifies the profit potential while controlling risk.
Take profit: Initial target price of $3600 (recent support level, Fibonacci 0.382 retracement level), if it breaks down, look for $3300.
Place 30% position at $4250, 2x leverage
Logic: If the price breaks above $4050 and continues to rise, $4250 is a secondary resistance level (historical high extension line). Adding to the short position at this level can further confirm the depletion of bullish momentum.
Take profit: Same as above, $3600 or lower.
Place the last 40% position at $4400, 2x leverage
Logic: $4400 is a psychological barrier and a historical high point. If the price continues to surge to this level, it may be the last frenzy of bulls, presenting a greater short opportunity. Increasing the position by 40% to capture a larger pullback space.
Stop loss: $4500, breaking this level indicates that everything above is wrong, and I will exit immediately.
Take profit: $3600 or $3300, adjusted according to market conditions.