
In the ever-evolving world of crypto trading, price action is far from random. Every move leaves a footprint — a pattern that reflects the constant tug-of-war between buyers and sellers. These patterns are your early-warning system, helping you read the market’s next likely step before it happens.
Master these 9 essential chart patterns and transform your technical analysis into a trader’s superpower.
---
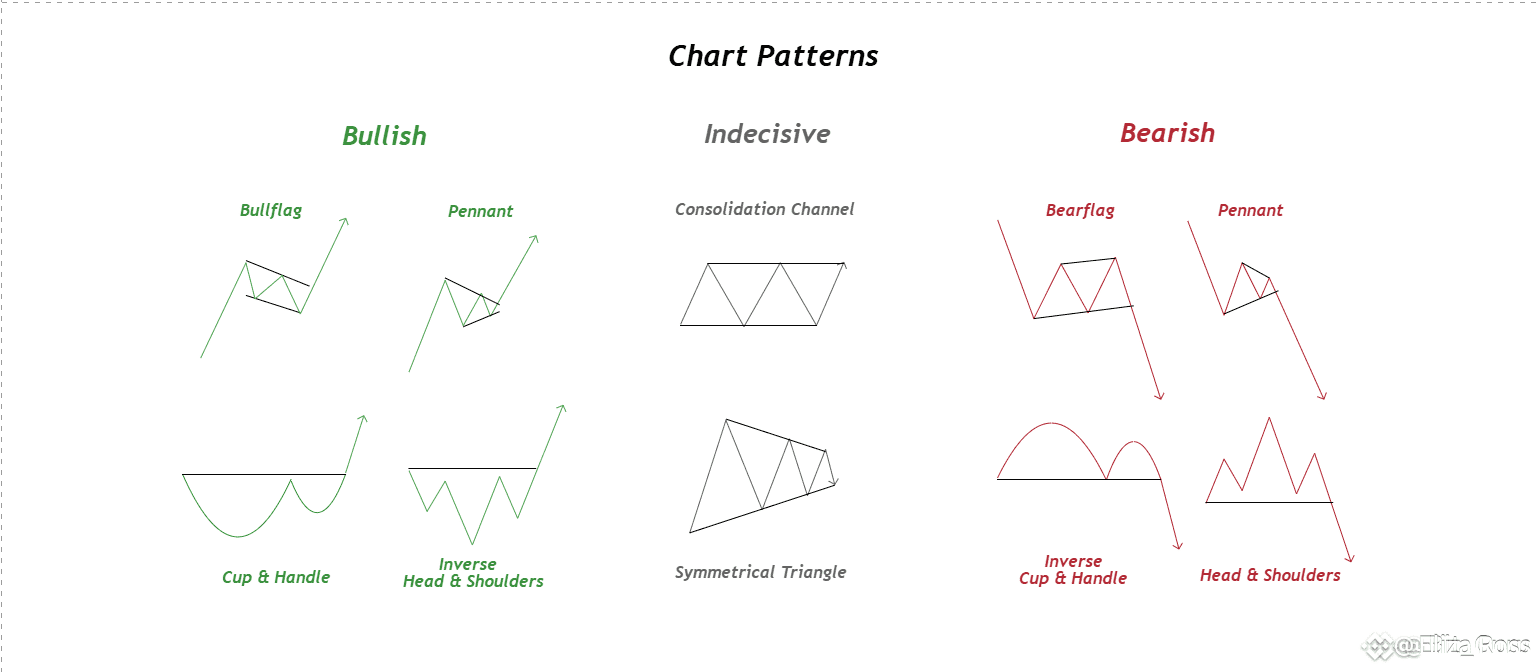
🔼 Bullish Patterns — When the Market Prepares to Climb
These setups suggest increasing buying interest and the potential for upward continuation.
1. Bull Flag
A powerful upward push followed by a short, sloping pullback. This brief pause typically ends with the price resuming its upward surge.
2. Bullish Pennant
After a sharp rally, price action tightens into a mini-triangle. Once it breaks out of this range, the uptrend often accelerates.
3. Cup and Handle
A rounded base (the cup) followed by a shallow dip (the handle). Once price breaks above the resistance level, it signals strength and continuation.
4. Inverse Head & Shoulders
Three dips, with the middle one (the head) being the lowest. A breakout above the neckline confirms a reversal from bearish to bullish sentiment.
---
🤝 Neutral Patterns — When the Market Hits Pause
These patterns reflect indecision. A breakout in either direction is possible, and volume is often the key to spotting the winner.
5. Horizontal Channel (Range)
Price bounces between two horizontal lines. It’s a sign the market is resting and gathering energy for its next significant move.
6. Symmetrical Triangle
Price compresses within converging trendlines, forming a triangle. The breakout direction is uncertain until volume kicks in.
---
🔻 Bearish Patterns — Warning Signs of a Decline
These patterns reveal increasing selling pressure and potential downside movement.
7. Bear Flag
A sharp downward move followed by a slight upward retracement. This often ends with another push lower.
8. Bearish Pennant
Mirroring the bullish version, except it forms after a drop. A breakout below the triangle typically continues the downtrend.
9. Inverse Cup and Handle
A rounded top followed by a minor bounce (the handle). A breakdown from the base often signals a bearish move.
Bonus: Head & Shoulders
Three peaks, with the middle one (the head) being the tallest. A drop below the neckline confirms a shift from bullish to bearish.
---
📈 Why These Patterns Are Game-Changers
Chart patterns are like reading the market’s mood. They offer a visual story of how traders are reacting — showing hesitation, commitment, or exhaustion. When used alongside tools like volume and trend indicators, they can help you:
Spot high-quality trading opportunities
Make smarter entries and exits
Avoid chasing the market or panic-selling
⚠️ Crucial Reminder:
Patterns are probabilities, not guarantees. Never jump in blindly — always wait for confirmation via breakout or breakdown before placing a trade.
---
💡 Pro Tip: Bookmark this guide and use it during your chart analysis sessions. Over time, identifying these patterns will become second nature — and you’ll be steps ahead of traders who rely on gut feeling.
#CryptoIn401(k) #Notcoin #USFedBTCReserve #freesignals #chartpatterns