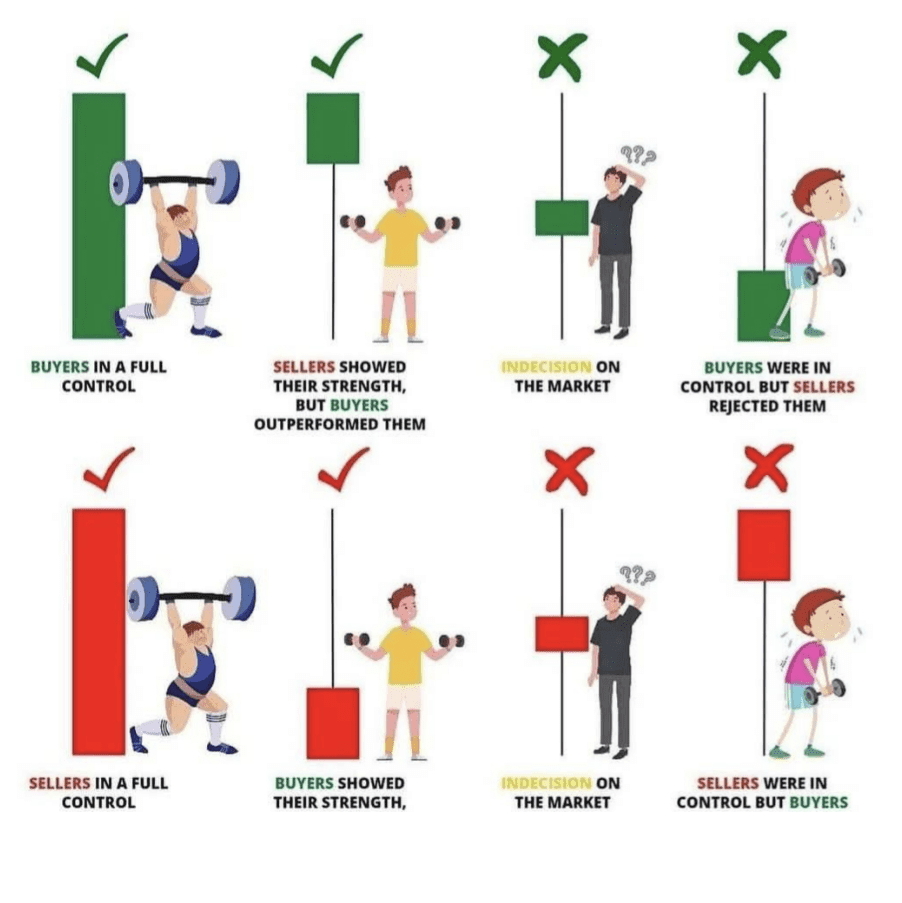
🔹 Top row (from left to right):
1. ✅ Buyers in complete control
🟩 Large green candle - Strong upward momentum, buyers dominated the session.
2. ✅ Sellers showed strength, but buyers outperformed
🟩 Long lower wick - Sellers pushed the price down but buyers recovered and closed at a higher level.
3. ❌ Market indecision
🟫 Doji candle - Equal pressure from buyers and sellers, indicating uncertainty in the market.
4. ✅ Buyers were dominant but sellers rejected them
🟩 Long upper wick - Buyers pushed the price up, but sellers forced the price to close lower.
---
🔹 Bottom row (from left to right):
5. ✅ Sellers in complete control
🟥 Large red candle - Strong downward momentum, sellers dominated the session.
6. ✅ Buyers showed their strength
🟥 Long lower wick - Buyers tried to fight back after sellers pushed the price down.
7. ❌ Market indecision
🟧 Small body candle with wicks - Uncertainty; no clear winner between buyers or sellers.
8. ❌ Sellers were dominant but buyers rejected them
🟥 Long lower wick - Sellers pushed the price down but buyers regained ground before closing.
---
💡 Summary:
✔️ Long candles = clear strength
❌ Doji = indecision
✔️ Wicks = rejection or retracement
This chart helps you read the sentiments behind the candles 🧠🔥
And here is a picture of the candles 👇
E
If you found this post helpful, please follow, like, and comment on it, thank you 👍
#BuiltonSolayer #notcoin #BinanceHODLerPROVE #CFTCCryptoSprint #IPOWave