data and technical analysis, but please note that cryptocurrency markets are highly volatile, and predictions are speculative.
FOLLOW :- @Lachakari_Crypto
Solana Price Today
Based on the latest web sources, the current price of Solana (SOL) as of August 6, 2025, varies slightly across platforms:
• CoinMarketCap: $163.29 USD
• CoinGecko: Approximately $161.50 USD
• CoinCodex: $163.66 USD
• TradingView: $164.37 USD
• Changelly: $167.21 USD
• Binance: $192.82 USD (noted as a higher outlier)
The average price across these sources is approximately $162–$167 USD, with some variation due to exchange differences and market fluctuations. The 24-hour trading volume is significant, reported at $4.77B–$14.1B, indicating active trading. However, SOL has seen a recent decline, with a -2.35% to -9.5% drop in the last 24 hours and a -6.56% to -10.15% drop over the past week.
Price Prediction for Today (August 6, 2025)
Based on technical analysis and short-term forecasts from the provided sources:
• 30rates.com predicts Solana’s price today at $201 USD, with a maximum of $215 and a minimum of $187. This is notably higher than current prices, suggesting potential bullish momentum if buying pressure increases.
• CoinLore forecasts a price range for the next 24 hours between $159.45 and $165.02, aligning more closely with current levels but indicating a possible slight recovery. ❤️🩹
• TradingView notes Solana testing a key support zone around $157–$160, with potential for a bullish bounce if it holds. Resistance is identified at $166–$168, and a break above could target $172–$185.
• X Posts suggest short-term bullish sentiment, with some traders targeting $169.18 based on a bullish pennant pattern on the 15-minute chart, while others note resistance at $190.
Synthesis: Given the current price range of $162–$167 and technical indicators, Solana is likely to trade between $160 and $170 today. A bullish scenario could see SOL testing $166–$168 if it breaks above the 50-day EMA ($166.79). However, if it fails to hold the $160–$162 support zone, it could slide toward $150–$157. The Fear & Greed Index is at 60 (Greed) or 54 (Neutral), indicating mixed sentiment but not extreme fear, which could support a potential recovery today.
Factors Influencing Today’s Price
• Technical Indicators: The 50-day moving average is rising on shorter timeframes (e.g., 4-hour chart), suggesting short-term bullishness, but the 200-day moving average is declining, indicating longer-term weakness. The RSI is oversold at 25.59 on the daily chart, hinting at a possible bounce.
• Market Sentiment: Posts on X show cautious optimism, with traders eyeing support at $157–$160 and resistance at $166–$190. Institutional interest and Solana’s DeFi/NFT adoption remain strong, but recent network concerns and broader market volatility (e.g., Bitcoin’s influence) could cap upside.
• Recent Performance: Solana’s 30-day performance shows 16–17 green days out of 30 with 7.66–8.04% volatility, suggesting potential for short-term gains but with risk of pullbacks.
Chart: Solana Price Trend and Prediction
Below is a chart based on recent price data and short-term predictions. It shows Solana’s price movement over the past week, with today’s predicted range. The chart uses a line type to reflect daily closing prices and highlights key support/resistance levels.
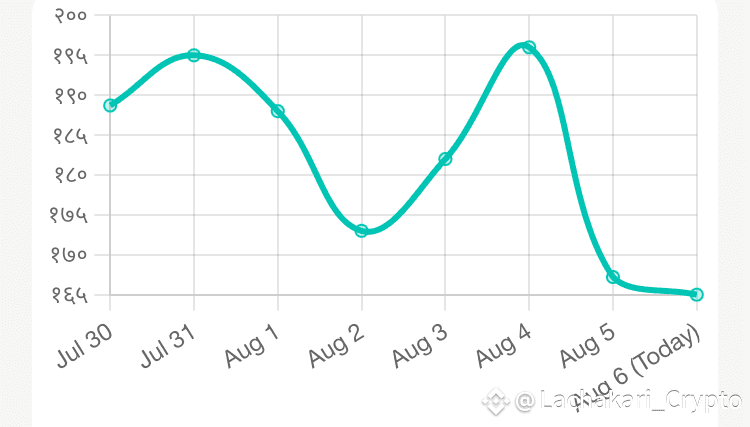
Chart Explanation:
• The line chart shows Solana’s daily closing prices from July 30 to August 5, 2025, based on data from 30rates.com and Changelly.
• Today’s predicted range ($160–$170) is marked as a dashed line, reflecting the short-term forecast.
• Key support at $160 and resistance at $168 are annotated, aligning with technical analysis from TradingView and CoinLore.
• The chart uses a teal color (#00C4B4) for the price trend and red (#FF6B6B) for the predicted range, ensuring visibility on both light and dark themes.
Disclaimer
Cryptocurrency prices are highly volatile, and predictions are not guarantees. Always conduct your own research (DYOR) before making investment decisions, as markets can be influenced by unforeseen factors like regulatory changes or network issues. The chart and prediction are based on historical data and current sentiment, not real-time market feeds.
If you’d like me to adjust the chart (e.g., different timeframe, chart type, or additional indicators) or provide a deeper analysis of specific technical indicators, please let me know!
