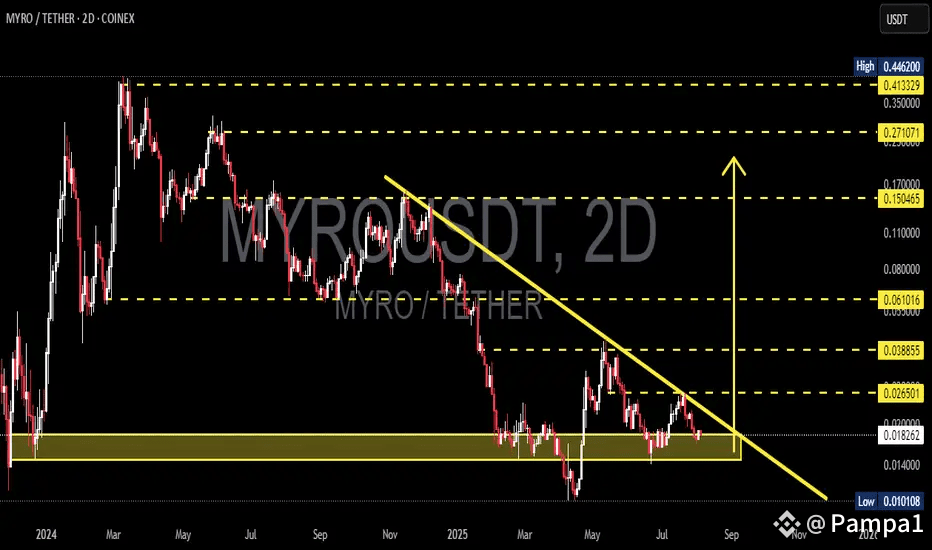
The MYRO/USDT chart is on the edge and traders are watching with intense anticipation! After a steady downtrend, MYRO has entered a powerful consolidation phase, parking itself at a fiercely-defended support zone between $0.014 and $0.018. This level has acted as a base for accumulation multiple times in 2024–2025, making it a high-stakes battleground for the next breakout or breakdown.
What’s the setup? A textbook descending triangle pattern is taking shape, with a stubborn trendline pressing down since November 2024. Bulls are fighting to hold the line, but sellers still have the upper hand—at least, for now.
Bulls need to see MYRO pop above that descending trendline on strong volume, turning the tables and targeting key resistance points: $0.0265, $0.0388, and the psychological $0.0610 level. That kind of breakout would spark FOMO and bring fresh eyes to this underdog altcoin.
But beware: if the current support level cracks and dips below $0.018, the chart opens the trap door toward $0.014 and possibly down to new all-time lows at $0.0101. Weak bounces and surging sell volume would spell trouble, signaling bears remain in charge.
Bottom line—MYRO/USDT is at a make-or-break point. The next move could define market sentiment for weeks. Whether you’re team breakout or breakdown, now’s the time to watch the chart like a hawk. Excitement is building—this is one you don’t want to miss!