Conflux [CFX] has shown strong performance, achieving an extraordinary increase in July. The L1 blockchain native token surged by as much as 297%, rising from a low of $0.07 in July to a high of $0.28.
For bullish CFX traders, the volatility high could be a pain point, as the token immediately retraced to $0.18 on July 29.
The price action over the past ten days resembles consolidation rather than a bullish trend. Therefore, even if the market structure favors buyers, traders should remain cautious of volatility.
AMBCrypto explains the reasons using the symmetrical triangle pattern.
CFX triangle formation and its implications
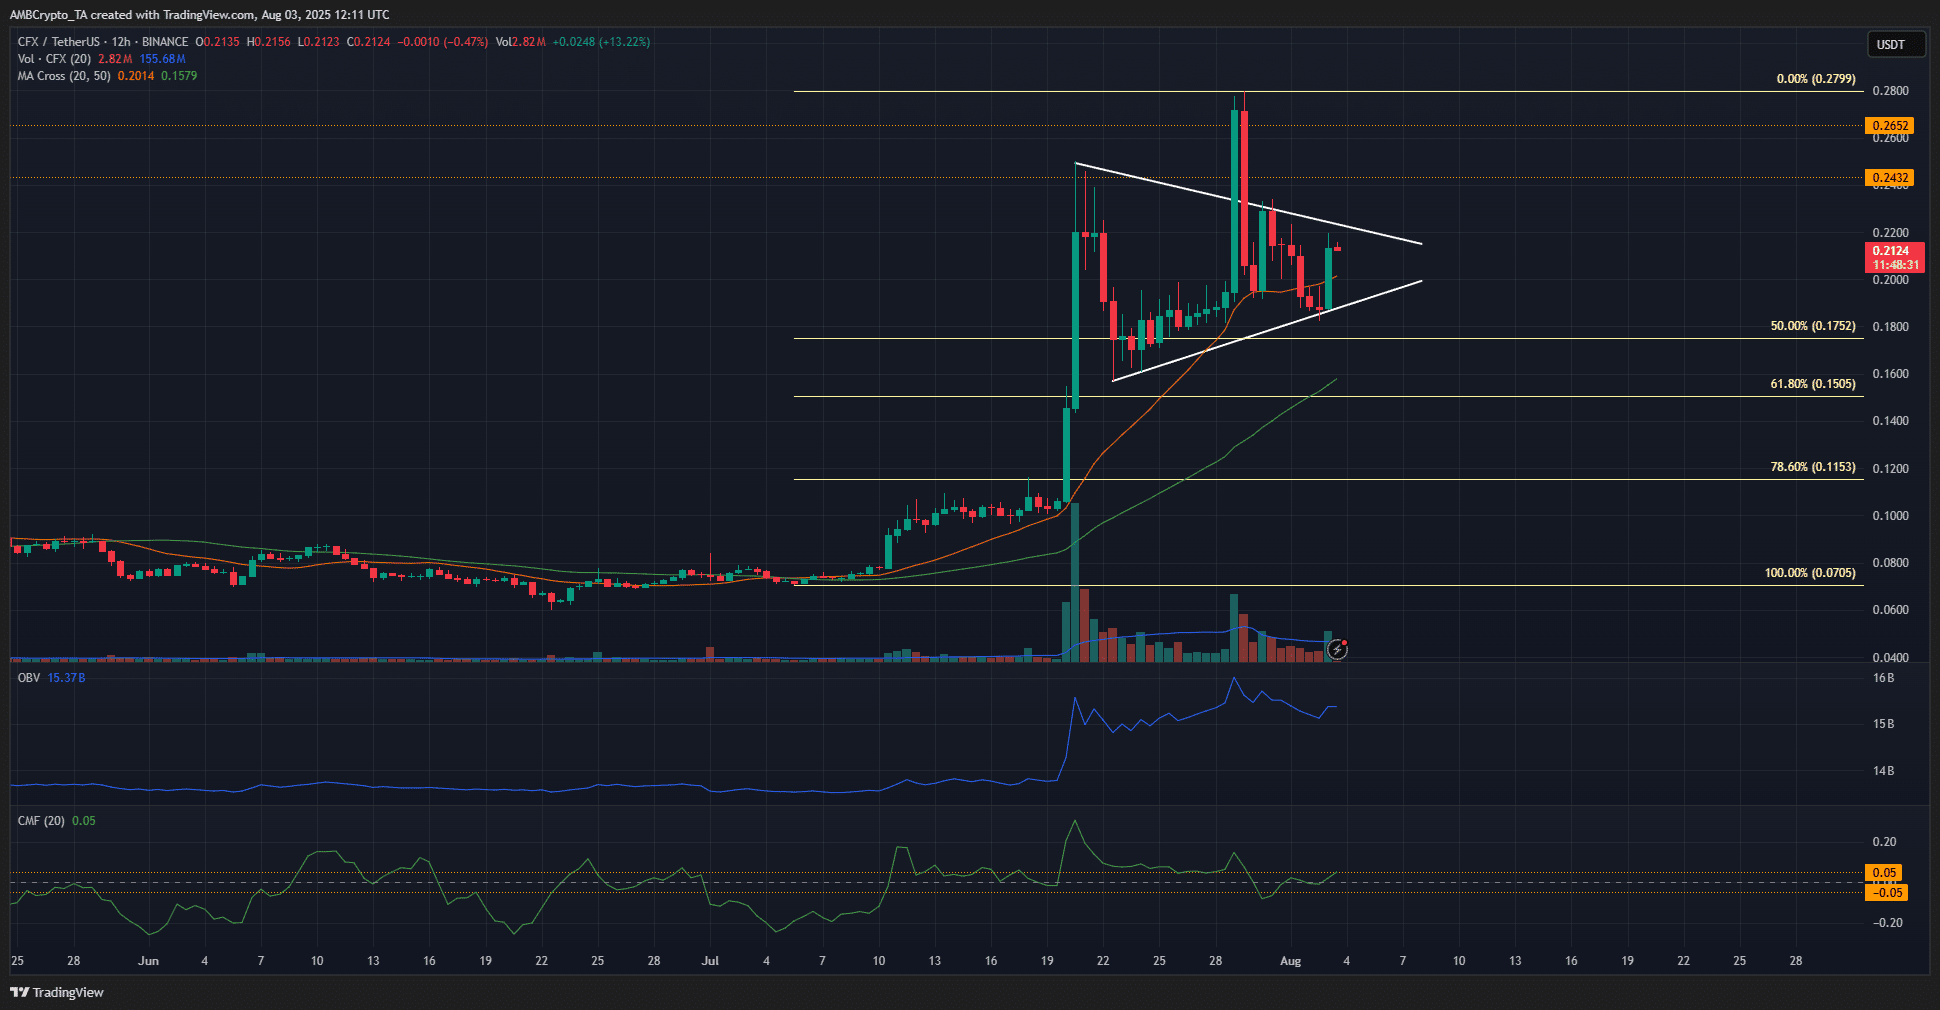 The white triangle formation indicates a decline in volatility. This situation will be accompanied by a rapid price breakout and an increase in trading volume.
Given the strong rise in July, a bullish breakout is likely to occur after this consolidation.
However, there is a small chance that CFX will test the lower trend line, break below it to fake a breakout, and then move higher.
 Traders need not worry too much about dropping to $0.18, which is where the lower trend line is located.
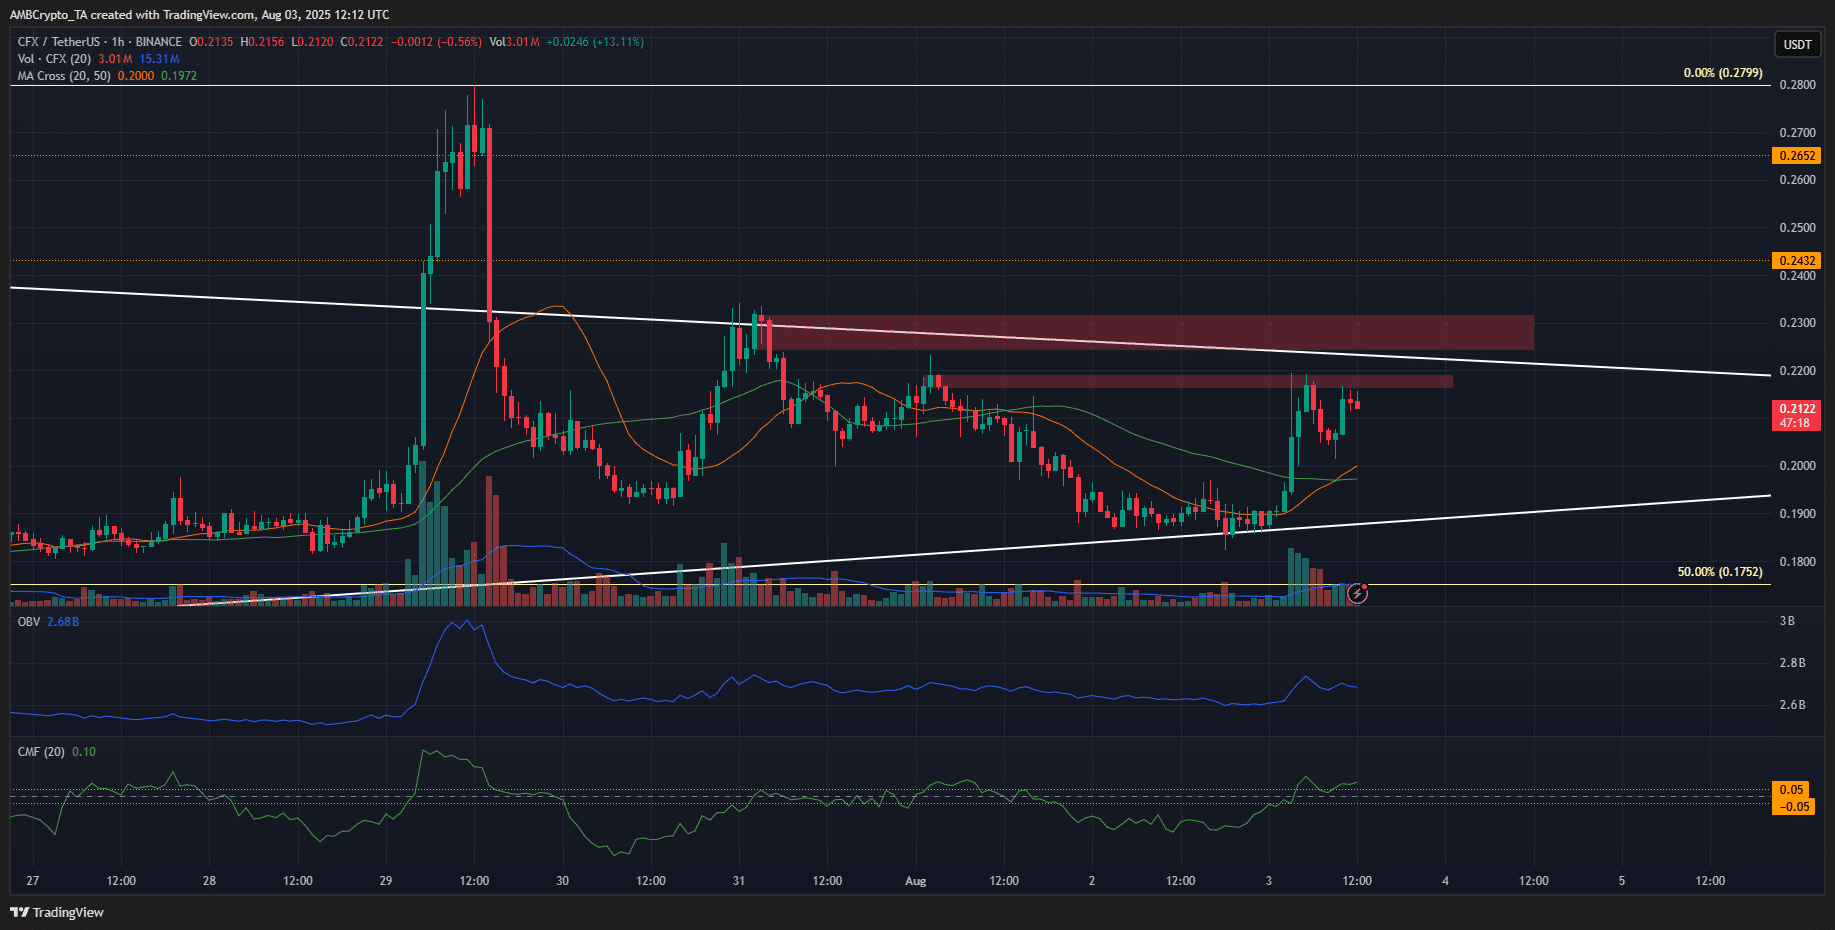
Currently, the resistance levels at $0.218 and $0.23 (marked in red) are key resistance points for Conflux to break through. Once these levels flip to support, swing traders can consider establishing long positions.
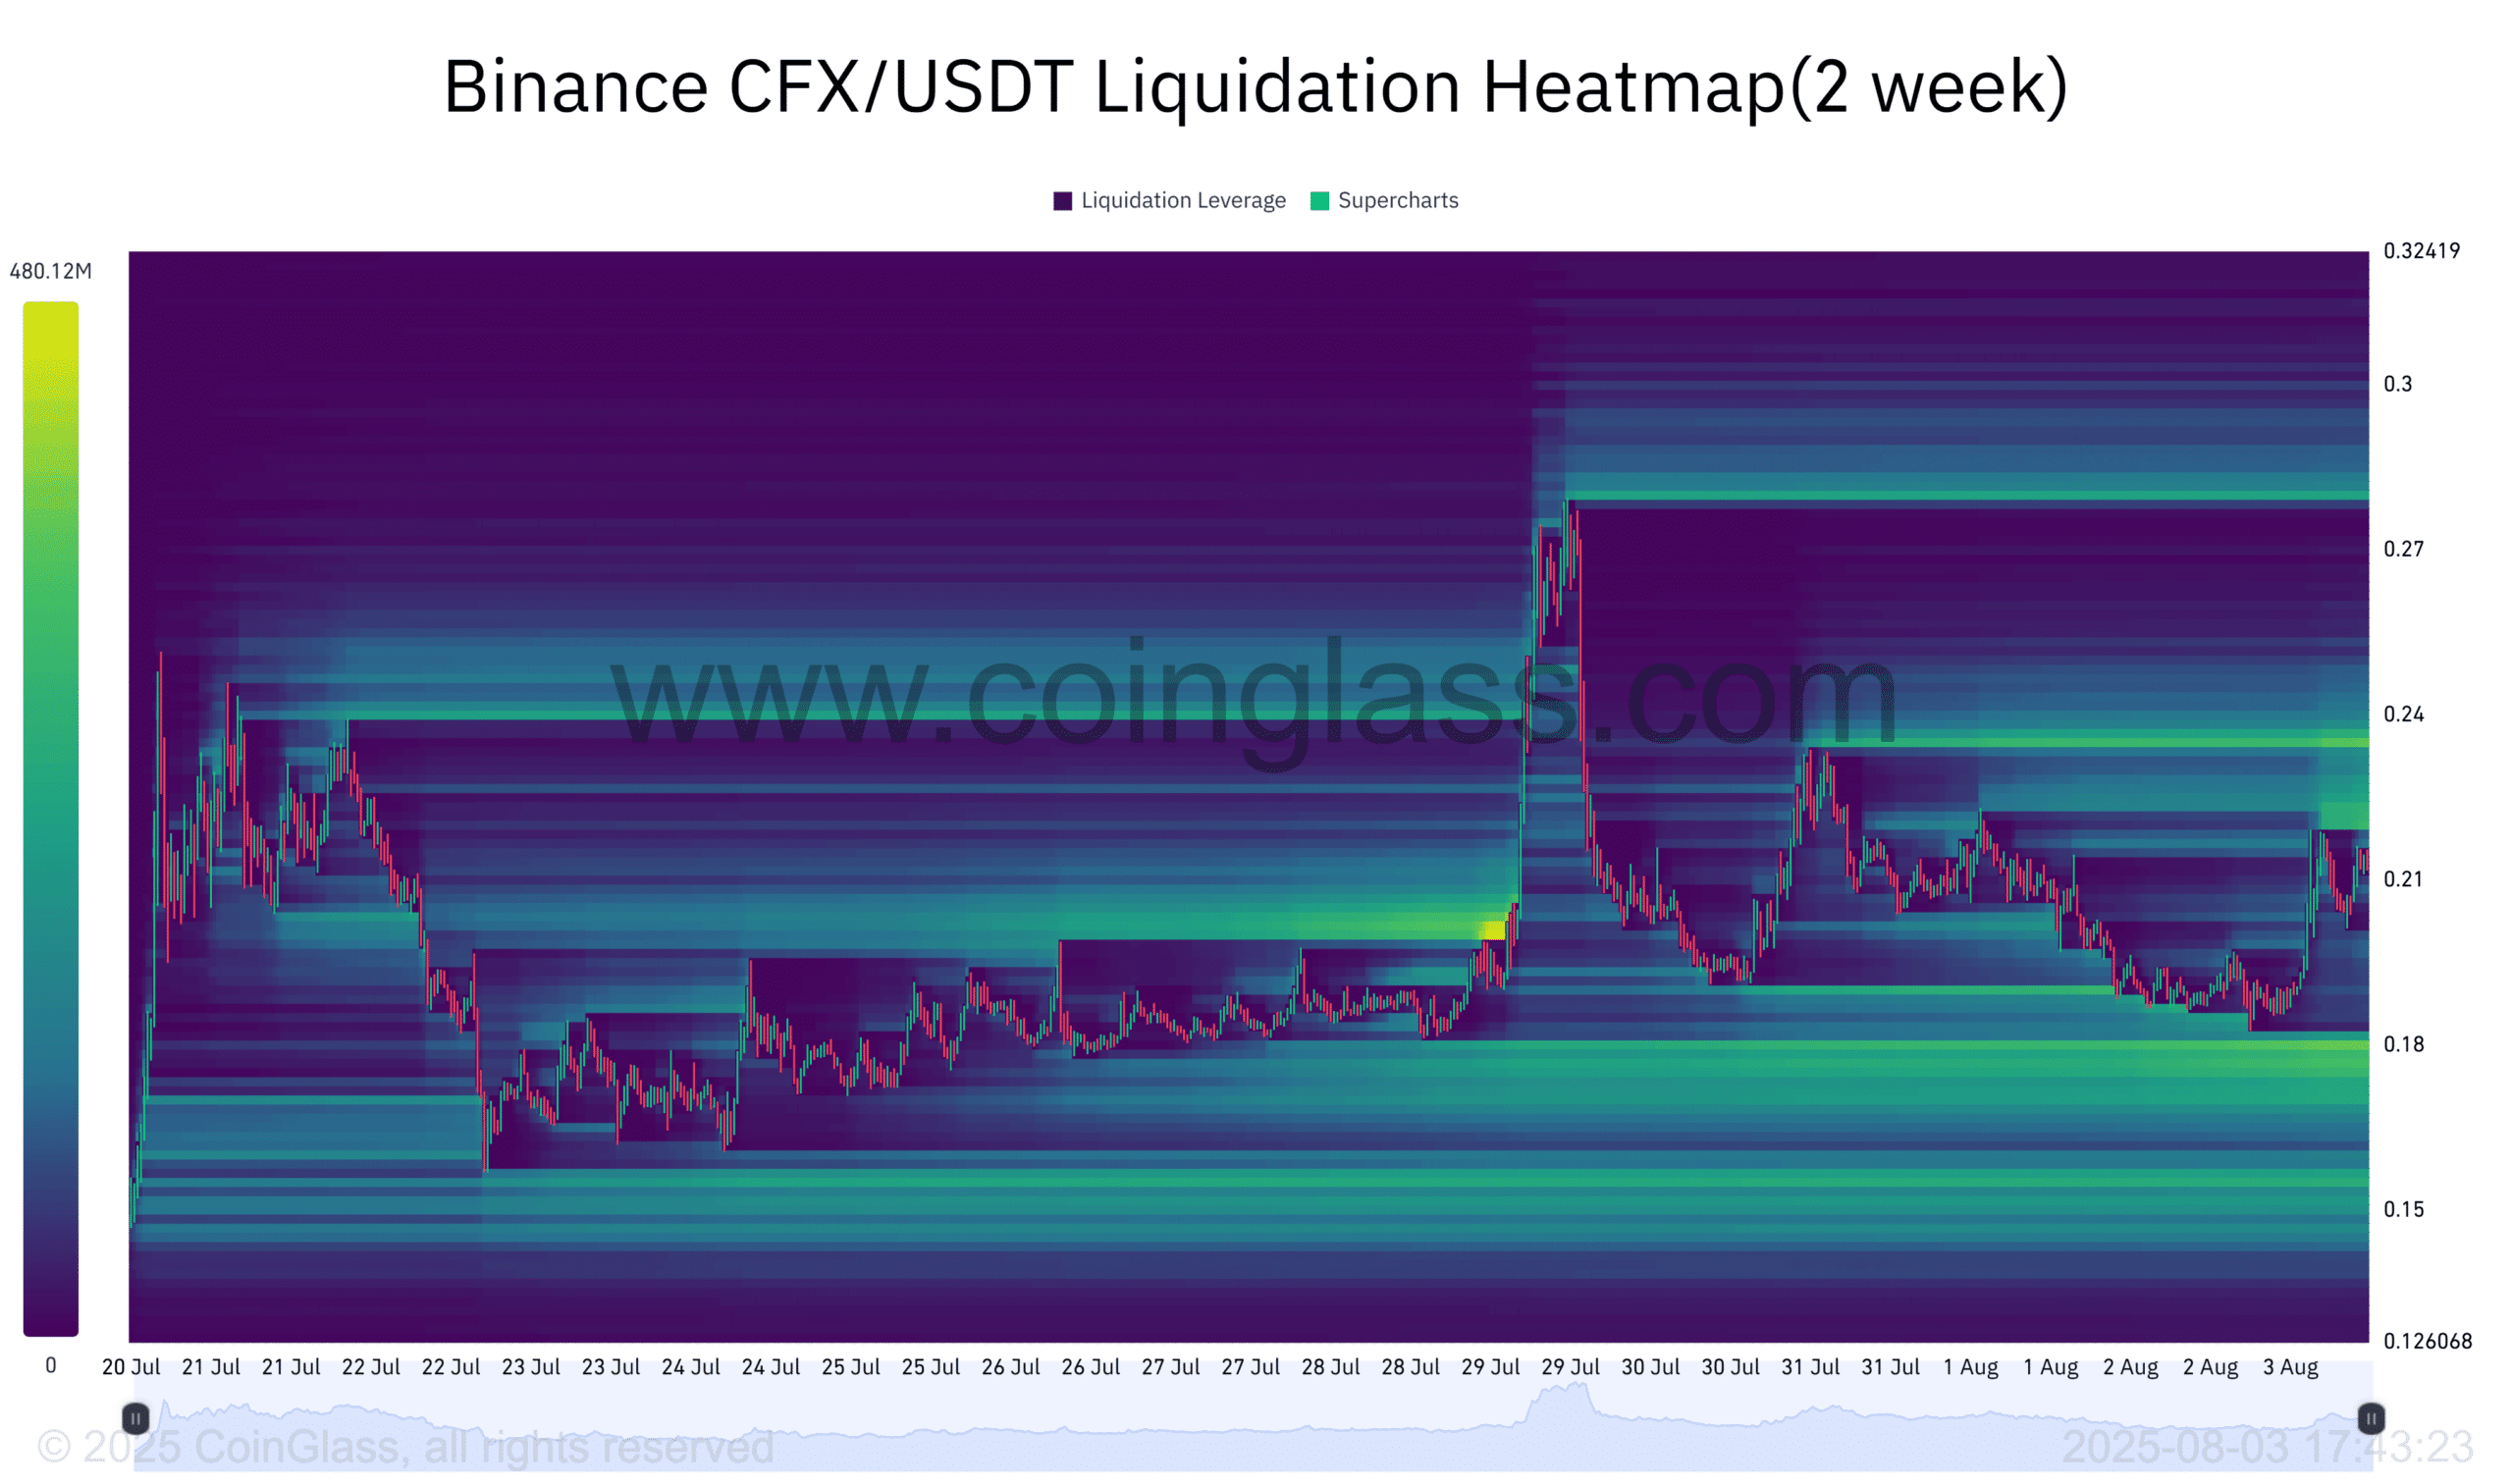 The two-week liquidation heat map shows that the levels of $0.18 and $0.236 are the next key magnetic zones. They perfectly align with the symmetrical triangle formation.
Due to the magnetic zone being very close to the price, it is possible that the price may rise to $0.24 or even higher in the coming days.
