HBAR has fallen below its 20-day EMA, indicating increased short-term selling pressure and bearish momentum. If market sentiment does not improve, it may retest $0.2.
Under bearish momentum, HBAR price has fallen below the 20-day moving average. Explore key insights and potential price targets for the Hedera Hashgraph token.
With bears gaining control, HBAR price has fallen below the 20-day moving average.
HBAR has experienced a significant decline, falling below the 20-day exponential moving average (EMA), which is a key indicator of short-term trend strength. The current trading price is $0.2391, facing resistance at the 20-day EMA of $0.2446. This breakdown indicates increased selling pressure, weakened support, and further downside risk in the short term.
Bearish MACD confirms accelerating downward trend
The Moving Average Convergence Divergence (MACD) indicator supports HBAR's bearish outlook. The MACD line remains below the signal line, while the red histogram continues to expand, indicating that negative momentum is strengthening. This technical formation typically signals that prices will continue to decline, exacerbating the risk of further drops.
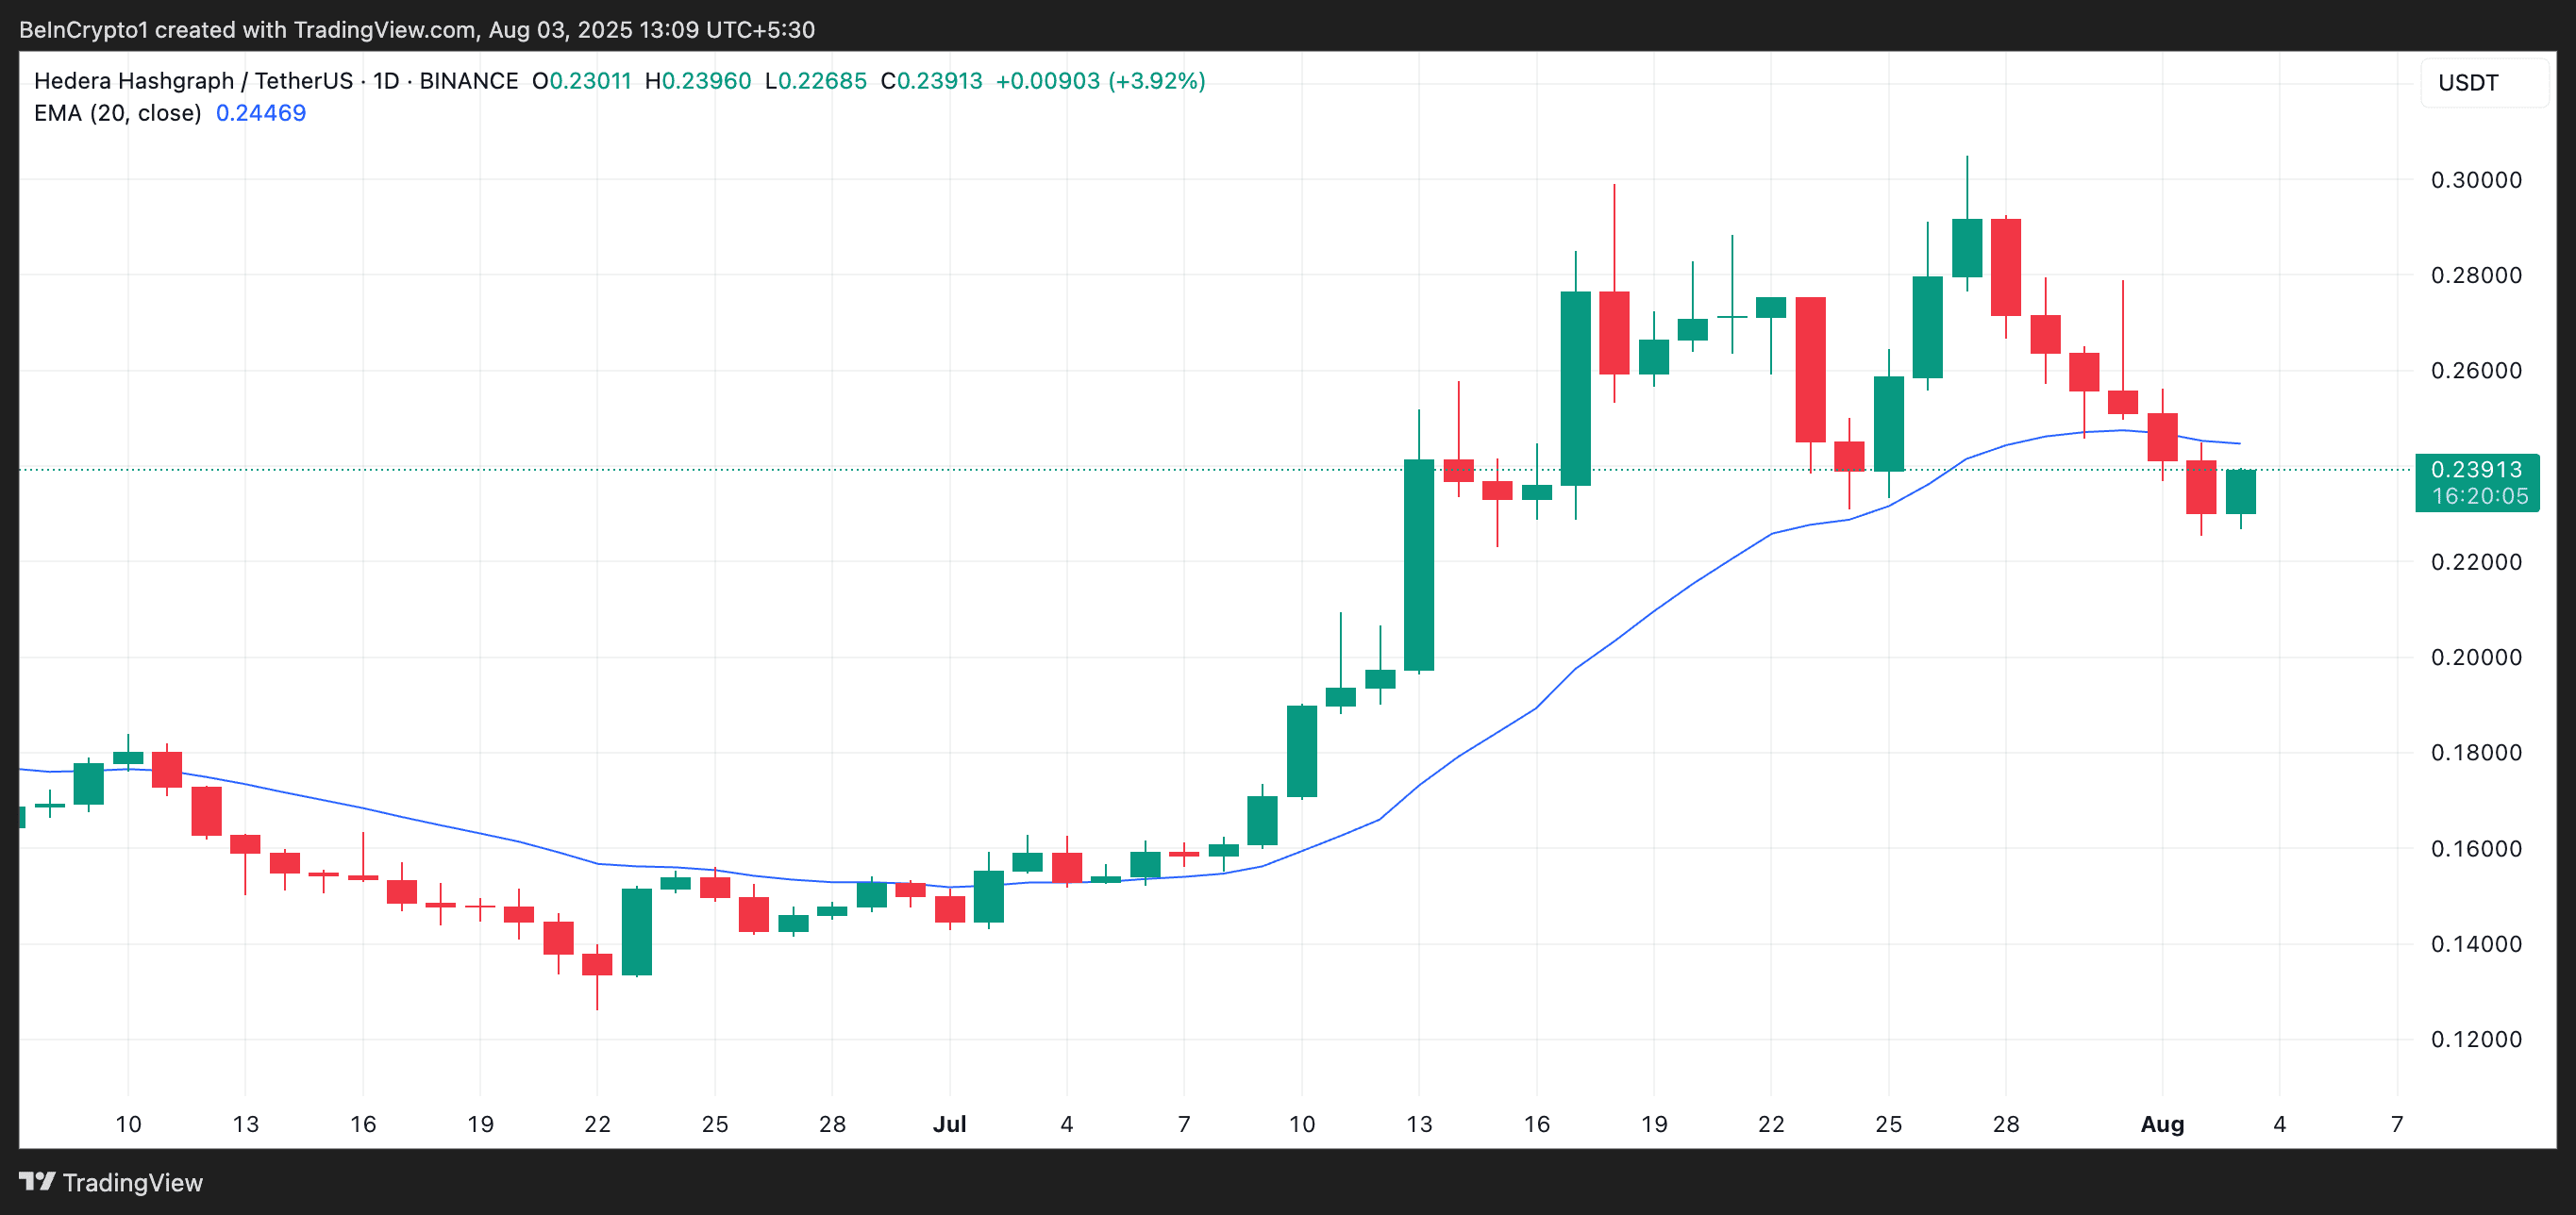
HBAR 20-day EMA. Source: TradingView
The 20-day moving average better reflects recent price trends, making it a reliable indicator of short-term momentum. Sustained prices below this level typically indicate that sellers are in control, increasing the likelihood of continued declines.
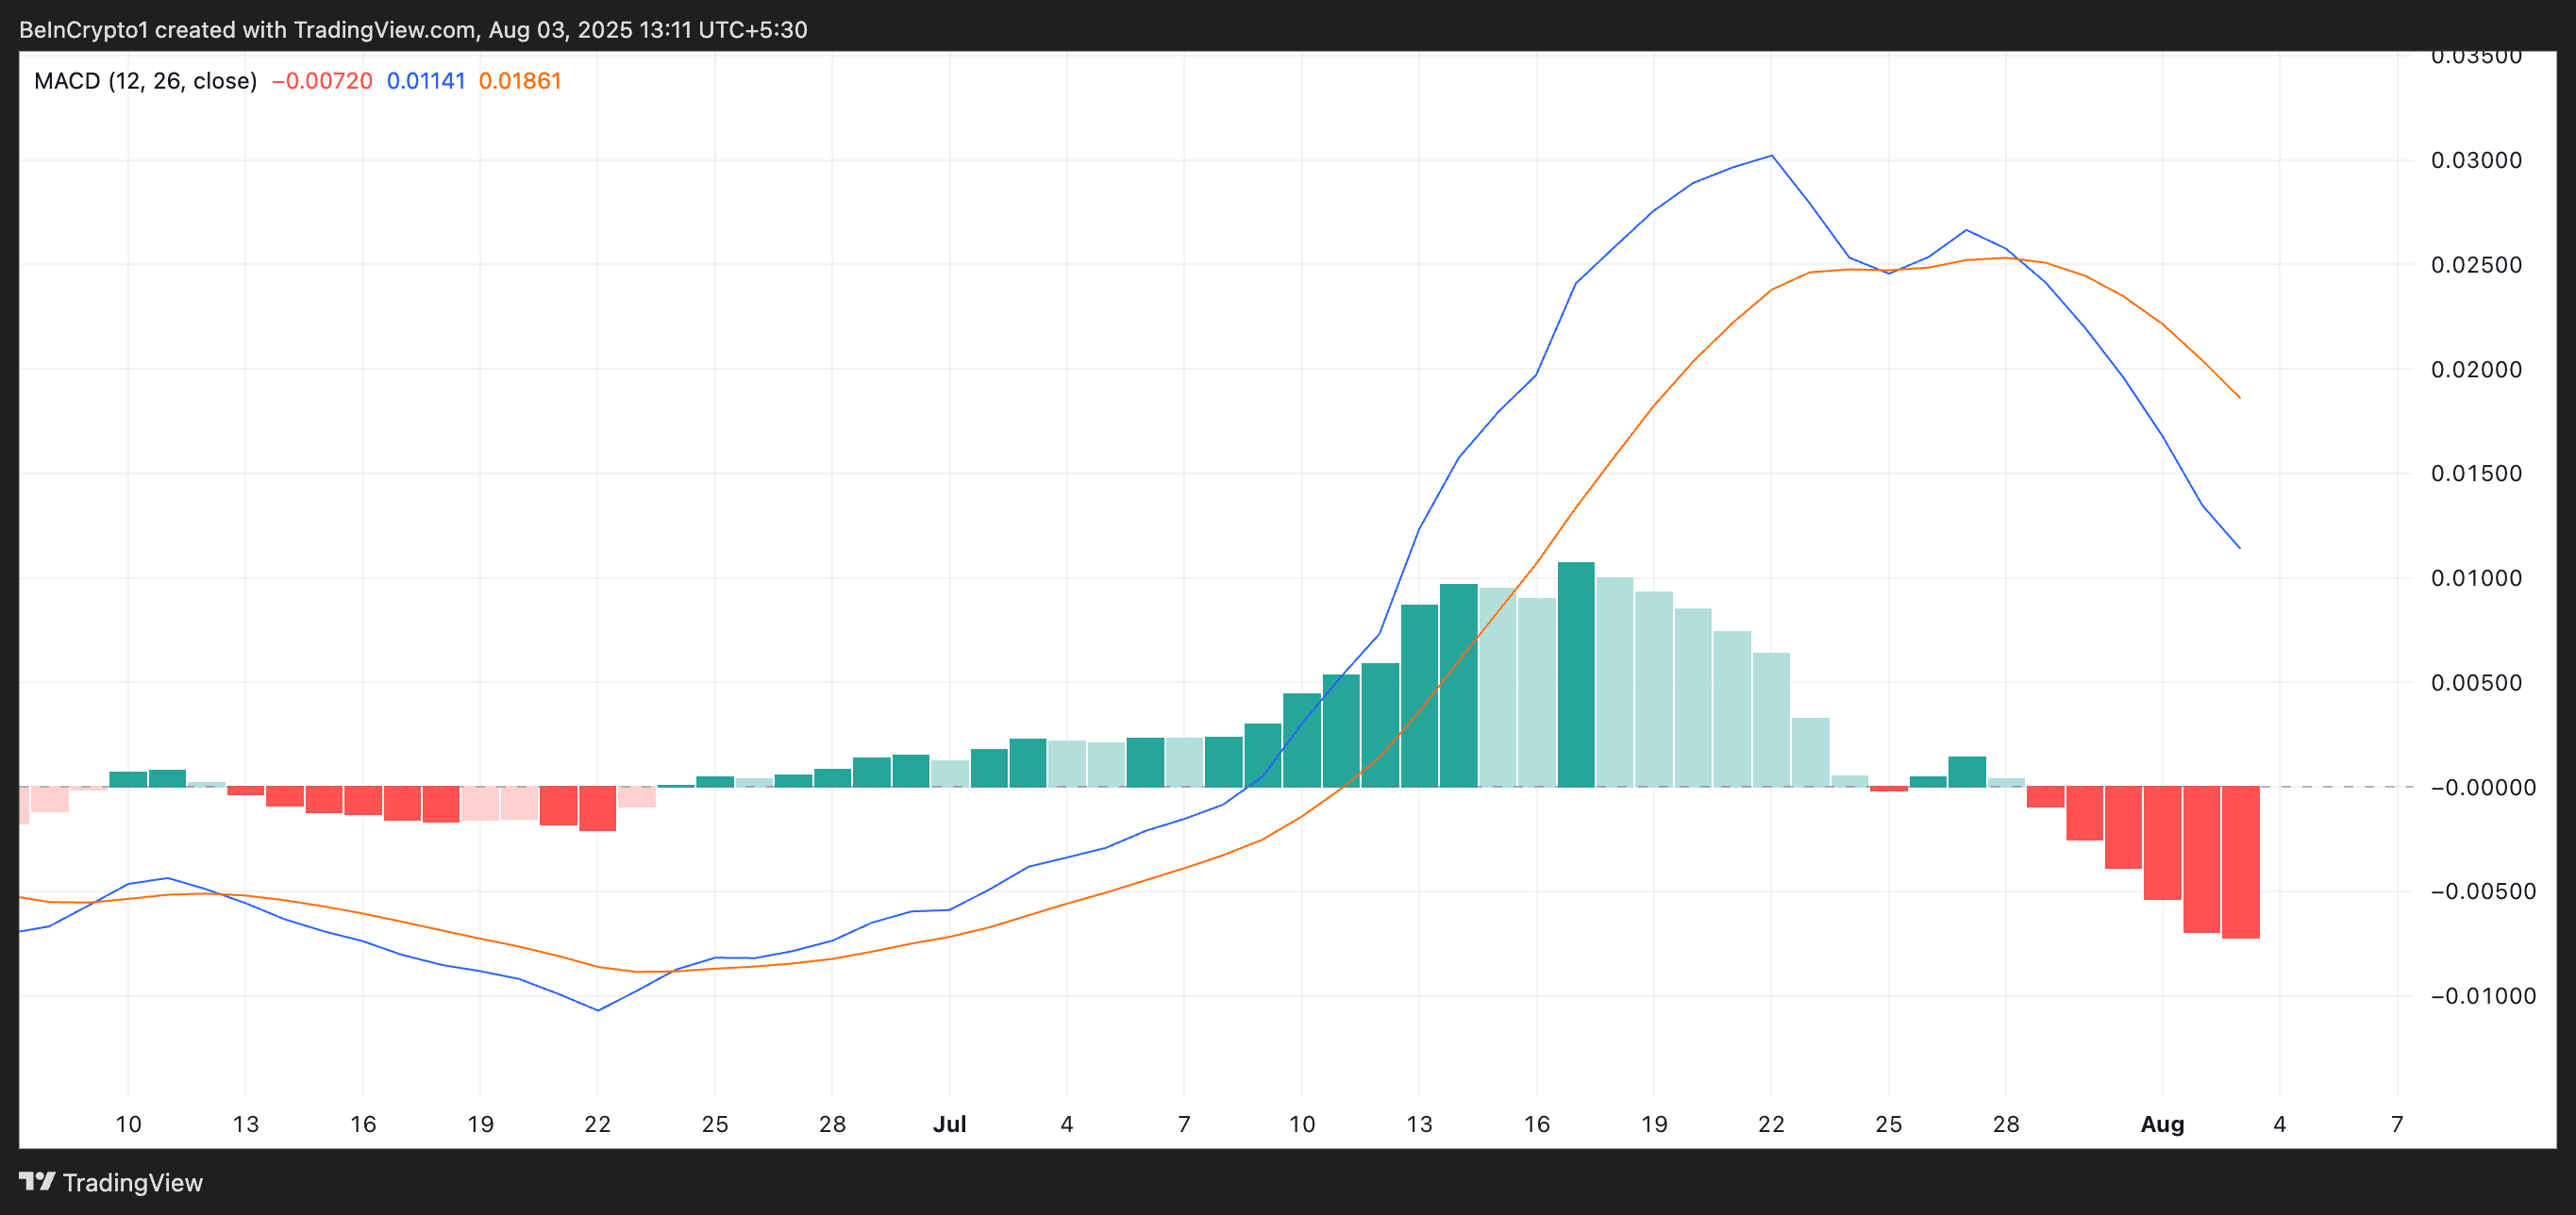
HBAR MACD. Source: TradingView
What factors could drive HBAR's next price movement?
The recent trend of HBAR largely depends on market sentiment. If bearish momentum continues, the token may retest the key support level around $0.2. However, a shift in market sentiment and the formation of strong support levels may allow HBAR to rebound above the 20-day moving average and break through resistance near $0.2609.
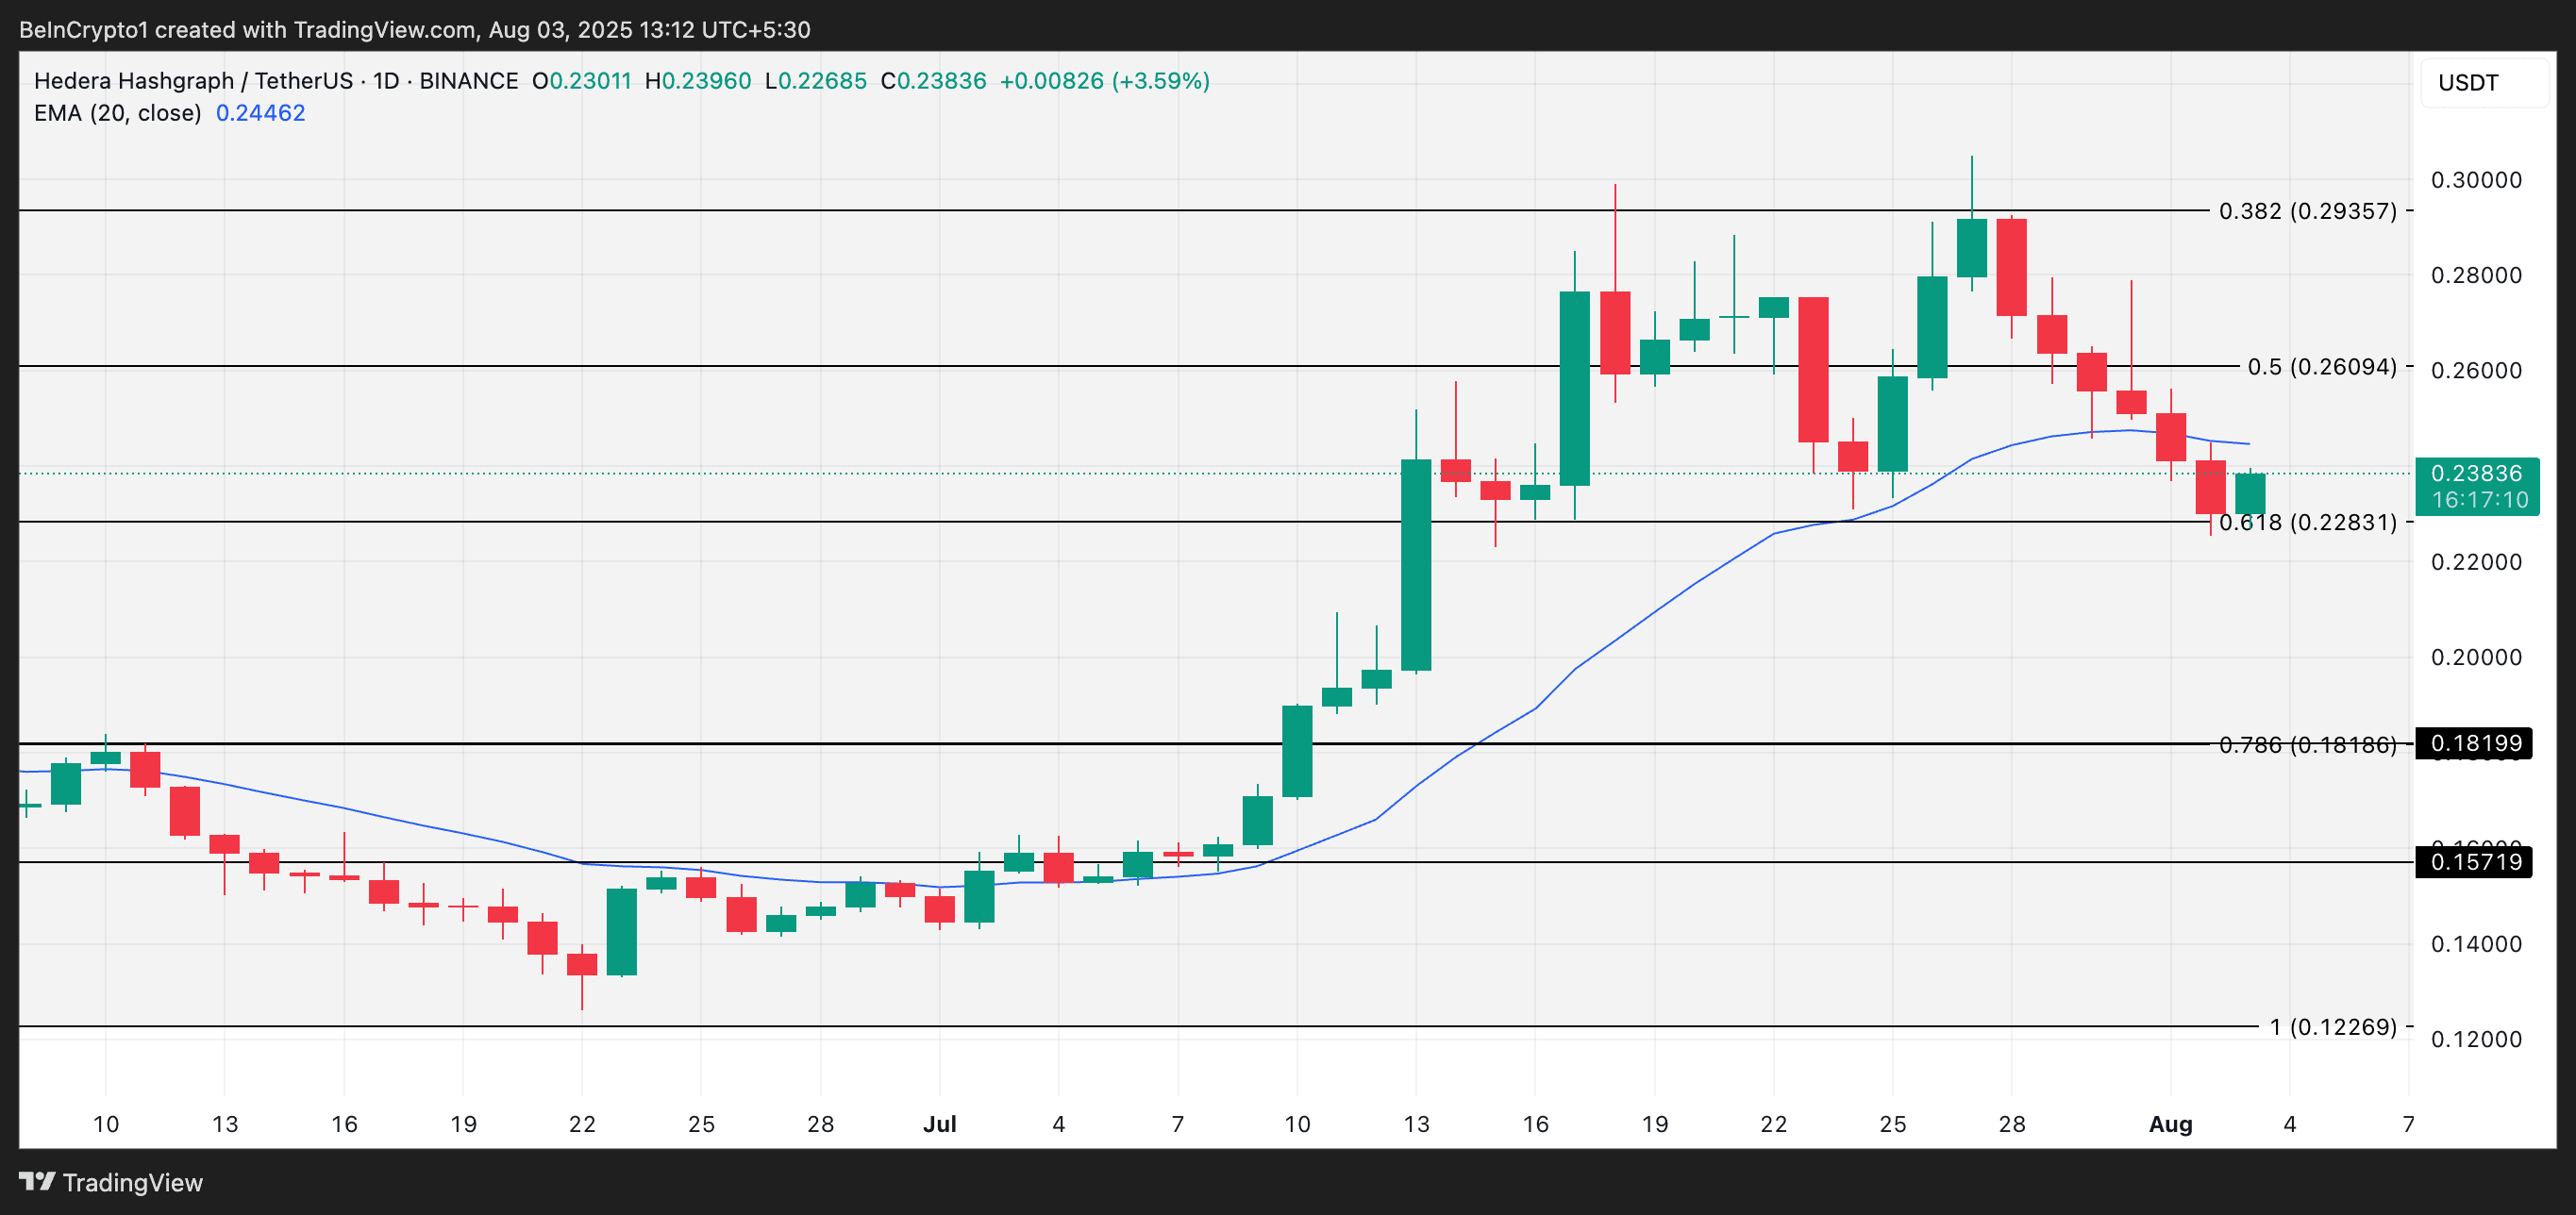
HBAR price analysis. Source: TradingView
How does market sentiment affect HBAR's price?
Market sentiment is crucial for HBAR's price movements. Positive market sentiment can attract buyers, pushing prices above key resistance levels such as the 20-day moving average. Conversely, negative market sentiment increases selling pressure, leading to price declines. Traders should pay attention to both market sentiment indicators and technical signals for a comprehensive view.
Frequently Asked Questions
What does the 20-day EMA mean for HBAR?
The 20-day moving average reflects HBAR's recent price trend, with recent data having a greater impact. Falling below this average indicates short-term bearish momentum and potential further declines.
How does the MACD indicator influence HBAR trading decisions?
The MACD indicator can help traders identify momentum shifts. A bearish crossover (where the MACD line falls below the signal line) indicates that selling pressure is increasing, guiding traders to consider downside risk.
Key Points
HBAR's price has fallen below the 20-day EMA, indicating short-term bearish momentum.
Bearish MACD signals confirm that the token is facing accelerating downward pressure.
Market sentiment will determine whether HBAR retests $0.2 or rebounds above $0.26.
Conclusion
HBAR recently fell below the 20-day moving average, and the MACD indicator is bearish, highlighting increasing short-term selling pressure. Although the token faces downside risk, a positive shift in market sentiment may stabilize prices and trigger a rebound. Investors should closely monitor technical indicators and market sentiment trends to respond to HBAR's changing price patterns.
HBAR has experienced a sharp decline, falling below its 20-day EMA and indicating increased short-term bearish pressure.
Technical indicators such as the MACD confirm that the token's downward momentum is accelerating.
According to COINOTAG analysis, if bearish sentiment persists, HBAR may retest $0.2, but with improving market conditions, there is still a possibility of rebounding above $0.26.
HBAR price analysis shows bearish momentum below the 20-day moving average. Gain insights into the token's outlook for Hedera Hashgraph through COINOTAG's expert insights.

