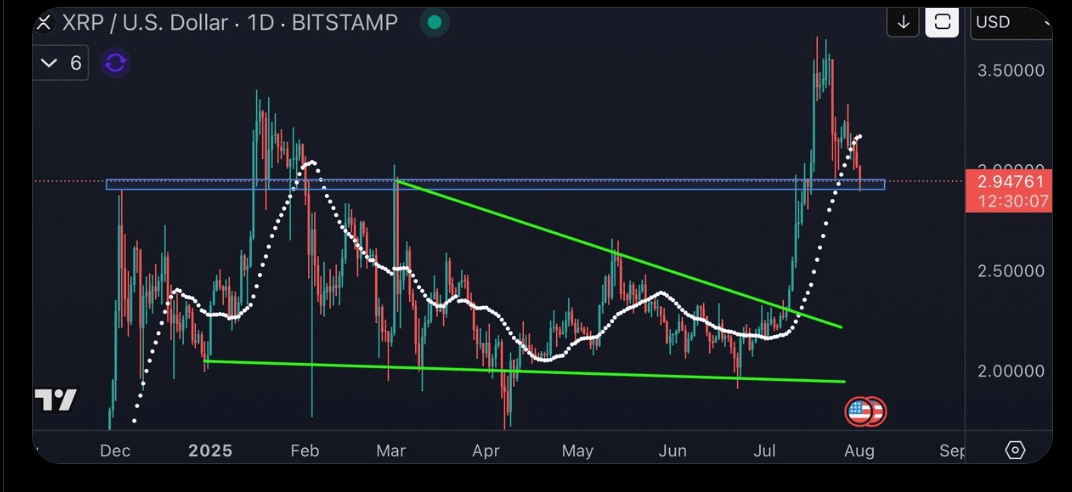
The support zone $XRP $2.80–$2.95 becomes a key battleground, and analysts call it a critically important price level for the next month.
On the XRP charts, at least two classic technical patterns are signaling a bullish reversal.
The $2.80–$2.95 level remains a key support zone, and analysts refer to it as a 'critical' level.
$XRP $2.88 may be preparing for a short-term recovery: there are signs indicating a potential price jump of 20% by the end of August.
Bullish divergence indicates a weakening of selling pressure on XRP.
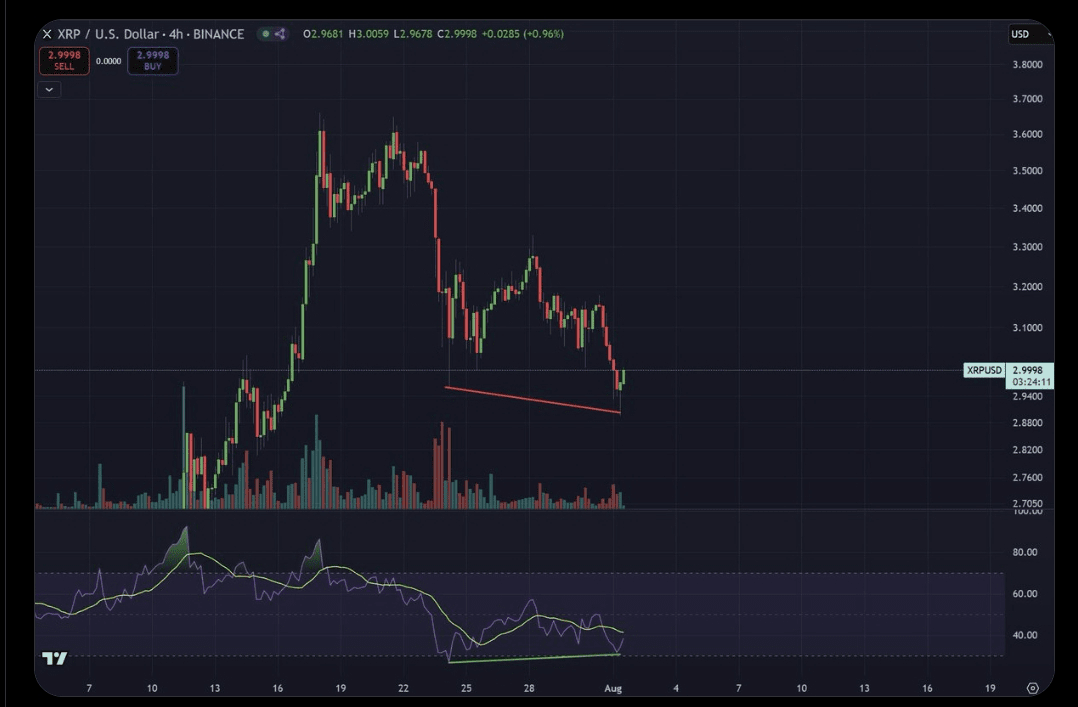
On the four-hour candlestick chart, XRP shows bullish divergence—a common signal often hinting at a potential trend reversal.
In this case, the price $XRP forms lower lows, while the Relative Strength Index (RSI), a momentum indicator, forms higher lows. Such divergence indicates that the recent selling pressure is weakening.
Another bullish signal comes from the daily XRP chart, where the price forms something resembling a 'Dragonfly Doji' candlestick pattern.
This candle has a long lower wick and a small upper shadow or none at all, with opening and closing prices near the top of the candle, indicating that buyers actively entered the market after initial selling pressure.
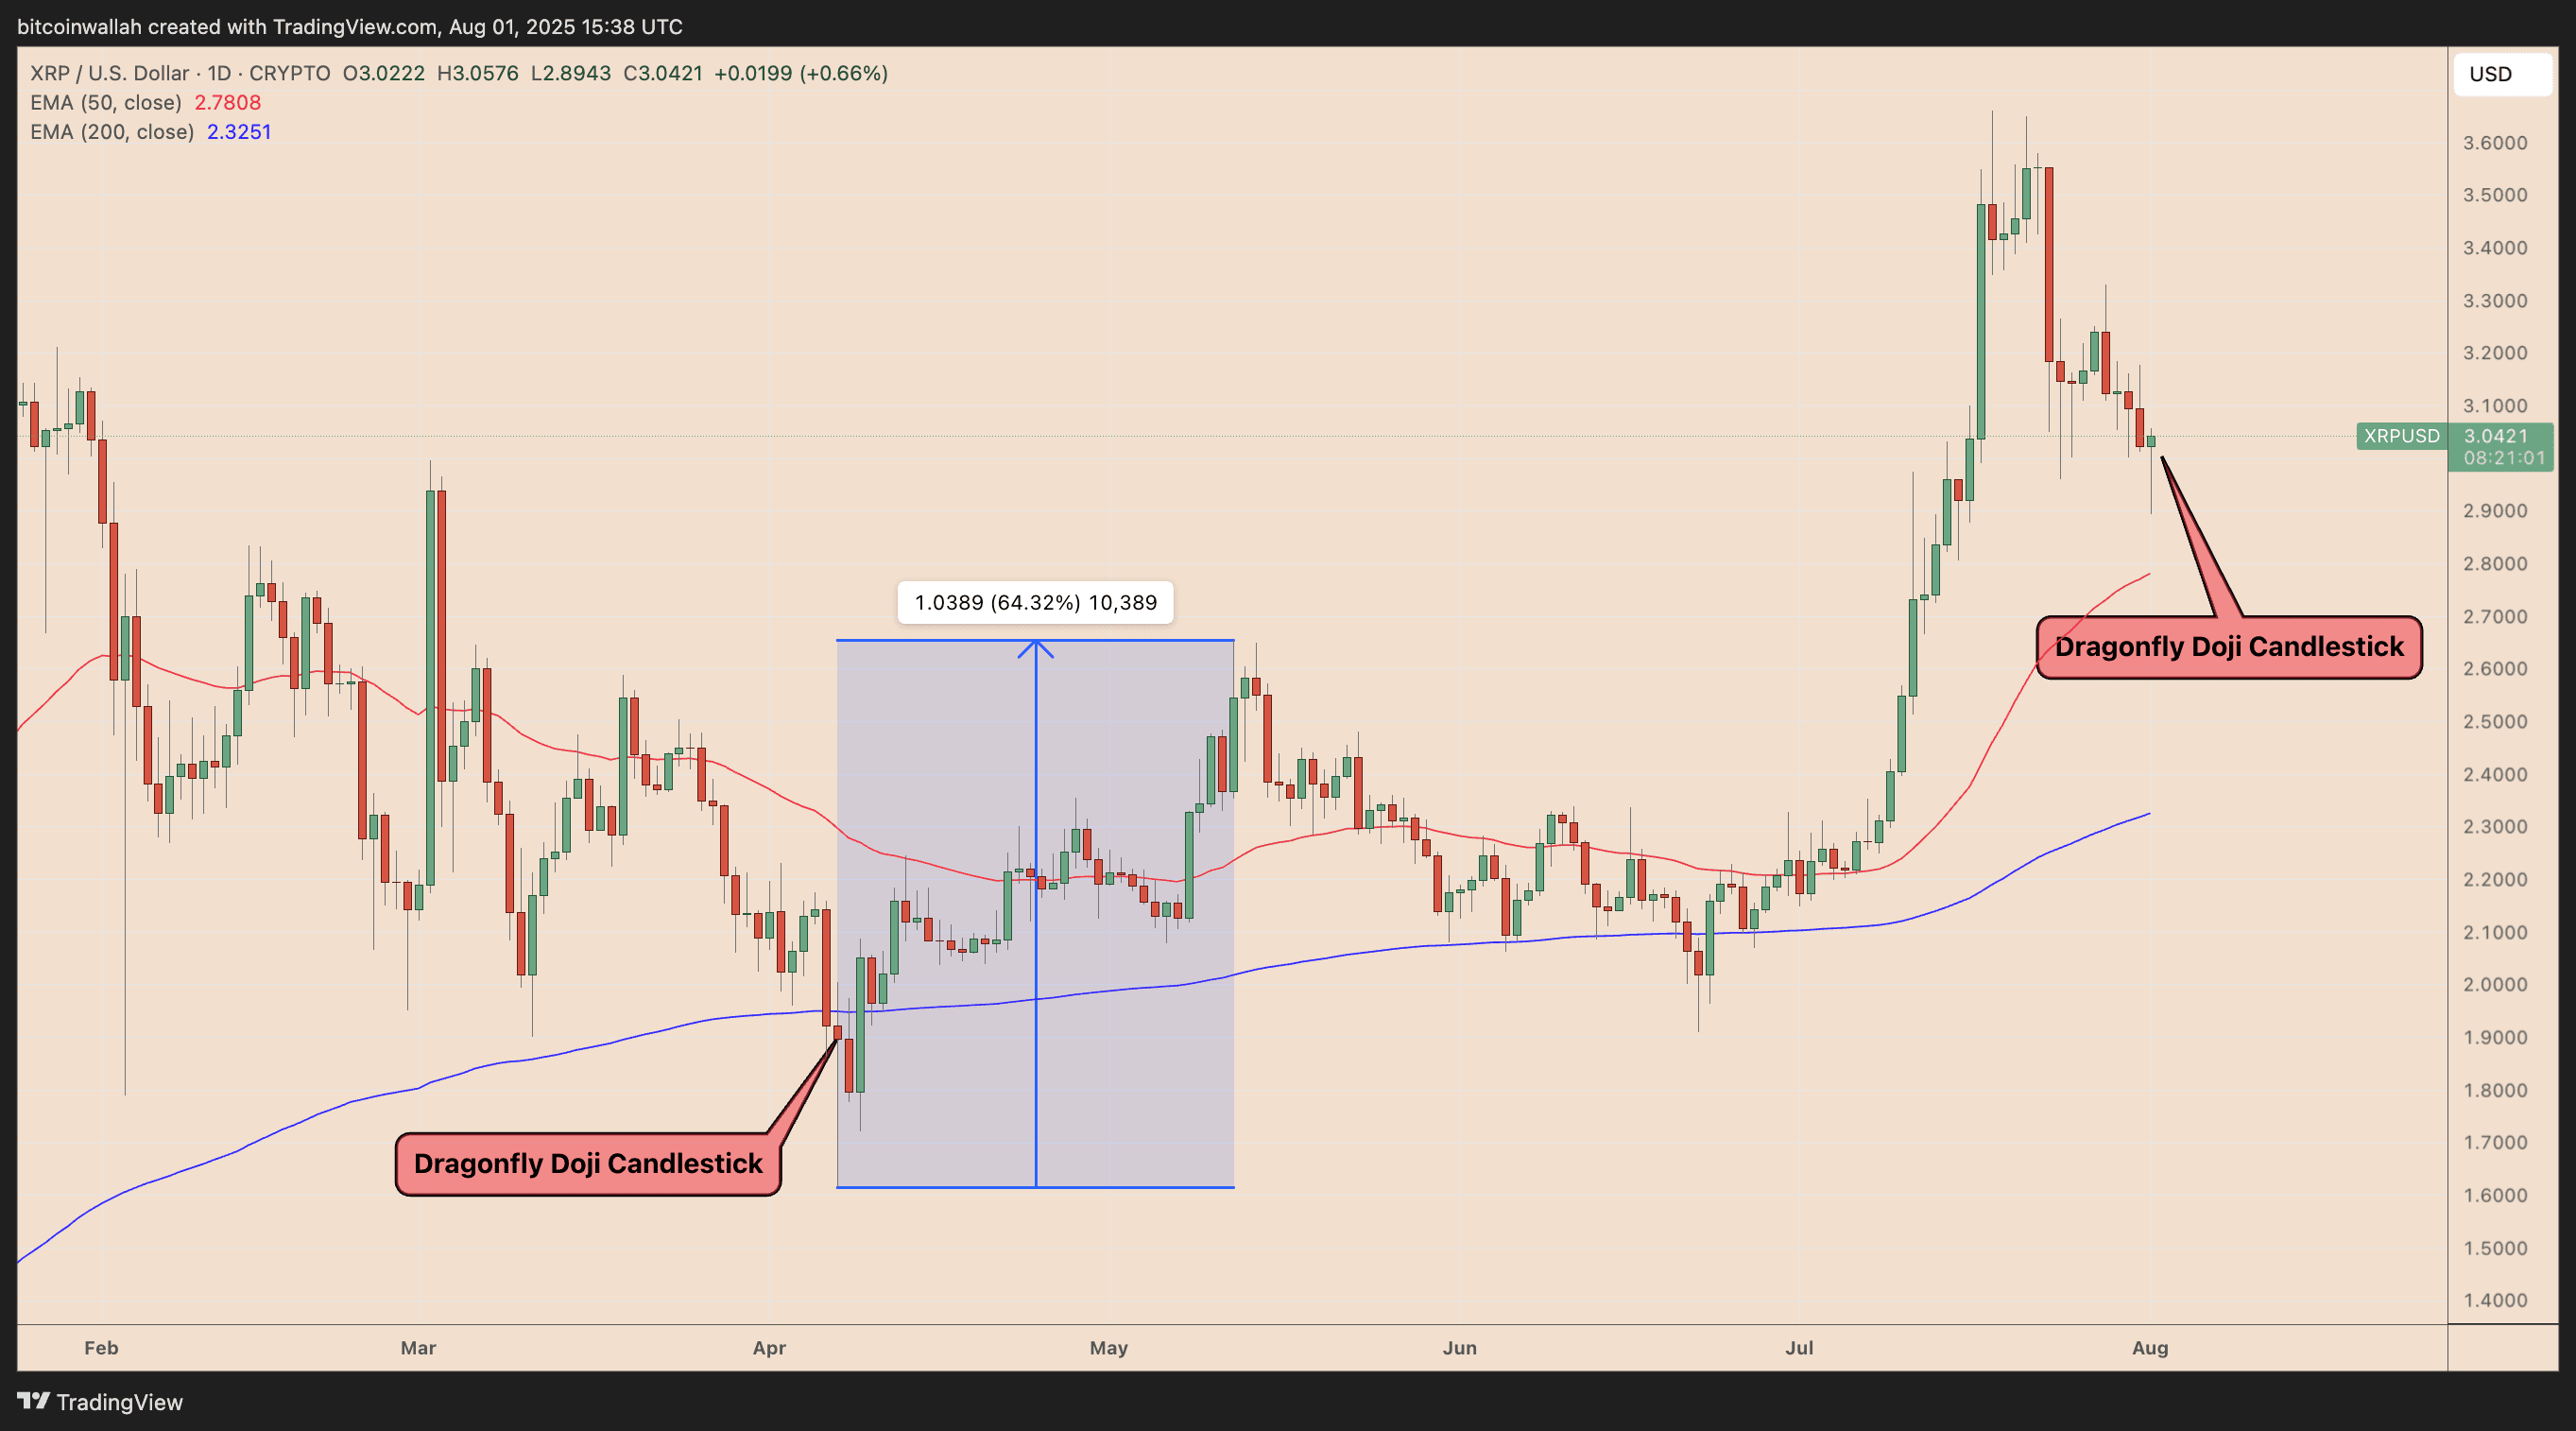
#xpr jumped about 65% after forming a similar Doji candle in April.
Cryptoes analyst expects XRP to maintain its prevailing bullish momentum if the price exceeds the support range of $2.80-2.95, calling it a 'make or break' level.
The price of XRP in the breakout of the descending wedge.
#XPR shows a classic falling wedge pattern on its four-hour chart—a bullish reversal setup that could indicate strong growth.
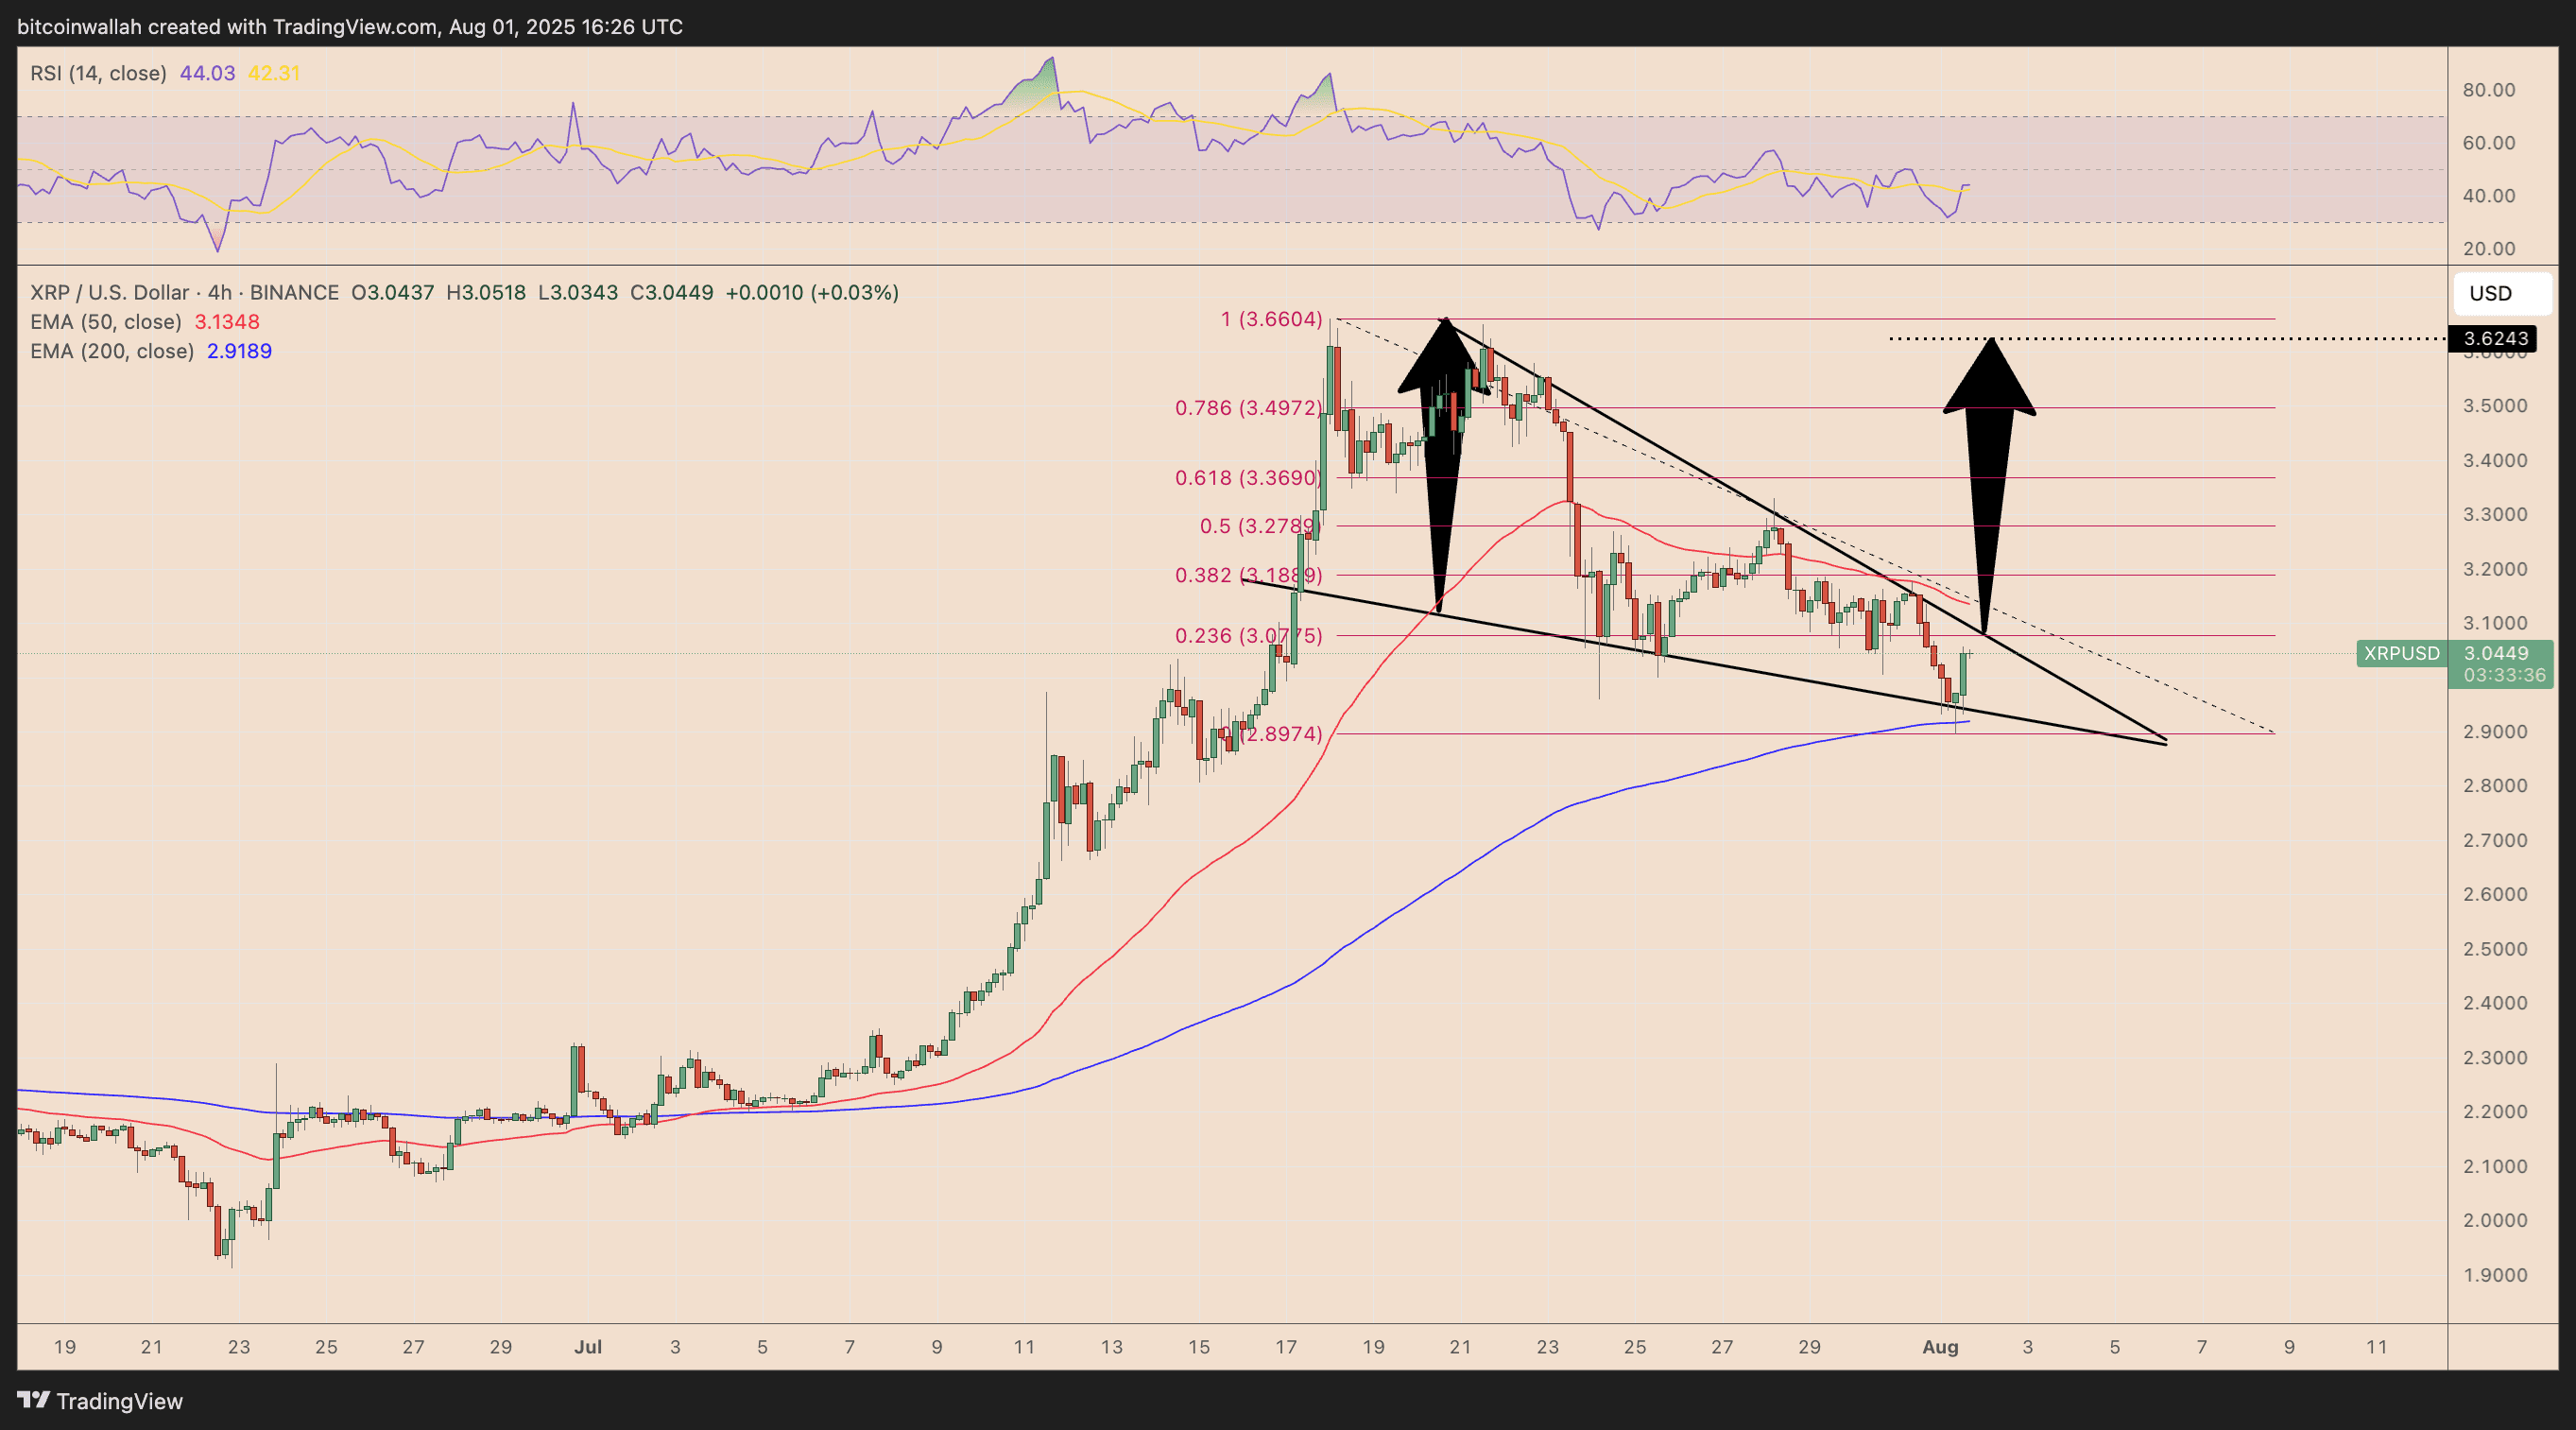
The XRP/USD pair bounced off the lower boundary of the wedge near the 200-4-hour exponential moving average (200-4-hour EMA; blue wave), showing strong demand at the support level.
A 20% rise to the $3.60–$3.65 range could happen in the coming days if the price breaks through the upper trend line of the wedge, coinciding with the Fibonacci line 0.236 at around $3.07.