On Saturday, the price of bitcoin $BTC was $113,227, decreasing only 0.06% intraday after a volatile 5-day pullback that trimmed recent highs by 5.78%.
On Saturday, August 2, #bitcoin it traded at $113,227, down 5.78% amid a 5-day losing streak.
The 20-day moving average at $117,000 acts as key resistance to attempts for bitcoin price to gain momentum.
Price prediction $BTC : will bitcoin return to $117k or slide to $110k?
From a technical perspective, the outlook remains mixed. The recent five-day decline brought bitcoin close to the lower Bollinger band around $112,000, signaling potential oversold conditions that could attract buyers on the dip. Volume on the pullback remains moderate, indicating an absence of intense panic selling.
The key resistance level to watch is the 20-day moving average at $117,000, which also coincides with the middle line of the Bollinger bands. Bitcoin's price has held steadily around the support level for over a week after a parabolic rise at the beginning of last month, which peaked at an all-time high of $122,838 on July 14.
A breakout above $117,700 could revive bullish sentiment and confirm that BTC has formed a short-term bottom at $113,000.
However, the MACD paints a more cautious picture. The MACD line is at -991.82 and still below the signal line, indicating bearish momentum. This suggests that bulls will need a clear catalyst, possibly a significant recovery in market volumes, to break the short-term trend.
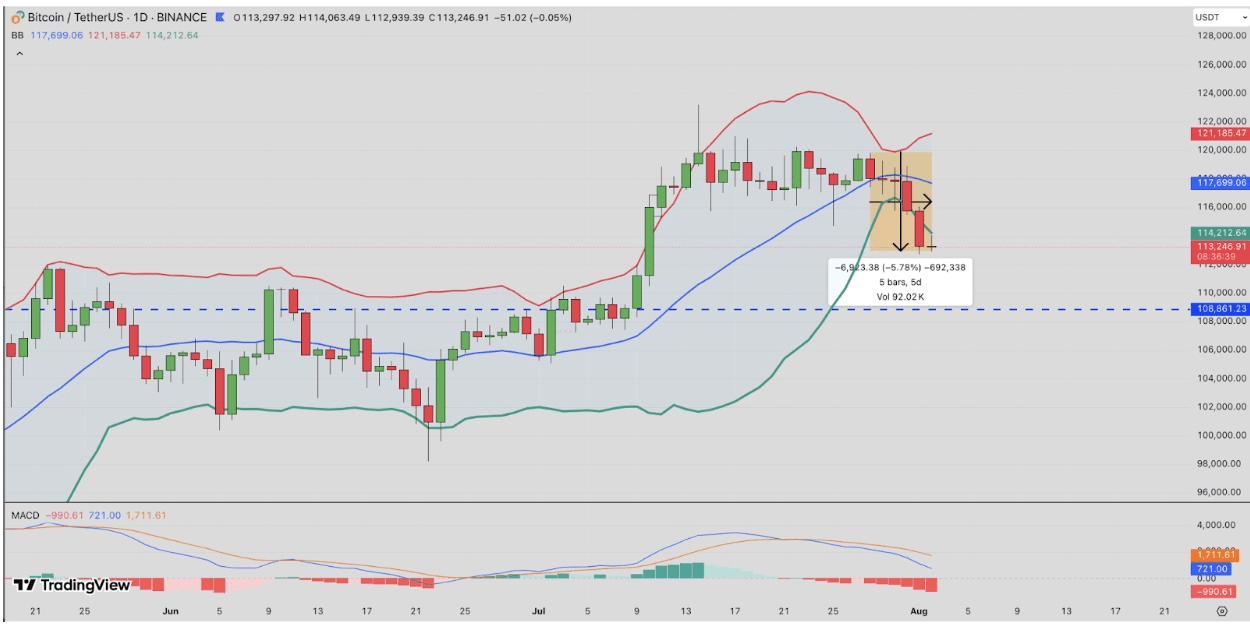
On the other hand, if support at $113,000 $BTC is broken, the next target for a decline is near $108,861, a horizontal support level from early July. A breakout below this level is likely to trigger panic selling and potentially cause a drop to $105,000.
In the near term, if the price #bitcoin retraces to $117,000, it would be the clearest signal that the bulls are back in control. Until then, the price of BTC remains at a crossroads, with $113,000 being the last line of defense against a deeper correction.
Like and subscribe......