---$BTC
🔍 BTC/USDT Technical Analysis Update (4H Chart)
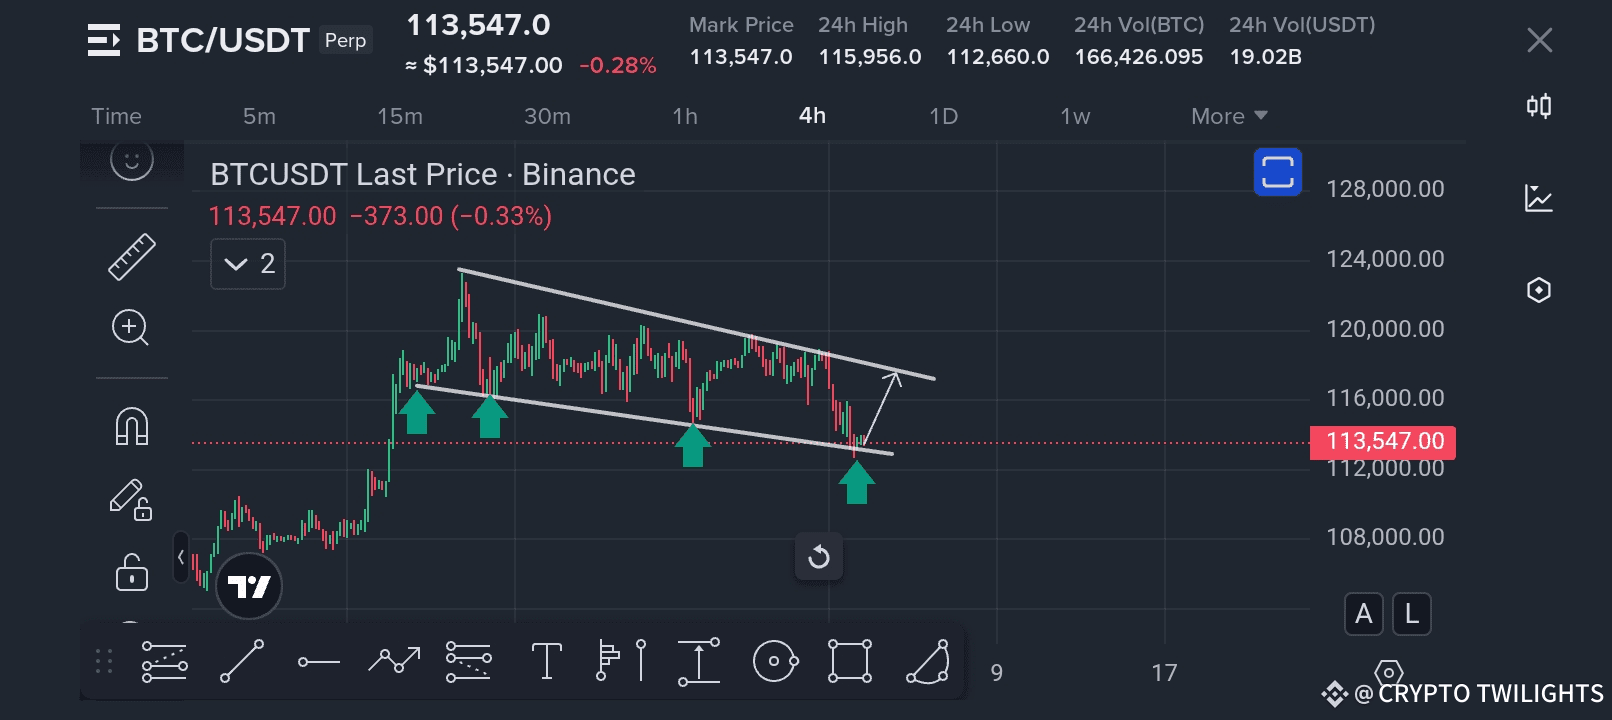
Bitcoin (BTC) is currently trading around $113,547, showing a marginal decline of 0.28% over the past 24 hours. The 4-hour chart presents a clear descending channel pattern, which has been respected multiple times, as highlighted by the four green arrows marking successful retests of the channel’s lower trendline.
📊 Key Observations:
✅ Descending Channel Formation:
BTC has been moving within a downward-sloping channel defined by consistent lower highs and lower lows. The upper resistance line and lower support line have been validated multiple times, indicating the market's strong adherence to this pattern.
✅ Strong Support Zone:
The price has once again touched the lower boundary of the channel (~$113,000) and is showing signs of a potential rebound. Historically, each touch of this support line has resulted in a bounce towards the upper trendline, making it a critical level for short-term traders to watch.
✅ Bounce Expected:
The current technical setup suggests that BTC may experience a relief rally targeting the upper channel resistance (~$116,000–$118,000 range) if buyers step in with volume confirmation.
✅ Volume & Momentum:
Despite the recent dip, the 24-hour volume remains robust at 166,426 BTC traded, with a USDT volume exceeding $19 billion. This indicates that market participants are still active and poised to react to key support and resistance interactions.
🚨 Short-Term Strategy:
🔵 Bullish Scenario:
If BTC holds above the lower trendline and confirms a reversal with a strong bullish candle, traders could look for long opportunities, aiming for the upper boundary of the channel. A break and close above the channel resistance could open doors for a larger upside move.
🔴 Bearish Scenario:
If BTC fails to maintain the support level and decisively breaks below ~$112,500, further downside could be expected, possibly targeting psychological levels near $110,000 or lower.
🔑 Important Levels:
Support: $112,500 – Key area for buyers to defend.
Resistance: $116,000–$118,000 – First major hurdle for bulls within the channel.
Breakout Confirmation: Sustained move above $118,000 could signal the end of the current downtrend and trigger a new bullish phase.
📅 Conclusion:
Bitcoin’s price action remains confined within a well-defined descending channel, and the market is currently at a pivotal point. A bounce from support could set the stage for a short-term rally, but traders should remain cautious and watch for either a confirmed reversal or a breakdown below key support levels.
Stay tuned for more updates and trade safely!
---