In the crypto market, some charts scream "Buy Me", and others whisper "Wait for me to explode." The latest $MAGIC
MAGIC/USDT 15-minute chart is doing a bit of both—and smart traders are already circling.
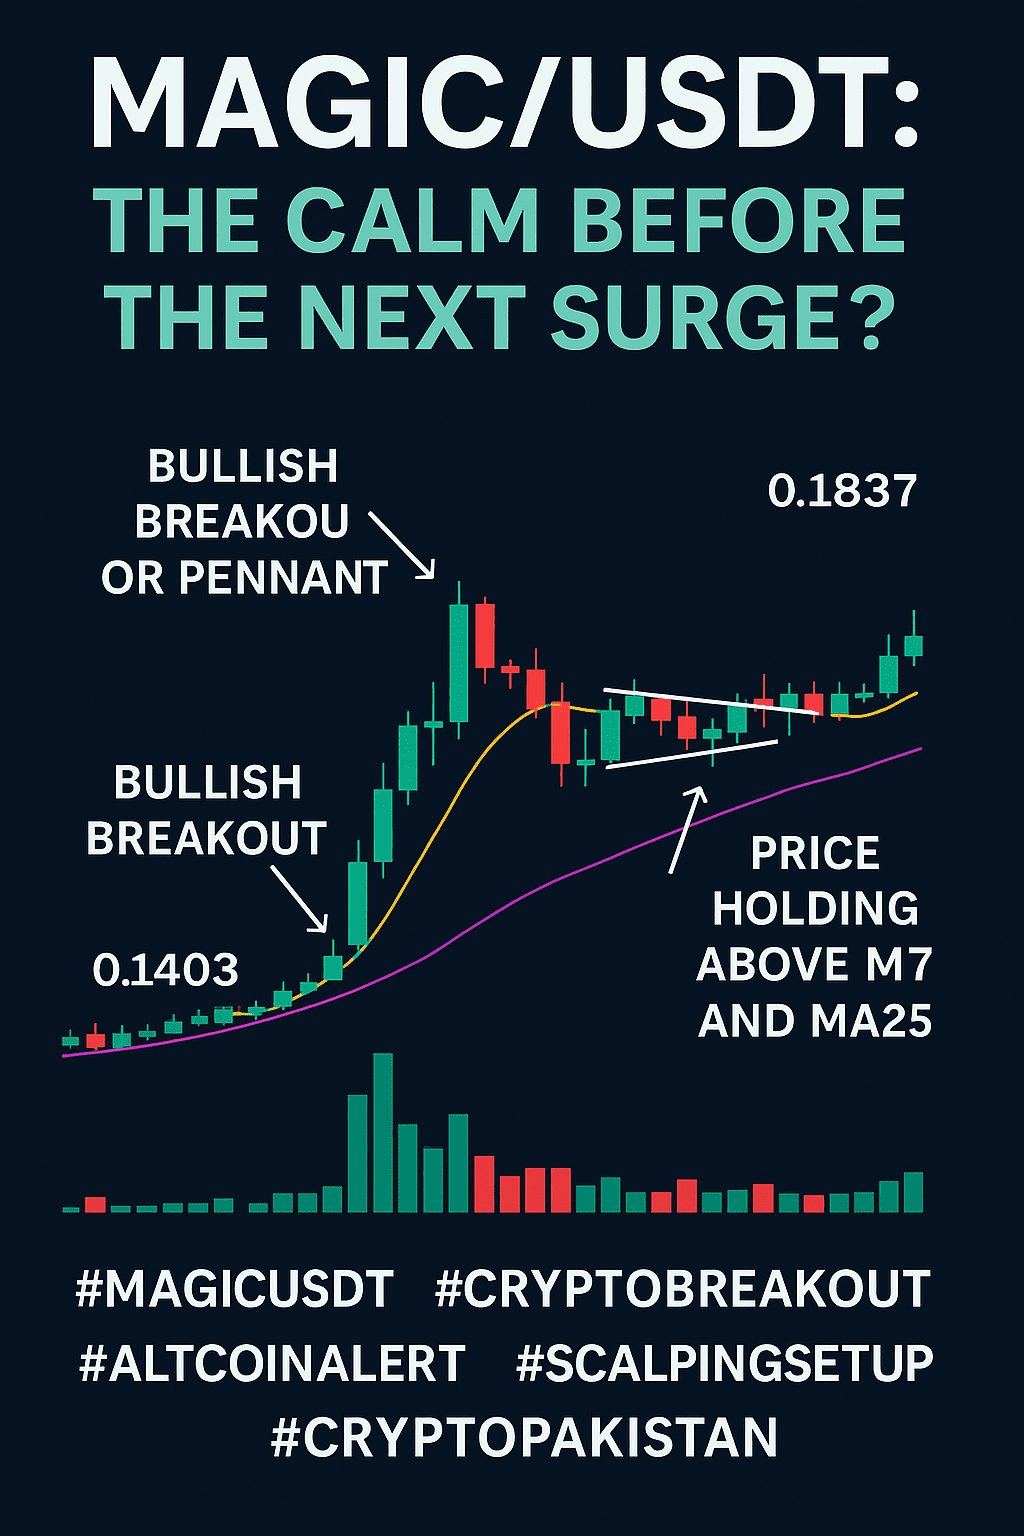
After climbing from 0.1403 to a local high of 0.1945, $MAGIC just clocked a +29.55% gain in a single day. But what’s more impressive isn’t the run-up—it’s what came after.
🧠 Here’s What the Chart is Saying:
Bullish Volume Spike followed by steady consolidation.
Price holding above the 7 MA and 25 MA, a clear sign of continued buyer dominance.
A clean bullish flag/pennant forming—textbook continuation pattern.
Rejection near 0.1945 followed by higher lows = accumulation, not distribution.
🔥 Why This Pattern is a Big Deal: This isn’t just a breakout—it’s a base being built for a bigger move. As long as $MAGIC stays above 0.179, the next breakout target sits above 0.195, potentially breaking into new local highs.
👀 Watch These Levels:
Breakout Zone: 0.1950+
Support Zone: 0.1730–0.1790
Volatility Trigger Point: Volume + price closing above previous high = BOOM.
📈 Scalpers and Swing Traders Love This Setup: Why? Because it’s low-risk, high-reward. The volume has dried up just enough to build tension—and the moment buyers step in, it could fly again
🧲 Conclusion:
This isn't just "magic" in the name—this chart pattern is pure trading magic. If you're sleeping on this, you're sleeping on what could be one of the cleanest breakout opportunities in the altcoin space this week.
#cryptouniverseofficial #Binance #altcoinseason #bullish #MarketPullback