If you’ve ever stared at a crypto chart full of red and green candles and wondered what they’re really saying, here’s the truth: Candles talk… and smart traders listen
Every candlestick is a story of the market—showing who’s in control, bulls 🐂 or bears 🐻. Understanding their types and patterns can turn confusion into profits. Let’s break it down:1️⃣ Three White Soldiers – The Bull Army
What it means: A powerful bullish reversal after a downtrend.
How it looks: 3 green candles in a row, each one bigger and stronger than the last.
Why it matters: Signals the market is ready to pump. 🚀
2️⃣ Doji – The Calm Before the StormWhat it means: Market indecision. Neither bulls nor bears are winning.
How it looks: A thin body with long wicks on both sides.
Pro tip: After a Doji, expect a big breakout in either direction! ⚡
3️⃣ Engulfing Candles – Trend Flipper
Bullish Engulfing: A big green candle swallows the previous red candle → trend may flip upward.
Bearish Engulfing: A big red candle eats the last green → trend may turn downward.
Why it matters: Engulfing patterns are early warning signals for smart traders.
4️⃣ The Hammer 🔨 – Bullish Reversal Signal
What it means: Bears tried to push down, but bulls fought back hard.
How it looks: A small green/red body with a long lower wick.
Trader move: Often a sign the bottom is in and a bounce is coming.
⚡ Quick Takeaway:
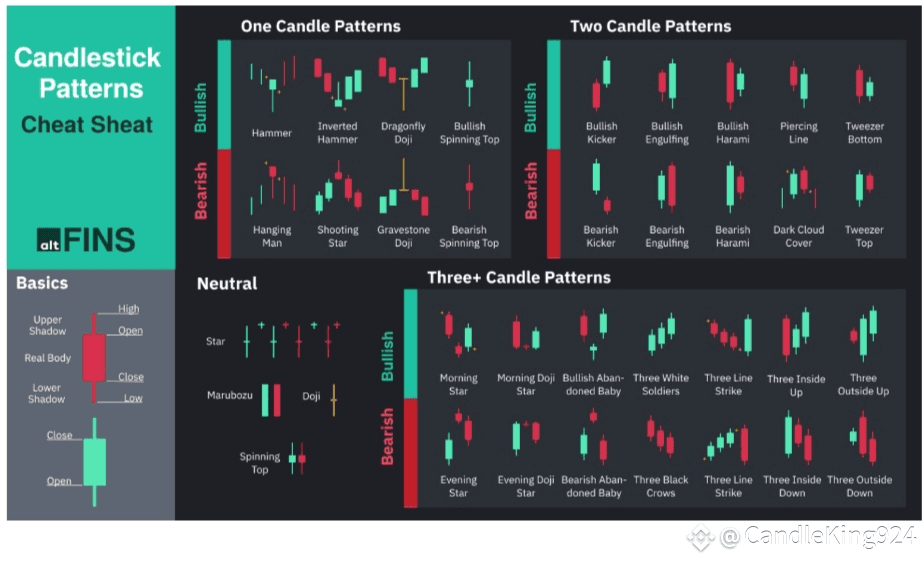
🟢 Green candles = Bullish momentum
🔴 Red candles = Bearish pressure
🕯️ Patterns = Market psychology in real-time
💡 Golden Rule:
“Don’t just watch candles… read them. They’re your free market signal.”
#Crypto #TradingTips #CandlestickPatterns #BTC #CryptoSignals #DayTrading
