🚀 Updated for 2025 — Perfect for Crypto & Stocks!
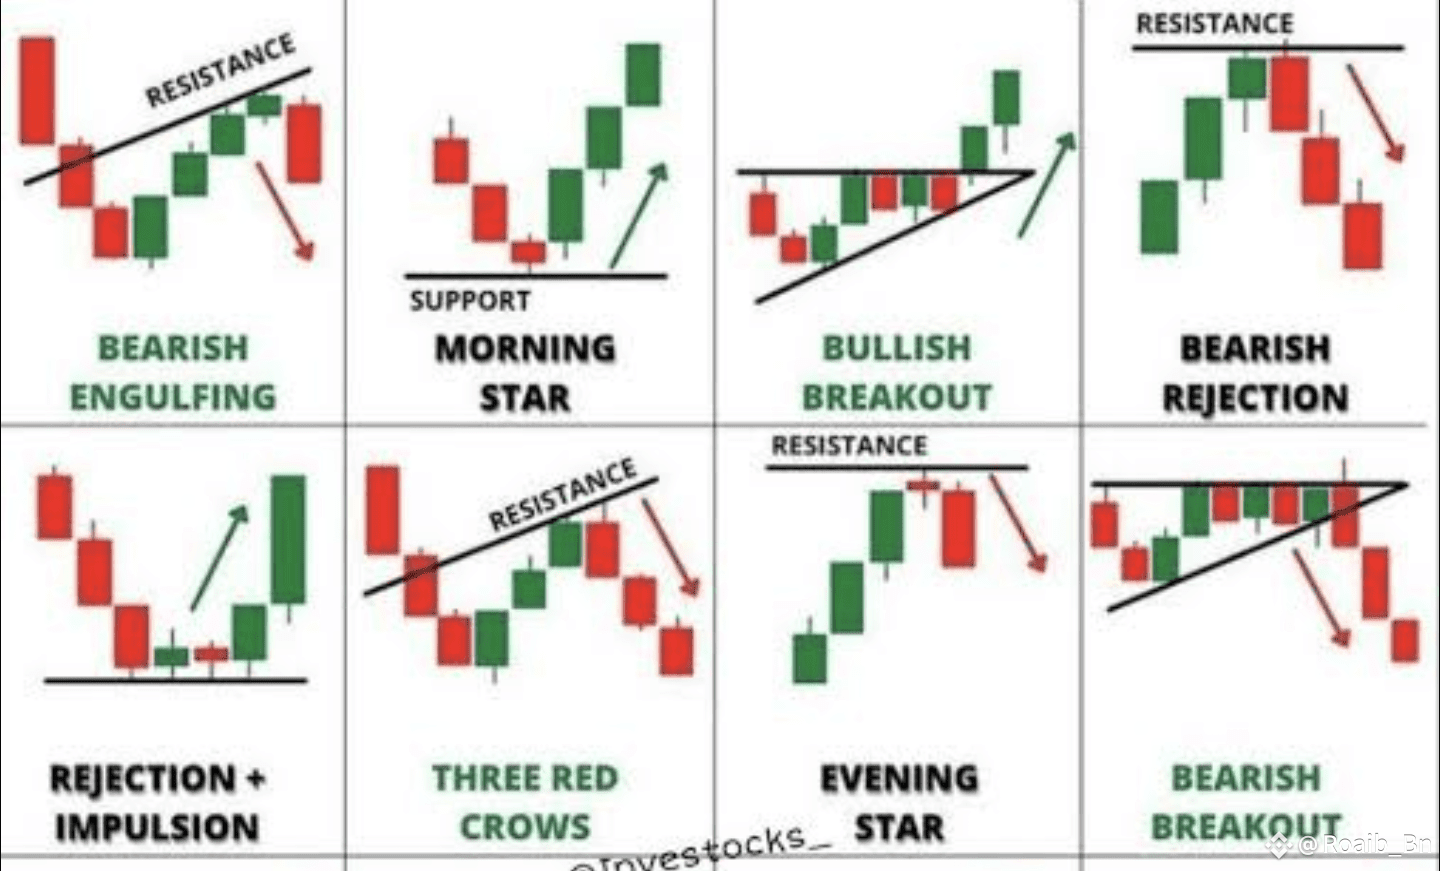
🔴 1. Bearish Engulfing
📉 A red candle swallows a green one near resistance — this signals strong selling pressure. Watch out!
🧠 Use it to time short entries or exit long trades.
🌅 2. Morning Star
🟢 Found near support, this 3-candle reversal screams "bottom is in!"
✅ Perfect for catching trend reversals early.
📈 3. Bullish Breakout
Price breaks upward out of consolidation.
🚀 Momentum is real — ride the breakout with confirmation!
🛑 4. Bearish Rejection
Price hits resistance, then reverses sharply with red candles.
⚠️ Classic sign of seller dominance.
---
✅ 5. Rejection + Impulsion
After small candles near support, a strong bullish impulse emerges.
🔥 Great for high-conviction entries with minimal risk.
👹 6. Three Red Crows
Three strong red candles forming near resistance = trend reversal!
🔻 A clear sell signal for many institutional traders.
🌇 7. Evening Star
This 3-candle pattern marks trend exhaustion — prepare for downside.
📉 Often seen at the top before a sharp fall.
🔺 8. Bearish Breakout
Breaks below support — the calm before the dump.
⚠️ Set tight stops and short strategically.
---
💬 Pro Tips
✅ Combine these patterns with RSI/volume
✅ Confirm breakouts with retests
✅ Use on 1H, 4H or Daily charts for accuracy
---
🔥 2025 Context: Why This Matters Now
With the U.S. election cycle heating up and global uncertainty brewing (📌 #TrumpTariffs, inflation, crypto volatility), technical precision is more important than ever!
🛡️ Let the charts guide you, not your emotions.
Here is the candles image 👇
👥 Drop your favorite pattern in the comments!
📍 Follow for daily chart setups & trading psychology tips
💡 Tag a friend who needs to learn these
#TrumpTariffs #MarketPullback #SECProjectCrypto #WhiteHouseDigitalAssetReport #FOMCMeeting