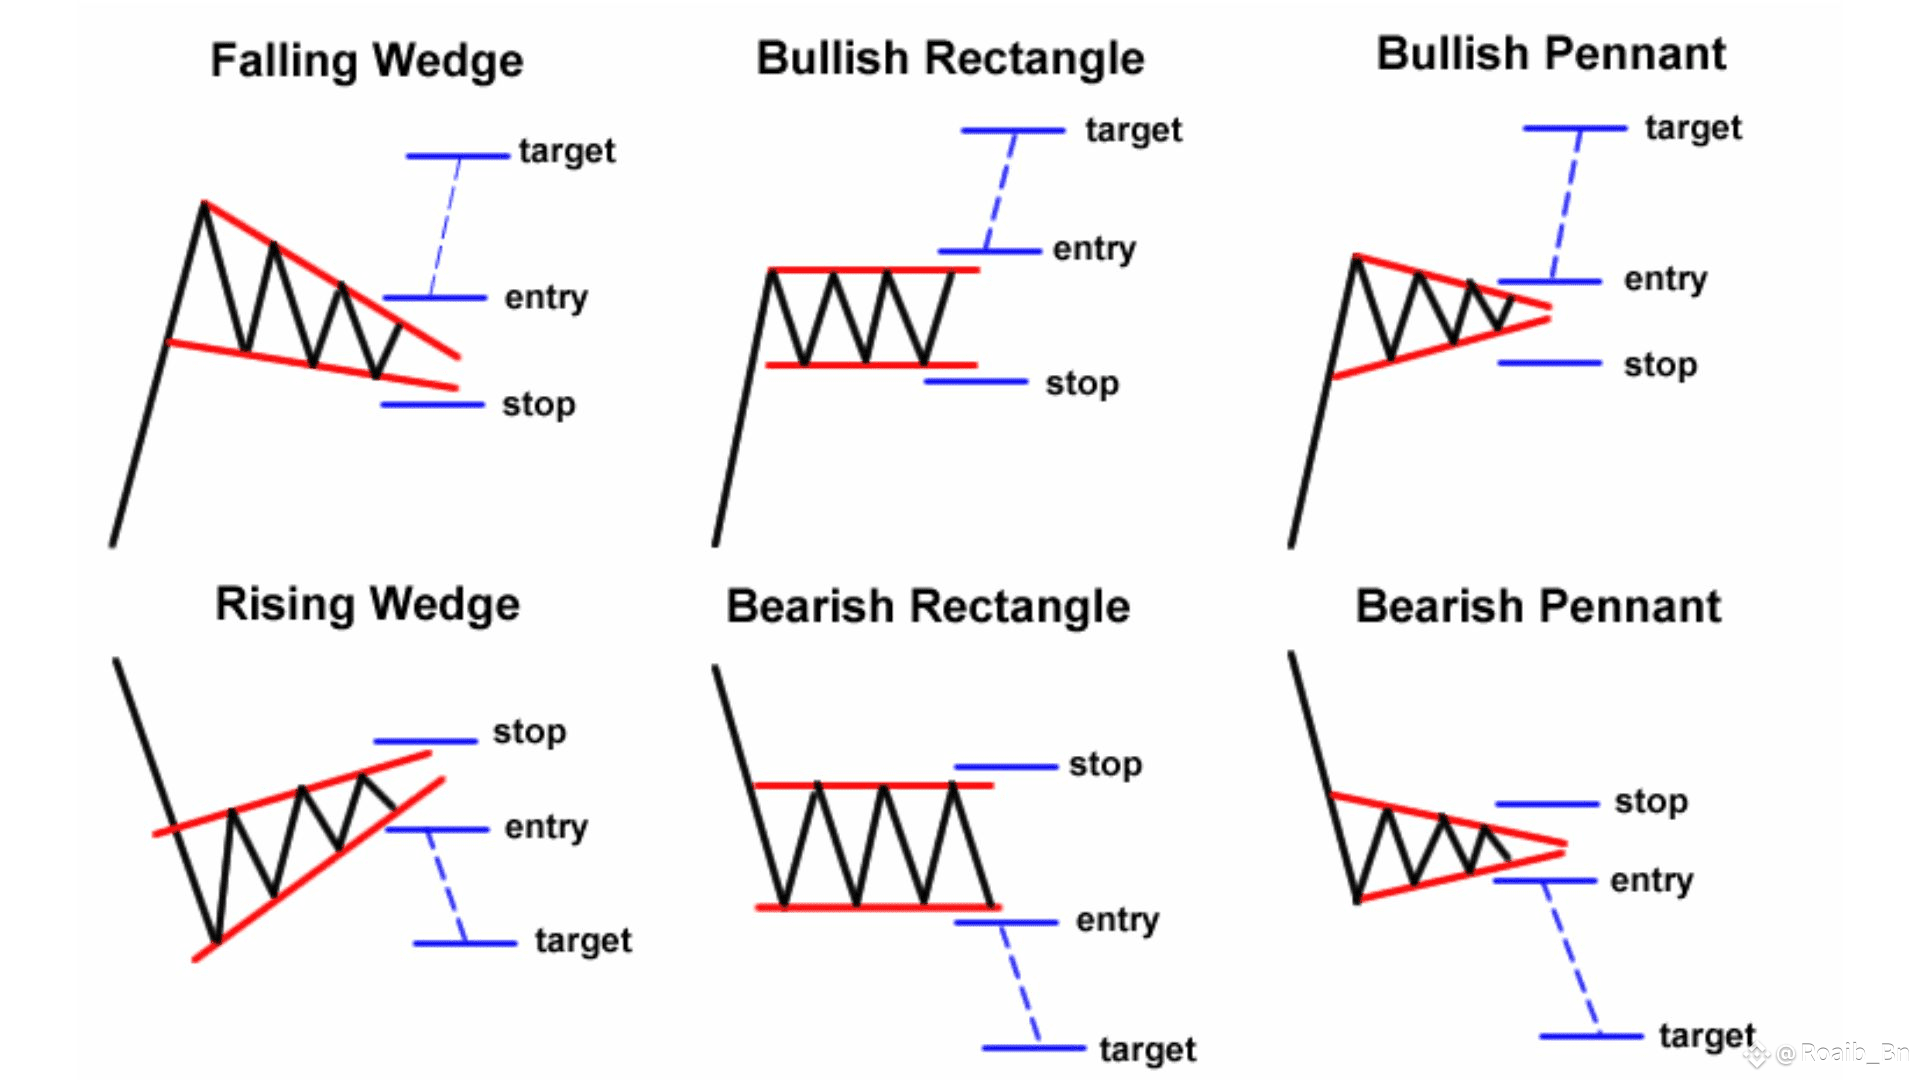
🔼 Bullish Patterns
1️⃣ Falling Wedge 🔻➡️📈
🔍 Tightening price action signals potential reversal.
📥 Entry: Breakout above wedge
🛑 Stop: Below support
🎯 Target: Height of the wedge
---
2️⃣ Bullish Rectangle ⬛📈
🔒 Sideways consolidation before a push higher
📥 Entry: Break above resistance
🛑 Stop: Below support
🎯 Target: Height of the rectangle
---
3️⃣ Bullish Pennant 🚩📈
🚀 After a strong pump, a small consolidation before liftoff!
📥 Entry: Breakout above pennant
🛑 Stop: Just below pattern
🎯 Target: Length of the flagpole
---
🔽 Bearish Patterns — Ride the Drop!
4️⃣ Rising Wedge 🔺➡️📉
📉 Often seen before a sharp drop
📥 Entry: Breakdown below wedge
🛑 Stop: Above resistance
🎯 Target: Height of the wedge
---
5️⃣ Bearish Rectangle ⬛📉
⏳ Consolidation before a breakdown
📥 Entry: Break below support
🛑 Stop: Above resistance
🎯 Target: Height of the rectangle
---
6️⃣ Bearish Pennant 🚩📉
📉 Forms after a fast dump — continuation likely
📥 Entry: Breakdown below pennant
🛑 Stop: Above pattern
🎯 Target: Pole length again downward
---
📸 Chart visual is below 👇
💬 Found this useful?
Then don’t forget to Like ❤️ | Comment 💬 | Follow 🔔 for more alpha on price action trading!
Let's master the market together 💪📈
#ProjectCrypto #TrumpTariffs #MarketPullback #WhiteHouseDigitalAssetReport #FOMCMeeting