In the world of crypto scalping, 15-minute charts can speak louder than hours of analysis—and the current $XRP
XRP/USDT setup is doing exactly that. With a sharp downtrend pressing the price from 3.13 all the way to 2.89, $XRP found itself at a critical decision point. But is this just a dead-cat bounce? Or the start of a bullish reversal?
🔍 Chart Overview:
Price Tapped a Local Support: $XRP hit 2.8920, a level previously tested and respected.
Volume Spike on Green Candle: Suggests buyer interest at the lows.
Short-Term MA Cross Play: The 7 MA and 25 MA are tightening, a signal that volatility is brewing.
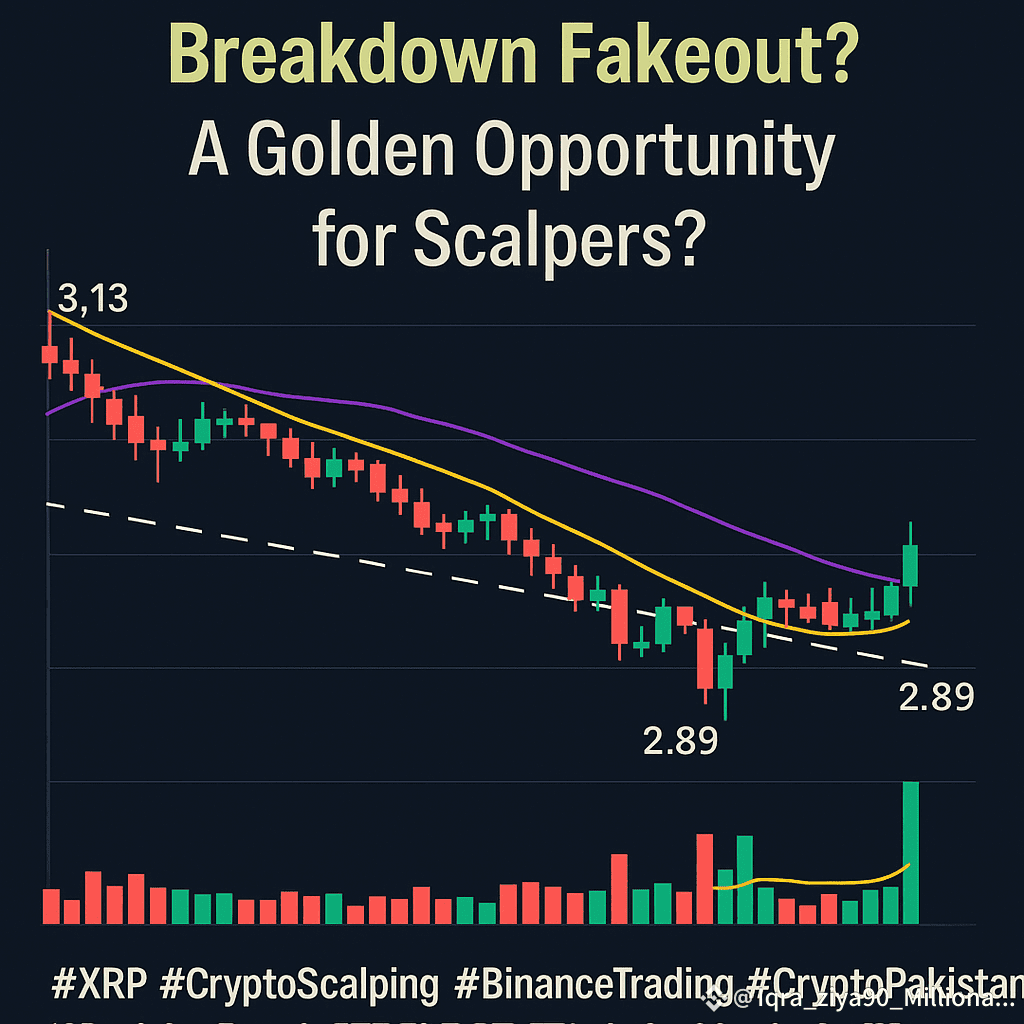
📉 Is it a Bull Trap or a Scalper’s Dream? This chart screams “watch me!” to experienced traders. The volume profile and candle behavior around the 2.89 zone suggest accumulation. And if the price breaks above 2.95, we might see a mini-rally toward 3.00—a perfect setup for intraday gains.
But here’s the catch: MA(99) at 3.04 remains a strong resistance. Breaking and holding above that? Now that’s confirmation of a real trend change.
💡 Smart Scalper Strategy:
Entry: On confirmation above 2.95
Target: Short-term swing toward 3.00–3.04
SL (Stop-Loss): Below 2.89 to protect from further breakdown
🧠 Why This Pattern Matters: This could be a fakeout breakdown turned bullish reversal. These setups are rare—but when they occur, they explode. If XRP regains strength here, it might just turn into the perfect case study of "from panic to profit."
📲 Final Thought: In the world of fast-moving charts, every candlestick tells a story. And right now, XRP is whispering to the scalpers: "Get ready."
#xrp #Binance #trading #crypto #altcoins